Software manuscript / BLS microscopy

Hi Robert, Carlo, Sal, Pierre, Think it would be good to follow up on software project. Pierre has made some progress here and would be good to try and define tasks a little bit clearer to make progress… There is always the potential issue of having “too many cooks in the kitchen” (that have different recipes for same thing) to move forward efficiently, something that I noticed can get quite confusing/frustrating when writing software together with people. So would be good to clearly assign tasks. I talked to Pierre today and he would be happy to integrate things in framework we have to try tie things together. What would foremost be needed would be ways of treating data, meaning code that takes a raw spectral image and meta-data and converts it into “standard” format (spectral representation) that can then be fitted. Then also “plugins” that serve a specific purpose in the analysis/rendering that can be included in framework. The way I see it (and please comment if you see differently), there are ~4 steps here: Take raw data (in .tif,, .dat, txt, etc. format) and meta data (in .cvs, xlsx, .dat, .txt, etc.) and render a standard spectral presentation. Also take provided instrument response in one of these formats and extract key parameters from this Fit the data with drop-down menu list of functions, that will include different functional dependences and functions corrected for instrument response. Generate/display a visual representation of results (frequency shift(s) and linewidth(s)), that is ideally interactive to some extent (and maybe has some funky features like looking at spectra at different points. These can be spatial maps and/or evolution with some other parameter (time, temperature, angle, etc.). Also be able to display maps of relative peak intensities in case of multiple peak fits, and whatever else useful you can think of. Extract “mechanical” parameters given assigned refractive indices and densities I think the idea of fitting modified functions (e.g. corrected based on instrument response) vs. deconvolving spectra makes more sense (as can account for more complex corrections due to non-optical anomalies in future –ultimately even functional variations in vicinity of e.g. phase transitions). It is also less error prone, as systematically doing decon with non-ideal registration data can really throw you off the cliff, so to speak. My understanding is that we kind of agreed on initial meta-data reporting format. Getting from 1 to 2 will no doubt be most challenging as it is very instrument specific. So instructions will need to be written for different BLS implementations. This is a huge project if we want it to be all inclusive.. so I would suggest to focus on making it work for just a couple of modalities first would be good (e.g. crossed VIPA, time-resolved, anisotropy, and maybe some time or temperature course of one of these). Extensions should then be more easy to navigate. At one point think would be good to involve SBS specific considerations also. Think would be good to discuss a while per email to gather thoughts and opinions (and already start to share codes), and then plan a meeting beginning of March -- how does first week of March look for everyone? I created this mailing list (software@biobrillouin.org) we can use for discussion. You should all be able to post to (and it makes it easier if we bring anyone else in along the way). At moment on this mailing list is Robert, Carlo, Sal, Pierre and myself. Let me know if I should add anyone. All the best, Kareem

Hi Kareem, thanks for restarting this and sorry for my silence, I just came back from US and was planning to start working on this again. Could you also add Sebastian (in CC) to the mailing list? As you outlined, I would split the project into two parts: 1) getting from the raw data to some standard "processed' spectra and 2) do data analysis/visualization on that. For the second part the way I envision it is: * the most updated definition of the file format from Pierre is this one (https://github.com/bio-brillouin/HDF5_BLS/blob/GUI_development/guides/Projec...), correct? In addition to this document I think it would be good to have a more structured description of the file (like this (https://github.com/prevedel-lab/Brillouin-standard-file/blob/main/docs/Bh5_f...)), where each field is clearly defined in terms of data type and dimensions. Sebastian was also suggesting that the document should contain the reasoning behind each specific choice in the specs and also things that we considered but decided had some issues (so in future we can look back at it). I still believe that the file format should contain the "processed" spectra (i.e. after FT and baseline subtraction for impulsive, or after taking a line profile and possibly linearization with VIPA,...) so we can apply standard data processing or visualization which is independent on the actual underlaying technique (e.g. VIPA, FP, stimulated, time domain, ...) * agree on an API to read the data from our file format (most likely a Python class). For that we should: 1) decide on which information is important to extract (spectral information, spatial coordinates, hyper-parameters, metadata,...) 2) implement an interface to read the data (e.g. readSpectrumAtIndex(...), readImage(...), ...) * build a GUI that use the previously defined API to show and process the data. I would say that, once we have a very solid description of the file format as in step 1, step 2 will come naturally and we can divide the actual implementation between us. Step 3 can also easily be implemented and divided between us once we have an API (and I am happy to work on the GUI myself). The first half of the project is the trickiest and I know Pierre has already done a lot of work in that direction. We should definitely agree on which extent we can define a standard to store the raw data, given the variability between labs, (and probably we should do it for common techniques like FP or VIPA) and how to implement the treatments, leaving to possibility to load some custom code in the pipeline to do the conversion. Let me know what you all think about this. If you agree I would start by making a document which clearly defines the file format in a structured way (as in my step 1 before). @Pierre could you write a new document or modify the document I originally made (https://github.com/prevedel-lab/Brillouin-standard-file/blob/main/docs/Bh5_f...) to reflect the latest structure you implemented for the file format? The metadata can still be defined in a separated excel sheet, as long as the data type and format is well defined there. Best regards, Carlo On Wed, Feb 12, 2025 at 02:19, Kareem Elsayad via Software wrote: Hi Robert, Carlo, Sal, Pierre, Think it would be good to follow up on software project. Pierre has made some progress here and would be good to try and define tasks a little bit clearer to make progress… There is always the potential issue of having “too many cooks in the kitchen” (that have different recipes for same thing) to move forward efficiently, something that I noticed can get quite confusing/frustrating when writing software together with people. So would be good to clearly assign tasks. I talked to Pierre today and he would be happy to integrate things in framework we have to try tie things together. What would foremost be needed would be ways of treating data, meaning code that takes a raw spectral image and meta-data and converts it into “standard” format (spectral representation) that can then be fitted. Then also “plugins” that serve a specific purpose in the analysis/rendering that can be included in framework. The way I see it (and please comment if you see differently), there are ~4 steps here: * Take raw data (in .tif,, .dat, txt, etc. format) and meta data (in .cvs, xlsx, .dat, .txt, etc.) and render a standard spectral presentation. Also take provided instrument response in one of these formats and extract key parameters from this * Fit the data with drop-down menu list of functions, that will include different functional dependences and functions corrected for instrument response. * Generate/display a visual representation of results (frequency shift(s) and linewidth(s)), that is ideally interactive to some extent (and maybe has some funky features like looking at spectra at different points. These can be spatial maps and/or evolution with some other parameter (time, temperature, angle, etc.). Also be able to display maps of relative peak intensities in case of multiple peak fits, and whatever else useful you can think of. * Extract “mechanical” parameters given assigned refractive indices and densities I think the idea of fitting modified functions (e.g. corrected based on instrument response) vs. deconvolving spectra makes more sense (as can account for more complex corrections due to non-optical anomalies in future –ultimately even functional variations in vicinity of e.g. phase transitions). It is also less error prone, as systematically doing decon with non-ideal registration data can really throw you off the cliff, so to speak. My understanding is that we kind of agreed on initial meta-data reporting format. Getting from 1 to 2 will no doubt be most challenging as it is very instrument specific. So instructions will need to be written for different BLS implementations. This is a huge project if we want it to be all inclusive.. so I would suggest to focus on making it work for just a couple of modalities first would be good (e.g. crossed VIPA, time-resolved, anisotropy, and maybe some time or temperature course of one of these). Extensions should then be more easy to navigate. At one point think would be good to involve SBS specific considerations also. Think would be good to discuss a while per email to gather thoughts and opinions (and already start to share codes), and then plan a meeting beginning of March -- how does first week of March look for everyone? I created this mailing list (software@biobrillouin.org (mailto:software@biobrillouin.org)) we can use for discussion. You should all be able to post to (and it makes it easier if we bring anyone else in along the way). At moment on this mailing list is Robert, Carlo, Sal, Pierre and myself. Let me know if I should add anyone. All the best, Kareem

Hi all, I agree with the things enumerated and points made by Kareem/Carlo! I guess I would advocate for starting from a position of simplicity. We probably don't want to get weighed down by trying to include a bunch of bells and whistles from the start as these can be easily added once there is a minimally viable stable product. As long as data can be loaded to local memory, then treated in various (initially simple) ways through the GUI (and maybe maintain non-GUI compatibility for command-line warriors like myself), then the bh5 formatting stuff can be sorted on the back end? I definitely agree with Carlo's structure set out in the file format document; but all of that data will be floating around the memory in some shape or form and just needs to be wrapped up and packaged (according to Carlo's structure e.g.) when the user is happy and presses the "generate h5 filestore" etc. (?) Definitely agree with the recommendation to create the alpha using mainly requirements that our 3 labs would find useful (import filetypes, treatments, etc), and then we can add on more universal functionality second / get some beta testers in from other labs etc. I'm able to support on whatever jobs need doing and am free to meet in the beginning of March like you mentioned Kareem. Hope you guys have a nice weekend, Cheers, Sal --------------------------------------------------------------- Salvatore La Cavera III Royal Academy of Engineering Research Fellow Nottingham Research Fellow Optics and Photonics Group University of Nottingham Email: salvatore.lacaveraiii@nottingham.ac.uk<mailto:salvatore.lacaveraiii@nottingham.ac.uk> ORCID iD: 0000-0003-0210-3102 [cid:dca9910a-f406-4b8a-872d-b438de13d1f5]<https://outlook.office.com/bookwithme/user/6a3f960a8e89429cb6fc693c01d10119@...> Book a Coffee and Research chat with me! ________________________________ From: Carlo Bevilacqua via Software <software@biobrillouin.org> Sent: 12 February 2025 13:31 To: Kareem Elsayad <kareem.elsayad@meduniwien.ac.at> Cc: sebastian.hambura@embl.de <sebastian.hambura@embl.de>; software@biobrillouin.org <software@biobrillouin.org> Subject: [Software] Re: Software manuscript / BLS microscopy You don't often get email from software@biobrillouin.org. Learn why this is important<https://aka.ms/LearnAboutSenderIdentification> Hi Kareem, thanks for restarting this and sorry for my silence, I just came back from US and was planning to start working on this again. Could you also add Sebastian (in CC) to the mailing list? As you outlined, I would split the project into two parts: 1) getting from the raw data to some standard "processed' spectra and 2) do data analysis/visualization on that. For the second part the way I envision it is: 1. the most updated definition of the file format from Pierre is this one<https://github.com/bio-brillouin/HDF5_BLS/blob/GUI_development/guides/Projec...>, correct? In addition to this document I think it would be good to have a more structured description of the file (like this<https://github.com/prevedel-lab/Brillouin-standard-file/blob/main/docs/Bh5_f...>), where each field is clearly defined in terms of data type and dimensions. Sebastian was also suggesting that the document should contain the reasoning behind each specific choice in the specs and also things that we considered but decided had some issues (so in future we can look back at it). I still believe that the file format should contain the "processed" spectra (i.e. after FT and baseline subtraction for impulsive, or after taking a line profile and possibly linearization with VIPA,...) so we can apply standard data processing or visualization which is independent on the actual underlaying technique (e.g. VIPA, FP, stimulated, time domain, ...) 2. agree on an API to read the data from our file format (most likely a Python class). For that we should: 1) decide on which information is important to extract (spectral information, spatial coordinates, hyper-parameters, metadata,...) 2) implement an interface to read the data (e.g. readSpectrumAtIndex(...), readImage(...), ...) 3. build a GUI that use the previously defined API to show and process the data. I would say that, once we have a very solid description of the file format as in step 1, step 2 will come naturally and we can divide the actual implementation between us. Step 3 can also easily be implemented and divided between us once we have an API (and I am happy to work on the GUI myself). The first half of the project is the trickiest and I know Pierre has already done a lot of work in that direction. We should definitely agree on which extent we can define a standard to store the raw data, given the variability between labs, (and probably we should do it for common techniques like FP or VIPA) and how to implement the treatments, leaving to possibility to load some custom code in the pipeline to do the conversion. Let me know what you all think about this. If you agree I would start by making a document which clearly defines the file format in a structured way (as in my step 1 before). @Pierre could you write a new document or modify the document I originally made<https://github.com/prevedel-lab/Brillouin-standard-file/blob/main/docs/Bh5_f...> to reflect the latest structure you implemented for the file format? The metadata can still be defined in a separated excel sheet, as long as the data type and format is well defined there. Best regards, Carlo On Wed, Feb 12, 2025 at 02:19, Kareem Elsayad via Software <software@biobrillouin.org<mailto:software@biobrillouin.org>> wrote: Hi Robert, Carlo, Sal, Pierre, Think it would be good to follow up on software project. Pierre has made some progress here and would be good to try and define tasks a little bit clearer to make progress… There is always the potential issue of having “too many cooks in the kitchen” (that have different recipes for same thing) to move forward efficiently, something that I noticed can get quite confusing/frustrating when writing software together with people. So would be good to clearly assign tasks. I talked to Pierre today and he would be happy to integrate things in framework we have to try tie things together. What would foremost be needed would be ways of treating data, meaning code that takes a raw spectral image and meta-data and converts it into “standard” format (spectral representation) that can then be fitted. Then also “plugins” that serve a specific purpose in the analysis/rendering that can be included in framework. The way I see it (and please comment if you see differently), there are ~4 steps here: 1. Take raw data (in .tif,, .dat, txt, etc. format) and meta data (in .cvs, xlsx, .dat, .txt, etc.) and render a standard spectral presentation. Also take provided instrument response in one of these formats and extract key parameters from this 2. Fit the data with drop-down menu list of functions, that will include different functional dependences and functions corrected for instrument response. 3. Generate/display a visual representation of results (frequency shift(s) and linewidth(s)), that is ideally interactive to some extent (and maybe has some funky features like looking at spectra at different points. These can be spatial maps and/or evolution with some other parameter (time, temperature, angle, etc.). Also be able to display maps of relative peak intensities in case of multiple peak fits, and whatever else useful you can think of. 4. Extract “mechanical” parameters given assigned refractive indices and densities I think the idea of fitting modified functions (e.g. corrected based on instrument response) vs. deconvolving spectra makes more sense (as can account for more complex corrections due to non-optical anomalies in future –ultimately even functional variations in vicinity of e.g. phase transitions). It is also less error prone, as systematically doing decon with non-ideal registration data can really throw you off the cliff, so to speak. My understanding is that we kind of agreed on initial meta-data reporting format. Getting from 1 to 2 will no doubt be most challenging as it is very instrument specific. So instructions will need to be written for different BLS implementations. This is a huge project if we want it to be all inclusive.. so I would suggest to focus on making it work for just a couple of modalities first would be good (e.g. crossed VIPA, time-resolved, anisotropy, and maybe some time or temperature course of one of these). Extensions should then be more easy to navigate. At one point think would be good to involve SBS specific considerations also. Think would be good to discuss a while per email to gather thoughts and opinions (and already start to share codes), and then plan a meeting beginning of March -- how does first week of March look for everyone? I created this mailing list (software@biobrillouin.org<mailto:software@biobrillouin.org>) we can use for discussion. You should all be able to post to (and it makes it easier if we bring anyone else in along the way). At moment on this mailing list is Robert, Carlo, Sal, Pierre and myself. Let me know if I should add anyone. All the best, Kareem This message and any attachment are intended solely for the addressee and may contain confidential information. If you have received this message in error, please contact the sender and delete the email and attachment. Any views or opinions expressed by the author of this email do not necessarily reflect the views of the University of Nottingham. Email communications with the University of Nottingham may be monitored where permitted by law.

Hi everyone, Sorry for the delayed response, I just went through the loss of Ren (my dog) and wasn’t at all able to answer. First of, Sal, I am making progress and I should have everything you have made on your branch integrated to the GUI branch soon, at which point I will push everything to main. Regarding the project, I think I align with Sal: keep things as simple as possible. My approach was to divide everything in 3 mostly independent layers: - Store data in an organized file that anyone can use, and make it easy to do - Convert these data into something that has physical significance: a Power Spectrum Density - Extract information from this Power Spectrum Density Each layer has its own challenge but they are independent on the challenge of having people using it: personally, if I had someone come to me with a new software to play with my measures, I would most likely only look at it for 1 minute (or less depending who made it) with a lot of apprehension and then based on how simple it looks and how much I understood of it, use it or - what is most likely - discard it. This is why Project.pdf <https://github.com/bio-brillouin/HDF5_BLS/blob/GUI_development/guides/Projec...> is essentially meant to say: we put data arrays in groups and give them attributes written in text, but you can also create groups within groups to organize your data! I believe most of the people in the BioBrillouin society will have the same approach and before having something complex that can do a lot, I think it’s best to have something simple that can just unify the format (which in itself is a lot) and that people can use right away with a minimal impact on their own individual pipelines for data processing. To be honest, I don’t think people will blindly trust our software at first to treat their data, but they will most likely use it at first to organize their raw spectra, and maybe add their own treated data if they are feeling particularly adventurous. But that is not a problem as long as we start a movement. From there yes, we can complexity and create custom file architectures but that is already too complex I think for this first project. If we can all just import our data to the wrapper and specify their attributes, this will already be a success. Then for the paper, if we can all add a custom code to treat these data to obtain a PSD, I think this will be enough. As I said, the current API already allows you to add your data in a variety of format, so it’s just a question of developing the PSD conversion before having something we can publish (and then tell people to use). A few extra points: - Working with my setup, I realized if the user could choose between different algorithms to treat their own data, it would make the overall project much more usable (if an algorithm bugs for whatever reason, you can use another one) so I created 2 bottle necks in the form of functions (for PSD conversion and treatment) that would inspect modules dedicated to either PSD conversion or treatment, and list existing functions. It’s in between classical and modular programming but it makes the development of new PSD conversion code and treatment way way easier - The GUI is developed using oriented-object programming. Therefore I have already made some low-level choices that kind of impact all the GUI. I’m not saying they are the best choices, I’m just saying that they work, so if you want to work on the GUI, I would either recommend getting familiar with these choices, or making sure that all the functionalities are preserved, particularly the ones that are invisible (logging of treatment steps, treatment errors…) I’ll try merging the branches on Git asap and will definitely send you all an email when it’s done :) Best, Pierre Pierre Bouvet, PhD Post-doctoral Fellow Medical University Vienna Department of Anatomy and Cell Biology Wahringer Straße 13, 1090 Wien, Austria
On 14/2/25, at 19:36, Sal La Cavera Iii via Software <software@biobrillouin.org> wrote:
Hi all,
I agree with the things enumerated and points made by Kareem/Carlo! I guess I would advocate for starting from a position of simplicity. We probably don't want to get weighed down by trying to include a bunch of bells and whistles from the start as these can be easily added once there is a minimally viable stable product.
As long as data can be loaded to local memory, then treated in various (initially simple) ways through the GUI (and maybe maintain non-GUI compatibility for command-line warriors like myself), then the bh5 formatting stuff can be sorted on the back end? I definitely agree with Carlo's structure set out in the file format document; but all of that data will be floating around the memory in some shape or form and just needs to be wrapped up and packaged (according to Carlo's structure e.g.) when the user is happy and presses the "generate h5 filestore" etc. (?)
Definitely agree with the recommendation to create the alpha using mainly requirements that our 3 labs would find useful (import filetypes, treatments, etc), and then we can add on more universal functionality second / get some beta testers in from other labs etc.
I'm able to support on whatever jobs need doing and am free to meet in the beginning of March like you mentioned Kareem.
Hope you guys have a nice weekend,
Cheers,
Sal
--------------------------------------------------------------- Salvatore La Cavera III Royal Academy of Engineering Research Fellow Nottingham Research Fellow Optics and Photonics Group University of Nottingham Email: salvatore.lacaveraiii@nottingham.ac.uk <mailto:salvatore.lacaveraiii@nottingham.ac.uk> ORCID iD: 0000-0003-0210-3102 <Outlook-tygjxucs.png> <https://outlook.office.com/bookwithme/user/6a3f960a8e89429cb6fc693c01d10119@...> Book a Coffee and Research chat with me! From: Carlo Bevilacqua via Software <software@biobrillouin.org <mailto:software@biobrillouin.org>> Sent: 12 February 2025 13:31 To: Kareem Elsayad <kareem.elsayad@meduniwien.ac.at <mailto:kareem.elsayad@meduniwien.ac.at>> Cc: sebastian.hambura@embl.de <mailto:sebastian.hambura@embl.de> <sebastian.hambura@embl.de <mailto:sebastian.hambura@embl.de>>; software@biobrillouin.org <mailto:software@biobrillouin.org> <software@biobrillouin.org <mailto:software@biobrillouin.org>> Subject: [Software] Re: Software manuscript / BLS microscopy
You don't often get email from software@biobrillouin.org <mailto:software@biobrillouin.org>. Learn why this is important <https://aka.ms/LearnAboutSenderIdentification> Hi Kareem, thanks for restarting this and sorry for my silence, I just came back from US and was planning to start working on this again. Could you also add Sebastian (in CC) to the mailing list?
As you outlined, I would split the project into two parts: 1) getting from the raw data to some standard "processed' spectra and 2) do data analysis/visualization on that. For the second part the way I envision it is: the most updated definition of the file format from Pierre is this one <https://github.com/bio-brillouin/HDF5_BLS/blob/GUI_development/guides/Projec...>, correct? In addition to this document I think it would be good to have a more structured description of the file (like this <https://github.com/prevedel-lab/Brillouin-standard-file/blob/main/docs/Bh5_f...>), where each field is clearly defined in terms of data type and dimensions. Sebastian was also suggesting that the document should contain the reasoning behind each specific choice in the specs and also things that we considered but decided had some issues (so in future we can look back at it). I still believe that the file format should contain the "processed" spectra (i.e. after FT and baseline subtraction for impulsive, or after taking a line profile and possibly linearization with VIPA,...) so we can apply standard data processing or visualization which is independent on the actual underlaying technique (e.g. VIPA, FP, stimulated, time domain, ...) agree on an API to read the data from our file format (most likely a Python class). For that we should: 1) decide on which information is important to extract (spectral information, spatial coordinates, hyper-parameters, metadata,...) 2) implement an interface to read the data (e.g. readSpectrumAtIndex(...), readImage(...), ...) build a GUI that use the previously defined API to show and process the data. I would say that, once we have a very solid description of the file format as in step 1, step 2 will come naturally and we can divide the actual implementation between us. Step 3 can also easily be implemented and divided between us once we have an API (and I am happy to work on the GUI myself).
The first half of the project is the trickiest and I know Pierre has already done a lot of work in that direction. We should definitely agree on which extent we can define a standard to store the raw data, given the variability between labs, (and probably we should do it for common techniques like FP or VIPA) and how to implement the treatments, leaving to possibility to load some custom code in the pipeline to do the conversion.
Let me know what you all think about this. If you agree I would start by making a document which clearly defines the file format in a structured way (as in my step 1 before). @Pierre could you write a new document or modify the document I originally made <https://github.com/prevedel-lab/Brillouin-standard-file/blob/main/docs/Bh5_f...> to reflect the latest structure you implemented for the file format? The metadata can still be defined in a separated excel sheet, as long as the data type and format is well defined there.
Best regards, Carlo
On Wed, Feb 12, 2025 at 02:19, Kareem Elsayad via Software <software@biobrillouin.org <mailto:software@biobrillouin.org>> wrote: Hi Robert, Carlo, Sal, Pierre,
Think it would be good to follow up on software project. Pierre has made some progress here and would be good to try and define tasks a little bit clearer to make progress…
There is always the potential issue of having “too many cooks in the kitchen” (that have different recipes for same thing) to move forward efficiently, something that I noticed can get quite confusing/frustrating when writing software together with people. So would be good to clearly assign tasks. I talked to Pierre today and he would be happy to integrate things in framework we have to try tie things together. What would foremost be needed would be ways of treating data, meaning code that takes a raw spectral image and meta-data and converts it into “standard” format (spectral representation) that can then be fitted. Then also “plugins” that serve a specific purpose in the analysis/rendering that can be included in framework.
The way I see it (and please comment if you see differently), there are ~4 steps here:
Take raw data (in .tif,, .dat, txt, etc. format) and meta data (in .cvs, xlsx, .dat, .txt, etc.) and render a standard spectral presentation. Also take provided instrument response in one of these formats and extract key parameters from this Fit the data with drop-down menu list of functions, that will include different functional dependences and functions corrected for instrument response. Generate/display a visual representation of results (frequency shift(s) and linewidth(s)), that is ideally interactive to some extent (and maybe has some funky features like looking at spectra at different points. These can be spatial maps and/or evolution with some other parameter (time, temperature, angle, etc.). Also be able to display maps of relative peak intensities in case of multiple peak fits, and whatever else useful you can think of. Extract “mechanical” parameters given assigned refractive indices and densities
I think the idea of fitting modified functions (e.g. corrected based on instrument response) vs. deconvolving spectra makes more sense (as can account for more complex corrections due to non-optical anomalies in future –ultimately even functional variations in vicinity of e.g. phase transitions). It is also less error prone, as systematically doing decon with non-ideal registration data can really throw you off the cliff, so to speak.
My understanding is that we kind of agreed on initial meta-data reporting format. Getting from 1 to 2 will no doubt be most challenging as it is very instrument specific. So instructions will need to be written for different BLS implementations.
This is a huge project if we want it to be all inclusive.. so I would suggest to focus on making it work for just a couple of modalities first would be good (e.g. crossed VIPA, time-resolved, anisotropy, and maybe some time or temperature course of one of these). Extensions should then be more easy to navigate. At one point think would be good to involve SBS specific considerations also.
Think would be good to discuss a while per email to gather thoughts and opinions (and already start to share codes), and then plan a meeting beginning of March -- how does first week of March look for everyone?
I created this mailing list (software@biobrillouin.org <mailto:software@biobrillouin.org>) we can use for discussion. You should all be able to post to (and it makes it easier if we bring anyone else in along the way).
At moment on this mailing list is Robert, Carlo, Sal, Pierre and myself. Let me know if I should add anyone.
All the best,
Kareem
This message and any attachment are intended solely for the addressee and may contain confidential information. If you have received this message in error, please contact the sender and delete the email and attachment. Any views or opinions expressed by the author of this email do not necessarily reflect the views of the University of Nottingham. Email communications with the University of Nottingham may be monitored where permitted by law. _______________________________________________ Software mailing list -- software@biobrillouin.org <mailto:software@biobrillouin.org> To unsubscribe send an email to software-leave@biobrillouin.org <mailto:software-leave@biobrillouin.org>
Hi Pierre, hi Sal, thanks for sharing your thoughts about it. @Pierre I am very sorry that Ren passed away :( As far as I understood you are suggesting to work on the individual aspects separately and then merge them together at a later stage? I am fine with that but I still think it is very important to now agree on what should be in the file format we are defining, because that is kind of the core of the project and will affect a lot of the design choices. I am happy to start working on the GUI for data visualization. In my idea, it will be something similar to this (https://www.nature.com/articles/s41592-023-02054-z/figures/10) but written in dash (https://dash.plotly.com/), so it is a web app that for now can run locally (so no transfer of data to an external server is required) but in the future can easily be uploaded to a website that people can just use without installing anything on their computer. The question is how much of the data processing should be possible to do (or trigger) from the same GUI? I think at least a drop down menu with different fitting functions should be there, so the user can quickly check the results on a spectrum from a specific point in the image. @Pierre how are you envisioning the GUI you are working on? As far as I understood it is mainly to get the raw data and save it to our HDF5 format with some treatment on it. One idea could be to have a shared list of features that we are implementing in the GUI as we work on it, to avoid having the same functionality duplicated (or worst inconsistent) between the GUI for generating our file format and the GUI for visualization. Let me know what you think about it. Best, Carlo On Mon, Feb 17, 2025 at 11:04, Pierre Bouvet via Software wrote: Hi everyone, Sorry for the delayed response, I just went through the loss of Ren (my dog) and wasn’t at all able to answer. First of, Sal, I am making progress and I should have everything you have made on your branch integrated to the GUI branch soon, at which point I will push everything to main. Regarding the project, I think I align with Sal: keep things as simple as possible. My approach was to divide everything in 3 mostly independent layers: - Store data in an organized file that anyone can use, and make it easy to do - Convert these data into something that has physical significance: a Power Spectrum Density - Extract information from this Power Spectrum Density Each layer has its own challenge but they are independent on the challenge of having people using it: personally, if I had someone come to me with a new software to play with my measures, I would most likely only look at it for 1 minute (or less depending who made it) with a lot of apprehension and then based on how simple it looks and how much I understood of it, use it or - what is most likely - discard it. This is why Project.pdf (https://github.com/bio-brillouin/HDF5_BLS/blob/GUI_development/guides/Projec...) is essentially meant to say: we put data arrays in groups and give them attributes written in text, but you can also create groups within groups to organize your data! I believe most of the people in the BioBrillouin society will have the same approach and before having something complex that can do a lot, I think it’s best to have something simple that can just unify the format (which in itself is a lot) and that people can use right away with a minimal impact on their own individual pipelines for data processing. To be honest, I don’t think people will blindly trust our software at first to treat their data, but they will most likely use it at first to organize their raw spectra, and maybe add their own treated data if they are feeling particularly adventurous. But that is not a problem as long as we start a movement. From there yes, we can complexity and create custom file architectures but that is already too complex I think for this first project. If we can all just import our data to the wrapper and specify their attributes, this will already be a success. Then for the paper, if we can all add a custom code to treat these data to obtain a PSD, I think this will be enough. As I said, the current API already allows you to add your data in a variety of format, so it’s just a question of developing the PSD conversion before having something we can publish (and then tell people to use). A few extra points: - Working with my setup, I realized if the user could choose between different algorithms to treat their own data, it would make the overall project much more usable (if an algorithm bugs for whatever reason, you can use another one) so I created 2 bottle necks in the form of functions (for PSD conversion and treatment) that would inspect modules dedicated to either PSD conversion or treatment, and list existing functions. It’s in between classical and modular programming but it makes the development of new PSD conversion code and treatment way way easier - The GUI is developed using oriented-object programming. Therefore I have already made some low-level choices that kind of impact all the GUI. I’m not saying they are the best choices, I’m just saying that they work, so if you want to work on the GUI, I would either recommend getting familiar with these choices, or making sure that all the functionalities are preserved, particularly the ones that are invisible (logging of treatment steps, treatment errors…) I’ll try merging the branches on Git asap and will definitely send you all an email when it’s done :) Best, Pierre Pierre Bouvet, PhD Post-doctoral Fellow Medical University Vienna Department of Anatomy and Cell Biology Wahringer Straße 13, 1090 Wien, Austria On 14/2/25, at 19:36, Sal La Cavera Iii via Software wrote: Hi all, I agree with the things enumerated and points made by Kareem/Carlo! I guess I would advocate for starting from a position of simplicity. We probably don't want to get weighed down by trying to include a bunch of bells and whistles from the start as these can be easily added once there is a minimally viable stable product. As long as data can be loaded to local memory, then treated in various (initially simple) ways through the GUI (and maybe maintain non-GUI compatibility for command-line warriors like myself), then the bh5 formatting stuff can be sorted on the back end? I definitely agree with Carlo's structure set out in the file format document; but all of that data will be floating around the memory in some shape or form and just needs to be wrapped up and packaged (according to Carlo's structure e.g.) when the user is happy and presses the "generate h5 filestore" etc. (?) Definitely agree with the recommendation to create the alpha using mainly requirements that our 3 labs would find useful (import filetypes, treatments, etc), and then we can add on more universal functionality second / get some beta testers in from other labs etc. I'm able to support on whatever jobs need doing and am free to meet in the beginning of March like you mentioned Kareem. Hope you guys have a nice weekend, Cheers, Sal ---------------------------------------------------------------Salvatore La Cavera IIIRoyal Academy of Engineering Research FellowNottingham Research FellowOptics and Photonics GroupUniversity of Nottingham Email: salvatore.lacaveraiii@nottingham.ac.uk (mailto:salvatore.lacaveraiii@nottingham.ac.uk) ORCID iD: 0000-0003-0210-3102 (https://outlook.office.com/bookwithme/user/6a3f960a8e89429cb6fc693c01d10119@...) Book a Coffee and Research chat with me! ------------------------------------ From: Carlo Bevilacqua via Software Sent: 12 February 2025 13:31 To: Kareem Elsayad Cc: sebastian.hambura@embl.de (mailto:sebastian.hambura@embl.de) ; software@biobrillouin.org (mailto:software@biobrillouin.org) Subject: [Software] Re: Software manuscript / BLS microscopy You don't often get email from software@biobrillouin.org (mailto:software@biobrillouin.org). Learn why this is important (https://aka.ms/LearnAboutSenderIdentification) Hi Kareem, thanks for restarting this and sorry for my silence, I just came back from US and was planning to start working on this again. Could you also add Sebastian (in CC) to the mailing list? As you outlined, I would split the project into two parts: 1) getting from the raw data to some standard "processed' spectra and 2) do data analysis/visualization on that. For the second part the way I envision it is: * the most updated definition of the file format from Pierre is this one (https://github.com/bio-brillouin/HDF5_BLS/blob/GUI_development/guides/Projec...), correct? In addition to this document I think it would be good to have a more structured description of the file (like this (https://github.com/prevedel-lab/Brillouin-standard-file/blob/main/docs/Bh5_f...)), where each field is clearly defined in terms of data type and dimensions. Sebastian was also suggesting that the document should contain the reasoning behind each specific choice in the specs and also things that we considered but decided had some issues (so in future we can look back at it). I still believe that the file format should contain the "processed" spectra (i.e. after FT and baseline subtraction for impulsive, or after taking a line profile and possibly linearization with VIPA,...) so we can apply standard data processing or visualization which is independent on the actual underlaying technique (e.g. VIPA, FP, stimulated, time domain, ...) * agree on an API to read the data from our file format (most likely a Python class). For that we should: 1) decide on which information is important to extract (spectral information, spatial coordinates, hyper-parameters, metadata,...) 2) implement an interface to read the data (e.g. readSpectrumAtIndex(...), readImage(...), ...) * build a GUI that use the previously defined API to show and process the data. I would say that, once we have a very solid description of the file format as in step 1, step 2 will come naturally and we can divide the actual implementation between us. Step 3 can also easily be implemented and divided between us once we have an API (and I am happy to work on the GUI myself). The first half of the project is the trickiest and I know Pierre has already done a lot of work in that direction. We should definitely agree on which extent we can define a standard to store the raw data, given the variability between labs, (and probably we should do it for common techniques like FP or VIPA) and how to implement the treatments, leaving to possibility to load some custom code in the pipeline to do the conversion. Let me know what you all think about this. If you agree I would start by making a document which clearly defines the file format in a structured way (as in my step 1 before). @Pierre could you write a new document or modify the document I originally made (https://github.com/prevedel-lab/Brillouin-standard-file/blob/main/docs/Bh5_f...) to reflect the latest structure you implemented for the file format? The metadata can still be defined in a separated excel sheet, as long as the data type and format is well defined there. Best regards, Carlo On Wed, Feb 12, 2025 at 02:19, Kareem Elsayad via Software wrote: Hi Robert, Carlo, Sal, Pierre, Think it would be good to follow up on software project. Pierre has made some progress here and would be good to try and define tasks a little bit clearer to make progress… There is always the potential issue of having “too many cooks in the kitchen” (that have different recipes for same thing) to move forward efficiently, something that I noticed can get quite confusing/frustrating when writing software together with people. So would be good to clearly assign tasks. I talked to Pierre today and he would be happy to integrate things in framework we have to try tie things together. What would foremost be needed would be ways of treating data, meaning code that takes a raw spectral image and meta-data and converts it into “standard” format (spectral representation) that can then be fitted. Then also “plugins” that serve a specific purpose in the analysis/rendering that can be included in framework. The way I see it (and please comment if you see differently), there are ~4 steps here: * Take raw data (in .tif,, .dat, txt, etc. format) and meta data (in .cvs, xlsx, .dat, .txt, etc.) and render a standard spectral presentation. Also take provided instrument response in one of these formats and extract key parameters from this * Fit the data with drop-down menu list of functions, that will include different functional dependences and functions corrected for instrument response. * Generate/display a visual representation of results (frequency shift(s) and linewidth(s)), that is ideally interactive to some extent (and maybe has some funky features like looking at spectra at different points. These can be spatial maps and/or evolution with some other parameter (time, temperature, angle, etc.). Also be able to display maps of relative peak intensities in case of multiple peak fits, and whatever else useful you can think of. * Extract “mechanical” parameters given assigned refractive indices and densities I think the idea of fitting modified functions (e.g. corrected based on instrument response) vs. deconvolving spectra makes more sense (as can account for more complex corrections due to non-optical anomalies in future –ultimately even functional variations in vicinity of e.g. phase transitions). It is also less error prone, as systematically doing decon with non-ideal registration data can really throw you off the cliff, so to speak. My understanding is that we kind of agreed on initial meta-data reporting format. Getting from 1 to 2 will no doubt be most challenging as it is very instrument specific. So instructions will need to be written for different BLS implementations. This is a huge project if we want it to be all inclusive.. so I would suggest to focus on making it work for just a couple of modalities first would be good (e.g. crossed VIPA, time-resolved, anisotropy, and maybe some time or temperature course of one of these). Extensions should then be more easy to navigate. At one point think would be good to involve SBS specific considerations also. Think would be good to discuss a while per email to gather thoughts and opinions (and already start to share codes), and then plan a meeting beginning of March -- how does first week of March look for everyone? I created this mailing list (software@biobrillouin.org (mailto:software@biobrillouin.org)) we can use for discussion. You should all be able to post to (and it makes it easier if we bring anyone else in along the way). At moment on this mailing list is Robert, Carlo, Sal, Pierre and myself. Let me know if I should add anyone. All the best, Kareem This message and any attachment are intended solely for the addressee and may contain confidential information. If you have received this message in error, please contact the sender and delete the email and attachment. Any views or opinions expressed by the author of this email do not necessarily reflect the views of the University of Nottingham. Email communications with the University of Nottingham may be monitored where permitted by law. _______________________________________________ Software mailing list -- software@biobrillouin.org (mailto:software@biobrillouin.org) To unsubscribe send an email to software-leave@biobrillouin.org (mailto:software-leave@biobrillouin.org)
Hi, Thanks, More than merge them later, just keep them separate in the process and rather than trying to build "one code to do it all", build one library and GUI that encapsulate codes to do everything. Having a structure is a must but it needs to be kept as simple as possible else we’ll rapidly find situations where we need to change the structure. The middle ground I think is to force the use of hierarchies and impose nomenclatures where problem are expected to appear: each dataset has its own group, each group can encapsulate other groups, each parameter of a group applies to all its sub-groups if the subgroup does not change its value, each array of a group applies to all of its sub-groups if the sub-group does not redefine an array with same name, the names of the groups are held as parameters and their ID are managed by the software. For the Plotly interface, I don’t know how to integrate it to Qt but if you find a way to do it, that’s perfect with me :) My vision of the GUI is something that unifies the format and can then execute scripts on the data stored in this format. I have pushed the application of the GUI to my data up to the point where I can do the whole information extraction process from it (add data, convert to PSD, fit curves). I think this could be super interesting if we implement it for all techniques. I think we could formalize the project in milestones, in particular define the minimal denominator that will allow us to have the paper. The milestone I reached for my spectro encompasses the following points: - Being able to add data to the file easily (by dragging & dropping to the GUI) - Being able to assign properties to these data easily (again by dragging & dropping) - Being able to structure the added data in groups/folders/containers/however we want to call it - Making it easy for new data types to be loaded - Allowing data from same type but different structure to be added (e.g. .dat files) - Execute scripts on the data easily and allowing parameters of these scripts to be defined from the GUI (e.g. select a peak on a curve to fit this peak) - Make it easy to add scripts for treating or extracting PSD from raw data. - Allow the export of a Python code to access the data from the file (we cans see them as “break points” in the treatment pipeline) - Edit of properties inside the GUI In any case I think we could build a spec sheet for the project with what we want to have in it based on what we want to advertise in the paper. We can always add things later on but if we agree on a strict minimum to have the project advertised, then that will set its first milestone on which we’ll be able to build later on. Best, Pierre Pierre Bouvet, PhD Post-doctoral Fellow Medical University Vienna Department of Anatomy and Cell Biology Wahringer Straße 13, 1090 Wien, Austria
On 17/2/25, at 14:53, Carlo Bevilacqua via Software <software@biobrillouin.org> wrote:
Hi Pierre, hi Sal, thanks for sharing your thoughts about it. @Pierre I am very sorry that Ren passed away :(
As far as I understood you are suggesting to work on the individual aspects separately and then merge them together at a later stage? I am fine with that but I still think it is very important to now agree on what should be in the file format we are defining, because that is kind of the core of the project and will affect a lot of the design choices.
I am happy to start working on the GUI for data visualization. In my idea, it will be something similar to this <https://www.nature.com/articles/s41592-023-02054-z/figures/10> but written in dash <https://dash.plotly.com/>, so it is a web app that for now can run locally (so no transfer of data to an external server is required) but in the future can easily be uploaded to a website that people can just use without installing anything on their computer. The question is how much of the data processing should be possible to do (or trigger) from the same GUI? I think at least a drop down menu with different fitting functions should be there, so the user can quickly check the results on a spectrum from a specific point in the image. @Pierre how are you envisioning the GUI you are working on? As far as I understood it is mainly to get the raw data and save it to our HDF5 format with some treatment on it. One idea could be to have a shared list of features that we are implementing in the GUI as we work on it, to avoid having the same functionality duplicated (or worst inconsistent) between the GUI for generating our file format and the GUI for visualization.
Let me know what you think about it.
Best, Carlo
On Mon, Feb 17, 2025 at 11:04, Pierre Bouvet via Software <software@biobrillouin.org> wrote: Hi everyone,
Sorry for the delayed response, I just went through the loss of Ren (my dog) and wasn’t at all able to answer. First of, Sal, I am making progress and I should have everything you have made on your branch integrated to the GUI branch soon, at which point I will push everything to main. Regarding the project, I think I align with Sal: keep things as simple as possible. My approach was to divide everything in 3 mostly independent layers: - Store data in an organized file that anyone can use, and make it easy to do - Convert these data into something that has physical significance: a Power Spectrum Density - Extract information from this Power Spectrum Density Each layer has its own challenge but they are independent on the challenge of having people using it: personally, if I had someone come to me with a new software to play with my measures, I would most likely only look at it for 1 minute (or less depending who made it) with a lot of apprehension and then based on how simple it looks and how much I understood of it, use it or - what is most likely - discard it. This is why Project.pdf <https://github.com/bio-brillouin/HDF5_BLS/blob/GUI_development/guides/Projec...> is essentially meant to say: we put data arrays in groups and give them attributes written in text, but you can also create groups within groups to organize your data! I believe most of the people in the BioBrillouin society will have the same approach and before having something complex that can do a lot, I think it’s best to have something simple that can just unify the format (which in itself is a lot) and that people can use right away with a minimal impact on their own individual pipelines for data processing. To be honest, I don’t think people will blindly trust our software at first to treat their data, but they will most likely use it at first to organize their raw spectra, and maybe add their own treated data if they are feeling particularly adventurous. But that is not a problem as long as we start a movement. From there yes, we can complexity and create custom file architectures but that is already too complex I think for this first project. If we can all just import our data to the wrapper and specify their attributes, this will already be a success. Then for the paper, if we can all add a custom code to treat these data to obtain a PSD, I think this will be enough. As I said, the current API already allows you to add your data in a variety of format, so it’s just a question of developing the PSD conversion before having something we can publish (and then tell people to use).
A few extra points: - Working with my setup, I realized if the user could choose between different algorithms to treat their own data, it would make the overall project much more usable (if an algorithm bugs for whatever reason, you can use another one) so I created 2 bottle necks in the form of functions (for PSD conversion and treatment) that would inspect modules dedicated to either PSD conversion or treatment, and list existing functions. It’s in between classical and modular programming but it makes the development of new PSD conversion code and treatment way way easier - The GUI is developed using oriented-object programming. Therefore I have already made some low-level choices that kind of impact all the GUI. I’m not saying they are the best choices, I’m just saying that they work, so if you want to work on the GUI, I would either recommend getting familiar with these choices, or making sure that all the functionalities are preserved, particularly the ones that are invisible (logging of treatment steps, treatment errors…)
I’ll try merging the branches on Git asap and will definitely send you all an email when it’s done :)
Best,
Pierre
Pierre Bouvet, PhD Post-doctoral Fellow Medical University Vienna Department of Anatomy and Cell Biology Wahringer Straße 13, 1090 Wien, Austria
On 14/2/25, at 19:36, Sal La Cavera Iii via Software <software@biobrillouin.org <mailto:software@biobrillouin.org>> wrote:
Hi all,
I agree with the things enumerated and points made by Kareem/Carlo! I guess I would advocate for starting from a position of simplicity. We probably don't want to get weighed down by trying to include a bunch of bells and whistles from the start as these can be easily added once there is a minimally viable stable product.
As long as data can be loaded to local memory, then treated in various (initially simple) ways through the GUI (and maybe maintain non-GUI compatibility for command-line warriors like myself), then the bh5 formatting stuff can be sorted on the back end? I definitely agree with Carlo's structure set out in the file format document; but all of that data will be floating around the memory in some shape or form and just needs to be wrapped up and packaged (according to Carlo's structure e.g.) when the user is happy and presses the "generate h5 filestore" etc. (?)
Definitely agree with the recommendation to create the alpha using mainly requirements that our 3 labs would find useful (import filetypes, treatments, etc), and then we can add on more universal functionality second / get some beta testers in from other labs etc.
I'm able to support on whatever jobs need doing and am free to meet in the beginning of March like you mentioned Kareem.
Hope you guys have a nice weekend,
Cheers,
Sal
--------------------------------------------------------------- Salvatore La Cavera III Royal Academy of Engineering Research Fellow Nottingham Research Fellow Optics and Photonics Group University of Nottingham Email: salvatore.lacaveraiii@nottingham.ac.uk <mailto:salvatore.lacaveraiii@nottingham.ac.uk> ORCID iD: 0000-0003-0210-3102 <Outlook-tygjxucs.png> <https://outlook.office.com/bookwithme/user/6a3f960a8e89429cb6fc693c01d10119@...> Book a Coffee and Research chat with me! From: Carlo Bevilacqua via Software <software@biobrillouin.org <mailto:software@biobrillouin.org>> Sent: 12 February 2025 13:31 To: Kareem Elsayad <kareem.elsayad@meduniwien.ac.at <mailto:kareem.elsayad@meduniwien.ac.at>> Cc: sebastian.hambura@embl.de <mailto:sebastian.hambura@embl.de> <sebastian.hambura@embl.de <mailto:sebastian.hambura@embl.de>>; software@biobrillouin.org <mailto:software@biobrillouin.org> <software@biobrillouin.org <mailto:software@biobrillouin.org>> Subject: [Software] Re: Software manuscript / BLS microscopy
You don't often get email from software@biobrillouin.org <mailto:software@biobrillouin.org>. Learn why this is important <https://aka.ms/LearnAboutSenderIdentification> Hi Kareem, thanks for restarting this and sorry for my silence, I just came back from US and was planning to start working on this again. Could you also add Sebastian (in CC) to the mailing list?
As you outlined, I would split the project into two parts: 1) getting from the raw data to some standard "processed' spectra and 2) do data analysis/visualization on that. For the second part the way I envision it is: the most updated definition of the file format from Pierre is this one <https://github.com/bio-brillouin/HDF5_BLS/blob/GUI_development/guides/Projec...>, correct? In addition to this document I think it would be good to have a more structured description of the file (like this <https://github.com/prevedel-lab/Brillouin-standard-file/blob/main/docs/Bh5_f...>), where each field is clearly defined in terms of data type and dimensions. Sebastian was also suggesting that the document should contain the reasoning behind each specific choice in the specs and also things that we considered but decided had some issues (so in future we can look back at it). I still believe that the file format should contain the "processed" spectra (i.e. after FT and baseline subtraction for impulsive, or after taking a line profile and possibly linearization with VIPA,...) so we can apply standard data processing or visualization which is independent on the actual underlaying technique (e.g. VIPA, FP, stimulated, time domain, ...) agree on an API to read the data from our file format (most likely a Python class). For that we should: 1) decide on which information is important to extract (spectral information, spatial coordinates, hyper-parameters, metadata,...) 2) implement an interface to read the data (e.g. readSpectrumAtIndex(...), readImage(...), ...) build a GUI that use the previously defined API to show and process the data. I would say that, once we have a very solid description of the file format as in step 1, step 2 will come naturally and we can divide the actual implementation between us. Step 3 can also easily be implemented and divided between us once we have an API (and I am happy to work on the GUI myself).
The first half of the project is the trickiest and I know Pierre has already done a lot of work in that direction. We should definitely agree on which extent we can define a standard to store the raw data, given the variability between labs, (and probably we should do it for common techniques like FP or VIPA) and how to implement the treatments, leaving to possibility to load some custom code in the pipeline to do the conversion.
Let me know what you all think about this. If you agree I would start by making a document which clearly defines the file format in a structured way (as in my step 1 before). @Pierre could you write a new document or modify the document I originally made <https://github.com/prevedel-lab/Brillouin-standard-file/blob/main/docs/Bh5_f...> to reflect the latest structure you implemented for the file format? The metadata can still be defined in a separated excel sheet, as long as the data type and format is well defined there.
Best regards, Carlo
On Wed, Feb 12, 2025 at 02:19, Kareem Elsayad via Software <software@biobrillouin.org <mailto:software@biobrillouin.org>> wrote: Hi Robert, Carlo, Sal, Pierre,
Think it would be good to follow up on software project. Pierre has made some progress here and would be good to try and define tasks a little bit clearer to make progress…
There is always the potential issue of having “too many cooks in the kitchen” (that have different recipes for same thing) to move forward efficiently, something that I noticed can get quite confusing/frustrating when writing software together with people. So would be good to clearly assign tasks. I talked to Pierre today and he would be happy to integrate things in framework we have to try tie things together. What would foremost be needed would be ways of treating data, meaning code that takes a raw spectral image and meta-data and converts it into “standard” format (spectral representation) that can then be fitted. Then also “plugins” that serve a specific purpose in the analysis/rendering that can be included in framework.
The way I see it (and please comment if you see differently), there are ~4 steps here:
Take raw data (in .tif,, .dat, txt, etc. format) and meta data (in .cvs, xlsx, .dat, .txt, etc.) and render a standard spectral presentation. Also take provided instrument response in one of these formats and extract key parameters from this Fit the data with drop-down menu list of functions, that will include different functional dependences and functions corrected for instrument response. Generate/display a visual representation of results (frequency shift(s) and linewidth(s)), that is ideally interactive to some extent (and maybe has some funky features like looking at spectra at different points. These can be spatial maps and/or evolution with some other parameter (time, temperature, angle, etc.). Also be able to display maps of relative peak intensities in case of multiple peak fits, and whatever else useful you can think of. Extract “mechanical” parameters given assigned refractive indices and densities
I think the idea of fitting modified functions (e.g. corrected based on instrument response) vs. deconvolving spectra makes more sense (as can account for more complex corrections due to non-optical anomalies in future –ultimately even functional variations in vicinity of e.g. phase transitions). It is also less error prone, as systematically doing decon with non-ideal registration data can really throw you off the cliff, so to speak.
My understanding is that we kind of agreed on initial meta-data reporting format. Getting from 1 to 2 will no doubt be most challenging as it is very instrument specific. So instructions will need to be written for different BLS implementations.
This is a huge project if we want it to be all inclusive.. so I would suggest to focus on making it work for just a couple of modalities first would be good (e.g. crossed VIPA, time-resolved, anisotropy, and maybe some time or temperature course of one of these). Extensions should then be more easy to navigate. At one point think would be good to involve SBS specific considerations also.
Think would be good to discuss a while per email to gather thoughts and opinions (and already start to share codes), and then plan a meeting beginning of March -- how does first week of March look for everyone?
I created this mailing list (software@biobrillouin.org <mailto:software@biobrillouin.org>) we can use for discussion. You should all be able to post to (and it makes it easier if we bring anyone else in along the way).
At moment on this mailing list is Robert, Carlo, Sal, Pierre and myself. Let me know if I should add anyone.
All the best,
Kareem
This message and any attachment are intended solely for the addressee and may contain confidential information. If you have received this message in error, please contact the sender and delete the email and attachment. Any views or opinions expressed by the author of this email do not necessarily reflect the views of the University of Nottingham. Email communications with the University of Nottingham may be monitored where permitted by law. _______________________________________________ Software mailing list -- software@biobrillouin.org <mailto:software@biobrillouin.org> To unsubscribe send an email to software-leave@biobrillouin.org <mailto:software-leave@biobrillouin.org>
Software mailing list -- software@biobrillouin.org To unsubscribe send an email to software-leave@biobrillouin.org
Hi Pierre, regarding the structure of the file, I agree that we should keep it simple. I am not suggesting to make it more complex, rather to have a document where we define it in a clear and structured way rather than as a general description, to make sure that we are all on the same page. I am saying this because, to be honest, I am not sure I fully understand how you are structuring the HDF5 and I think it is important to agree on this now, rather than finding at a later stage that we had different ideas. Ideally if the GUI should be part of a single application, we should write it using a unified framework. The reasons why, after considering it for a bit, I lean towards Dash rather than Qt are: * it can run in a web browser so it will be easy to eventually move it to a website, thus people can use it without installing it (which will hopefully help in promoting its use) * it is based on plotly (https://plotly.com/python/) which is a graphical library with very good plotting capabilites and highly customizable, that would make the data visualization easier/more appealing Let me know what you think about it and if you see any advantage of Qt over a web app which I am not considering. Also, if we agree that Dash might be a better option, would you consider migrating to Dash? It might not be too much work if most of the code you wrote is for data processing rather that for the GUI itself and I could help you with that. Alternatively one workaround is to have a QtWebEngine (https://doc.qt.io/qtforpython-6/overviews/qtwebengine-overview.html) in your Qt app and have the Dash app run inside that, but that would make only the Dash part portable to a server later on. Best, Carlo On Tue, Feb 18, 2025 at 10:24, Pierre Bouvet wrote: Hi, Thanks, More than merge them later, just keep them separate in the process and rather than trying to build "one code to do it all", build one library and GUI that encapsulate codes to do everything. Having a structure is a must but it needs to be kept as simple as possible else we’ll rapidly find situations where we need to change the structure. The middle ground I think is to force the use of hierarchies and impose nomenclatures where problem are expected to appear: each dataset has its own group, each group can encapsulate other groups, each parameter of a group applies to all its sub-groups if the subgroup does not change its value, each array of a group applies to all of its sub-groups if the sub-group does not redefine an array with same name, the names of the groups are held as parameters and their ID are managed by the software. For the Plotly interface, I don’t know how to integrate it to Qt but if you find a way to do it, that’s perfect with me :) My vision of the GUI is something that unifies the format and can then execute scripts on the data stored in this format. I have pushed the application of the GUI to my data up to the point where I can do the whole information extraction process from it (add data, convert to PSD, fit curves). I think this could be super interesting if we implement it for all techniques. I think we could formalize the project in milestones, in particular define the minimal denominator that will allow us to have the paper. The milestone I reached for my spectro encompasses the following points: - Being able to add data to the file easily (by dragging & dropping to the GUI) - Being able to assign properties to these data easily (again by dragging & dropping) - Being able to structure the added data in groups/folders/containers/however we want to call it - Making it easy for new data types to be loaded - Allowing data from same type but different structure to be added (e.g. .dat files) - Execute scripts on the data easily and allowing parameters of these scripts to be defined from the GUI (e.g. select a peak on a curve to fit this peak) - Make it easy to add scripts for treating or extracting PSD from raw data. - Allow the export of a Python code to access the data from the file (we cans see them as “break points” in the treatment pipeline) - Edit of properties inside the GUI In any case I think we could build a spec sheet for the project with what we want to have in it based on what we want to advertise in the paper. We can always add things later on but if we agree on a strict minimum to have the project advertised, then that will set its first milestone on which we’ll be able to build later on. Best, Pierre Pierre Bouvet, PhD Post-doctoral Fellow Medical University Vienna Department of Anatomy and Cell Biology Wahringer Straße 13, 1090 Wien, Austria On 17/2/25, at 14:53, Carlo Bevilacqua via Software wrote: Hi Pierre, hi Sal, thanks for sharing your thoughts about it. @Pierre I am very sorry that Ren passed away :( As far as I understood you are suggesting to work on the individual aspects separately and then merge them together at a later stage? I am fine with that but I still think it is very important to now agree on what should be in the file format we are defining, because that is kind of the core of the project and will affect a lot of the design choices. I am happy to start working on the GUI for data visualization. In my idea, it will be something similar to this (https://www.nature.com/articles/s41592-023-02054-z/figures/10) but written in dash (https://dash.plotly.com/), so it is a web app that for now can run locally (so no transfer of data to an external server is required) but in the future can easily be uploaded to a website that people can just use without installing anything on their computer. The question is how much of the data processing should be possible to do (or trigger) from the same GUI? I think at least a drop down menu with different fitting functions should be there, so the user can quickly check the results on a spectrum from a specific point in the image. @Pierre how are you envisioning the GUI you are working on? As far as I understood it is mainly to get the raw data and save it to our HDF5 format with some treatment on it. One idea could be to have a shared list of features that we are implementing in the GUI as we work on it, to avoid having the same functionality duplicated (or worst inconsistent) between the GUI for generating our file format and the GUI for visualization. Let me know what you think about it. Best, Carlo On Mon, Feb 17, 2025 at 11:04, Pierre Bouvet via Software wrote: Hi everyone, Sorry for the delayed response, I just went through the loss of Ren (my dog) and wasn’t at all able to answer. First of, Sal, I am making progress and I should have everything you have made on your branch integrated to the GUI branch soon, at which point I will push everything to main. Regarding the project, I think I align with Sal: keep things as simple as possible. My approach was to divide everything in 3 mostly independent layers: - Store data in an organized file that anyone can use, and make it easy to do - Convert these data into something that has physical significance: a Power Spectrum Density - Extract information from this Power Spectrum Density Each layer has its own challenge but they are independent on the challenge of having people using it: personally, if I had someone come to me with a new software to play with my measures, I would most likely only look at it for 1 minute (or less depending who made it) with a lot of apprehension and then based on how simple it looks and how much I understood of it, use it or - what is most likely - discard it. This is why Project.pdf (https://github.com/bio-brillouin/HDF5_BLS/blob/GUI_development/guides/Projec...) is essentially meant to say: we put data arrays in groups and give them attributes written in text, but you can also create groups within groups to organize your data! I believe most of the people in the BioBrillouin society will have the same approach and before having something complex that can do a lot, I think it’s best to have something simple that can just unify the format (which in itself is a lot) and that people can use right away with a minimal impact on their own individual pipelines for data processing. To be honest, I don’t think people will blindly trust our software at first to treat their data, but they will most likely use it at first to organize their raw spectra, and maybe add their own treated data if they are feeling particularly adventurous. But that is not a problem as long as we start a movement. From there yes, we can complexity and create custom file architectures but that is already too complex I think for this first project. If we can all just import our data to the wrapper and specify their attributes, this will already be a success. Then for the paper, if we can all add a custom code to treat these data to obtain a PSD, I think this will be enough. As I said, the current API already allows you to add your data in a variety of format, so it’s just a question of developing the PSD conversion before having something we can publish (and then tell people to use). A few extra points: - Working with my setup, I realized if the user could choose between different algorithms to treat their own data, it would make the overall project much more usable (if an algorithm bugs for whatever reason, you can use another one) so I created 2 bottle necks in the form of functions (for PSD conversion and treatment) that would inspect modules dedicated to either PSD conversion or treatment, and list existing functions. It’s in between classical and modular programming but it makes the development of new PSD conversion code and treatment way way easier - The GUI is developed using oriented-object programming. Therefore I have already made some low-level choices that kind of impact all the GUI. I’m not saying they are the best choices, I’m just saying that they work, so if you want to work on the GUI, I would either recommend getting familiar with these choices, or making sure that all the functionalities are preserved, particularly the ones that are invisible (logging of treatment steps, treatment errors…) I’ll try merging the branches on Git asap and will definitely send you all an email when it’s done :) Best, Pierre Pierre Bouvet, PhD Post-doctoral Fellow Medical University Vienna Department of Anatomy and Cell Biology Wahringer Straße 13, 1090 Wien, Austria On 14/2/25, at 19:36, Sal La Cavera Iii via Software wrote: Hi all, I agree with the things enumerated and points made by Kareem/Carlo! I guess I would advocate for starting from a position of simplicity. We probably don't want to get weighed down by trying to include a bunch of bells and whistles from the start as these can be easily added once there is a minimally viable stable product. As long as data can be loaded to local memory, then treated in various (initially simple) ways through the GUI (and maybe maintain non-GUI compatibility for command-line warriors like myself), then the bh5 formatting stuff can be sorted on the back end? I definitely agree with Carlo's structure set out in the file format document; but all of that data will be floating around the memory in some shape or form and just needs to be wrapped up and packaged (according to Carlo's structure e.g.) when the user is happy and presses the "generate h5 filestore" etc. (?) Definitely agree with the recommendation to create the alpha using mainly requirements that our 3 labs would find useful (import filetypes, treatments, etc), and then we can add on more universal functionality second / get some beta testers in from other labs etc. I'm able to support on whatever jobs need doing and am free to meet in the beginning of March like you mentioned Kareem. Hope you guys have a nice weekend, Cheers, Sal ---------------------------------------------------------------Salvatore La Cavera IIIRoyal Academy of Engineering Research FellowNottingham Research FellowOptics and Photonics GroupUniversity of Nottingham Email: salvatore.lacaveraiii@nottingham.ac.uk (mailto:salvatore.lacaveraiii@nottingham.ac.uk) ORCID iD: 0000-0003-0210-3102 (https://outlook.office.com/bookwithme/user/6a3f960a8e89429cb6fc693c01d10119@...) Book a Coffee and Research chat with me! ------------------------------------ From: Carlo Bevilacqua via Software Sent: 12 February 2025 13:31 To: Kareem Elsayad Cc: sebastian.hambura@embl.de (mailto:sebastian.hambura@embl.de) ; software@biobrillouin.org (mailto:software@biobrillouin.org) Subject: [Software] Re: Software manuscript / BLS microscopy You don't often get email from software@biobrillouin.org (mailto:software@biobrillouin.org). Learn why this is important (https://aka.ms/LearnAboutSenderIdentification) Hi Kareem, thanks for restarting this and sorry for my silence, I just came back from US and was planning to start working on this again. Could you also add Sebastian (in CC) to the mailing list? As you outlined, I would split the project into two parts: 1) getting from the raw data to some standard "processed' spectra and 2) do data analysis/visualization on that. For the second part the way I envision it is: * the most updated definition of the file format from Pierre is this one (https://github.com/bio-brillouin/HDF5_BLS/blob/GUI_development/guides/Projec...), correct? In addition to this document I think it would be good to have a more structured description of the file (like this (https://github.com/prevedel-lab/Brillouin-standard-file/blob/main/docs/Bh5_f...)), where each field is clearly defined in terms of data type and dimensions. Sebastian was also suggesting that the document should contain the reasoning behind each specific choice in the specs and also things that we considered but decided had some issues (so in future we can look back at it). I still believe that the file format should contain the "processed" spectra (i.e. after FT and baseline subtraction for impulsive, or after taking a line profile and possibly linearization with VIPA,...) so we can apply standard data processing or visualization which is independent on the actual underlaying technique (e.g. VIPA, FP, stimulated, time domain, ...) * agree on an API to read the data from our file format (most likely a Python class). For that we should: 1) decide on which information is important to extract (spectral information, spatial coordinates, hyper-parameters, metadata,...) 2) implement an interface to read the data (e.g. readSpectrumAtIndex(...), readImage(...), ...) * build a GUI that use the previously defined API to show and process the data. I would say that, once we have a very solid description of the file format as in step 1, step 2 will come naturally and we can divide the actual implementation between us. Step 3 can also easily be implemented and divided between us once we have an API (and I am happy to work on the GUI myself). The first half of the project is the trickiest and I know Pierre has already done a lot of work in that direction. We should definitely agree on which extent we can define a standard to store the raw data, given the variability between labs, (and probably we should do it for common techniques like FP or VIPA) and how to implement the treatments, leaving to possibility to load some custom code in the pipeline to do the conversion. Let me know what you all think about this. If you agree I would start by making a document which clearly defines the file format in a structured way (as in my step 1 before). @Pierre could you write a new document or modify the document I originally made (https://github.com/prevedel-lab/Brillouin-standard-file/blob/main/docs/Bh5_f...) to reflect the latest structure you implemented for the file format? The metadata can still be defined in a separated excel sheet, as long as the data type and format is well defined there. Best regards, Carlo On Wed, Feb 12, 2025 at 02:19, Kareem Elsayad via Software wrote: Hi Robert, Carlo, Sal, Pierre, Think it would be good to follow up on software project. Pierre has made some progress here and would be good to try and define tasks a little bit clearer to make progress… There is always the potential issue of having “too many cooks in the kitchen” (that have different recipes for same thing) to move forward efficiently, something that I noticed can get quite confusing/frustrating when writing software together with people. So would be good to clearly assign tasks. I talked to Pierre today and he would be happy to integrate things in framework we have to try tie things together. What would foremost be needed would be ways of treating data, meaning code that takes a raw spectral image and meta-data and converts it into “standard” format (spectral representation) that can then be fitted. Then also “plugins” that serve a specific purpose in the analysis/rendering that can be included in framework. The way I see it (and please comment if you see differently), there are ~4 steps here: * Take raw data (in .tif,, .dat, txt, etc. format) and meta data (in .cvs, xlsx, .dat, .txt, etc.) and render a standard spectral presentation. Also take provided instrument response in one of these formats and extract key parameters from this * Fit the data with drop-down menu list of functions, that will include different functional dependences and functions corrected for instrument response. * Generate/display a visual representation of results (frequency shift(s) and linewidth(s)), that is ideally interactive to some extent (and maybe has some funky features like looking at spectra at different points. These can be spatial maps and/or evolution with some other parameter (time, temperature, angle, etc.). Also be able to display maps of relative peak intensities in case of multiple peak fits, and whatever else useful you can think of. * Extract “mechanical” parameters given assigned refractive indices and densities I think the idea of fitting modified functions (e.g. corrected based on instrument response) vs. deconvolving spectra makes more sense (as can account for more complex corrections due to non-optical anomalies in future –ultimately even functional variations in vicinity of e.g. phase transitions). It is also less error prone, as systematically doing decon with non-ideal registration data can really throw you off the cliff, so to speak. My understanding is that we kind of agreed on initial meta-data reporting format. Getting from 1 to 2 will no doubt be most challenging as it is very instrument specific. So instructions will need to be written for different BLS implementations. This is a huge project if we want it to be all inclusive.. so I would suggest to focus on making it work for just a couple of modalities first would be good (e.g. crossed VIPA, time-resolved, anisotropy, and maybe some time or temperature course of one of these). Extensions should then be more easy to navigate. At one point think would be good to involve SBS specific considerations also. Think would be good to discuss a while per email to gather thoughts and opinions (and already start to share codes), and then plan a meeting beginning of March -- how does first week of March look for everyone? I created this mailing list (software@biobrillouin.org (mailto:software@biobrillouin.org)) we can use for discussion. You should all be able to post to (and it makes it easier if we bring anyone else in along the way). At moment on this mailing list is Robert, Carlo, Sal, Pierre and myself. Let me know if I should add anyone. All the best, Kareem This message and any attachment are intended solely for the addressee and may contain confidential information. If you have received this message in error, please contact the sender and delete the email and attachment. Any views or opinions expressed by the author of this email do not necessarily reflect the views of the University of Nottingham. Email communications with the University of Nottingham may be monitored where permitted by law. _______________________________________________ Software mailing list -- software@biobrillouin.org (mailto:software@biobrillouin.org) To unsubscribe send an email to software-leave@biobrillouin.org (mailto:software-leave@biobrillouin.org) _______________________________________________ Software mailing list -- software@biobrillouin.org (mailto:software@biobrillouin.org) To unsubscribe send an email to software-leave@biobrillouin.org (mailto:software-leave@biobrillouin.org)
Hi Carlo, You’re right, the format is still a little fuzzy. The main idea is to have a data-based hierarchy for storage: each data is stored in an individual group. From there, abscissa dependent on the data are stored in the same group and the treated data are stored in sub-groups. The names of the groups and sub-groups are fixed (Data_i), as is the name of the raw data (Raw_data) and abscissa (Abscissa_i). Also, the measure and spectrometer-dependent arguments have a defined nomenclature. To differentiate groups between them, we preferably attribute them a name as an attribute that is not used as an identifier, the identifier being either the path to the data/group from file root (Data_0/Data_42/Data_2/Raw_data) or potentially a hash value (not implemented). This I think allows all possible configurations, and using an hierarchical approach we can also pass common attributes and arrays (parameters of the spectrometer or abscissa arrays for example) on parent to reduce memory complexity. Now regarding the use of server-based GUI, first off, I’ve never used them so I’m just making supposition here but if the platform is able to treat data online, it will have to store the spectra somewhere in memory and it will not be local. My primary concerns with this approach is safety, particularly in terms of intellectual property protection, ethical considerations, and potential security vulnerabilities. Additionally, managing storage space will be a headache. Now, this doesn’t mean that we can’t have a server-based data plotter, or a server-based interface that does treatments locally but I don’t really see the benefits of this over a local software that can have multiple windows, which could at one point be multithreaded, and that could wrap c code to speed regressions for example (some of this might apply to Dash, I’m not super familiar with it). Now regarding memory complexity, having all the data we treat go on a server is a bad idea as it will raise the question of cost which will very rapidly become a real problem. Just an example: for a 100x100 map, I need 10Gb of memory (1Mo/point) with my setup (1To of archive storage is approximately 1euro/month) so this would get out of hands super fast assuming people use it. Now maybe there are solutions I don’t see for these problems and someone can take care of them but for me it’s just not worth the effort when having a local GUI solves all of these issues at once. But if you find a solution, then I’ll be happy to migrate to Dash, it won’t be fast to translate every feature but I can totally join you on the platform. Best, Pierre Pierre Bouvet, PhD Post-doctoral Fellow Medical University Vienna Department of Anatomy and Cell Biology Wahringer Straße 13, 1090 Wien, Austria
On 18/2/25, at 20:26, Carlo Bevilacqua <carlo.bevilacqua@embl.de> wrote:
Hi Pierre,
regarding the structure of the file, I agree that we should keep it simple. I am not suggesting to make it more complex, rather to have a document where we define it in a clear and structured way rather than as a general description, to make sure that we are all on the same page. I am saying this because, to be honest, I am not sure I fully understand how you are structuring the HDF5 and I think it is important to agree on this now, rather than finding at a later stage that we had different ideas.
Ideally if the GUI should be part of a single application, we should write it using a unified framework. The reasons why, after considering it for a bit, I lean towards Dash rather than Qt are: it can run in a web browser so it will be easy to eventually move it to a website, thus people can use it without installing it (which will hopefully help in promoting its use) it is based on plotly <https://plotly.com/python/> which is a graphical library with very good plotting capabilites and highly customizable, that would make the data visualization easier/more appealing Let me know what you think about it and if you see any advantage of Qt over a web app which I am not considering. Also, if we agree that Dash might be a better option, would you consider migrating to Dash? It might not be too much work if most of the code you wrote is for data processing rather that for the GUI itself and I could help you with that. Alternatively one workaround is to have a QtWebEngine <https://doc.qt.io/qtforpython-6/overviews/qtwebengine-overview.html> in your Qt app and have the Dash app run inside that, but that would make only the Dash part portable to a server later on.
Best, Carlo
On Tue, Feb 18, 2025 at 10:24, Pierre Bouvet <pierre.bouvet@meduniwien.ac.at> wrote: Hi,
Thanks,
More than merge them later, just keep them separate in the process and rather than trying to build "one code to do it all", build one library and GUI that encapsulate codes to do everything. Having a structure is a must but it needs to be kept as simple as possible else we’ll rapidly find situations where we need to change the structure. The middle ground I think is to force the use of hierarchies and impose nomenclatures where problem are expected to appear: each dataset has its own group, each group can encapsulate other groups, each parameter of a group applies to all its sub-groups if the subgroup does not change its value, each array of a group applies to all of its sub-groups if the sub-group does not redefine an array with same name, the names of the groups are held as parameters and their ID are managed by the software. For the Plotly interface, I don’t know how to integrate it to Qt but if you find a way to do it, that’s perfect with me :) My vision of the GUI is something that unifies the format and can then execute scripts on the data stored in this format. I have pushed the application of the GUI to my data up to the point where I can do the whole information extraction process from it (add data, convert to PSD, fit curves). I think this could be super interesting if we implement it for all techniques. I think we could formalize the project in milestones, in particular define the minimal denominator that will allow us to have the paper. The milestone I reached for my spectro encompasses the following points: - Being able to add data to the file easily (by dragging & dropping to the GUI) - Being able to assign properties to these data easily (again by dragging & dropping) - Being able to structure the added data in groups/folders/containers/however we want to call it - Making it easy for new data types to be loaded - Allowing data from same type but different structure to be added (e.g. .dat files) - Execute scripts on the data easily and allowing parameters of these scripts to be defined from the GUI (e.g. select a peak on a curve to fit this peak) - Make it easy to add scripts for treating or extracting PSD from raw data. - Allow the export of a Python code to access the data from the file (we cans see them as “break points” in the treatment pipeline) - Edit of properties inside the GUI In any case I think we could build a spec sheet for the project with what we want to have in it based on what we want to advertise in the paper. We can always add things later on but if we agree on a strict minimum to have the project advertised, then that will set its first milestone on which we’ll be able to build later on.
Best,
Pierre
Pierre Bouvet, PhD Post-doctoral Fellow Medical University Vienna Department of Anatomy and Cell Biology Wahringer Straße 13, 1090 Wien, Austria
On 17/2/25, at 14:53, Carlo Bevilacqua via Software <software@biobrillouin.org <mailto:software@biobrillouin.org>> wrote:
Hi Pierre, hi Sal, thanks for sharing your thoughts about it. @Pierre I am very sorry that Ren passed away :(
As far as I understood you are suggesting to work on the individual aspects separately and then merge them together at a later stage? I am fine with that but I still think it is very important to now agree on what should be in the file format we are defining, because that is kind of the core of the project and will affect a lot of the design choices.
I am happy to start working on the GUI for data visualization. In my idea, it will be something similar to this <https://www.nature.com/articles/s41592-023-02054-z/figures/10> but written in dash <https://dash.plotly.com/>, so it is a web app that for now can run locally (so no transfer of data to an external server is required) but in the future can easily be uploaded to a website that people can just use without installing anything on their computer. The question is how much of the data processing should be possible to do (or trigger) from the same GUI? I think at least a drop down menu with different fitting functions should be there, so the user can quickly check the results on a spectrum from a specific point in the image. @Pierre how are you envisioning the GUI you are working on? As far as I understood it is mainly to get the raw data and save it to our HDF5 format with some treatment on it. One idea could be to have a shared list of features that we are implementing in the GUI as we work on it, to avoid having the same functionality duplicated (or worst inconsistent) between the GUI for generating our file format and the GUI for visualization.
Let me know what you think about it.
Best, Carlo
On Mon, Feb 17, 2025 at 11:04, Pierre Bouvet via Software <software@biobrillouin.org <mailto:software@biobrillouin.org>> wrote: Hi everyone,
Sorry for the delayed response, I just went through the loss of Ren (my dog) and wasn’t at all able to answer. First of, Sal, I am making progress and I should have everything you have made on your branch integrated to the GUI branch soon, at which point I will push everything to main. Regarding the project, I think I align with Sal: keep things as simple as possible. My approach was to divide everything in 3 mostly independent layers: - Store data in an organized file that anyone can use, and make it easy to do - Convert these data into something that has physical significance: a Power Spectrum Density - Extract information from this Power Spectrum Density Each layer has its own challenge but they are independent on the challenge of having people using it: personally, if I had someone come to me with a new software to play with my measures, I would most likely only look at it for 1 minute (or less depending who made it) with a lot of apprehension and then based on how simple it looks and how much I understood of it, use it or - what is most likely - discard it. This is why Project.pdf <https://github.com/bio-brillouin/HDF5_BLS/blob/GUI_development/guides/Projec...> is essentially meant to say: we put data arrays in groups and give them attributes written in text, but you can also create groups within groups to organize your data! I believe most of the people in the BioBrillouin society will have the same approach and before having something complex that can do a lot, I think it’s best to have something simple that can just unify the format (which in itself is a lot) and that people can use right away with a minimal impact on their own individual pipelines for data processing. To be honest, I don’t think people will blindly trust our software at first to treat their data, but they will most likely use it at first to organize their raw spectra, and maybe add their own treated data if they are feeling particularly adventurous. But that is not a problem as long as we start a movement. From there yes, we can complexity and create custom file architectures but that is already too complex I think for this first project. If we can all just import our data to the wrapper and specify their attributes, this will already be a success. Then for the paper, if we can all add a custom code to treat these data to obtain a PSD, I think this will be enough. As I said, the current API already allows you to add your data in a variety of format, so it’s just a question of developing the PSD conversion before having something we can publish (and then tell people to use).
A few extra points: - Working with my setup, I realized if the user could choose between different algorithms to treat their own data, it would make the overall project much more usable (if an algorithm bugs for whatever reason, you can use another one) so I created 2 bottle necks in the form of functions (for PSD conversion and treatment) that would inspect modules dedicated to either PSD conversion or treatment, and list existing functions. It’s in between classical and modular programming but it makes the development of new PSD conversion code and treatment way way easier - The GUI is developed using oriented-object programming. Therefore I have already made some low-level choices that kind of impact all the GUI. I’m not saying they are the best choices, I’m just saying that they work, so if you want to work on the GUI, I would either recommend getting familiar with these choices, or making sure that all the functionalities are preserved, particularly the ones that are invisible (logging of treatment steps, treatment errors…)
I’ll try merging the branches on Git asap and will definitely send you all an email when it’s done :)
Best,
Pierre
Pierre Bouvet, PhD Post-doctoral Fellow Medical University Vienna Department of Anatomy and Cell Biology Wahringer Straße 13, 1090 Wien, Austria
On 14/2/25, at 19:36, Sal La Cavera Iii via Software <software@biobrillouin.org <mailto:software@biobrillouin.org>> wrote:
Hi all,
I agree with the things enumerated and points made by Kareem/Carlo! I guess I would advocate for starting from a position of simplicity. We probably don't want to get weighed down by trying to include a bunch of bells and whistles from the start as these can be easily added once there is a minimally viable stable product.
As long as data can be loaded to local memory, then treated in various (initially simple) ways through the GUI (and maybe maintain non-GUI compatibility for command-line warriors like myself), then the bh5 formatting stuff can be sorted on the back end? I definitely agree with Carlo's structure set out in the file format document; but all of that data will be floating around the memory in some shape or form and just needs to be wrapped up and packaged (according to Carlo's structure e.g.) when the user is happy and presses the "generate h5 filestore" etc. (?)
Definitely agree with the recommendation to create the alpha using mainly requirements that our 3 labs would find useful (import filetypes, treatments, etc), and then we can add on more universal functionality second / get some beta testers in from other labs etc.
I'm able to support on whatever jobs need doing and am free to meet in the beginning of March like you mentioned Kareem.
Hope you guys have a nice weekend,
Cheers,
Sal
--------------------------------------------------------------- Salvatore La Cavera III Royal Academy of Engineering Research Fellow Nottingham Research Fellow Optics and Photonics Group University of Nottingham Email: salvatore.lacaveraiii@nottingham.ac.uk <mailto:salvatore.lacaveraiii@nottingham.ac.uk> ORCID iD: 0000-0003-0210-3102 <Outlook-tygjxucs.png> <https://outlook.office.com/bookwithme/user/6a3f960a8e89429cb6fc693c01d10119@...> Book a Coffee and Research chat with me! From: Carlo Bevilacqua via Software <software@biobrillouin.org <mailto:software@biobrillouin.org>> Sent: 12 February 2025 13:31 To: Kareem Elsayad <kareem.elsayad@meduniwien.ac.at <mailto:kareem.elsayad@meduniwien.ac.at>> Cc: sebastian.hambura@embl.de <mailto:sebastian.hambura@embl.de> <sebastian.hambura@embl.de <mailto:sebastian.hambura@embl.de>>; software@biobrillouin.org <mailto:software@biobrillouin.org> <software@biobrillouin.org <mailto:software@biobrillouin.org>> Subject: [Software] Re: Software manuscript / BLS microscopy
You don't often get email from software@biobrillouin.org <mailto:software@biobrillouin.org>. Learn why this is important <https://aka.ms/LearnAboutSenderIdentification> Hi Kareem, thanks for restarting this and sorry for my silence, I just came back from US and was planning to start working on this again. Could you also add Sebastian (in CC) to the mailing list?
As you outlined, I would split the project into two parts: 1) getting from the raw data to some standard "processed' spectra and 2) do data analysis/visualization on that. For the second part the way I envision it is: the most updated definition of the file format from Pierre is this one <https://github.com/bio-brillouin/HDF5_BLS/blob/GUI_development/guides/Projec...>, correct? In addition to this document I think it would be good to have a more structured description of the file (like this <https://github.com/prevedel-lab/Brillouin-standard-file/blob/main/docs/Bh5_f...>), where each field is clearly defined in terms of data type and dimensions. Sebastian was also suggesting that the document should contain the reasoning behind each specific choice in the specs and also things that we considered but decided had some issues (so in future we can look back at it). I still believe that the file format should contain the "processed" spectra (i.e. after FT and baseline subtraction for impulsive, or after taking a line profile and possibly linearization with VIPA,...) so we can apply standard data processing or visualization which is independent on the actual underlaying technique (e.g. VIPA, FP, stimulated, time domain, ...) agree on an API to read the data from our file format (most likely a Python class). For that we should: 1) decide on which information is important to extract (spectral information, spatial coordinates, hyper-parameters, metadata,...) 2) implement an interface to read the data (e.g. readSpectrumAtIndex(...), readImage(...), ...) build a GUI that use the previously defined API to show and process the data. I would say that, once we have a very solid description of the file format as in step 1, step 2 will come naturally and we can divide the actual implementation between us. Step 3 can also easily be implemented and divided between us once we have an API (and I am happy to work on the GUI myself).
The first half of the project is the trickiest and I know Pierre has already done a lot of work in that direction. We should definitely agree on which extent we can define a standard to store the raw data, given the variability between labs, (and probably we should do it for common techniques like FP or VIPA) and how to implement the treatments, leaving to possibility to load some custom code in the pipeline to do the conversion.
Let me know what you all think about this. If you agree I would start by making a document which clearly defines the file format in a structured way (as in my step 1 before). @Pierre could you write a new document or modify the document I originally made <https://github.com/prevedel-lab/Brillouin-standard-file/blob/main/docs/Bh5_f...> to reflect the latest structure you implemented for the file format? The metadata can still be defined in a separated excel sheet, as long as the data type and format is well defined there.
Best regards, Carlo
On Wed, Feb 12, 2025 at 02:19, Kareem Elsayad via Software <software@biobrillouin.org <mailto:software@biobrillouin.org>> wrote: Hi Robert, Carlo, Sal, Pierre,
Think it would be good to follow up on software project. Pierre has made some progress here and would be good to try and define tasks a little bit clearer to make progress…
There is always the potential issue of having “too many cooks in the kitchen” (that have different recipes for same thing) to move forward efficiently, something that I noticed can get quite confusing/frustrating when writing software together with people. So would be good to clearly assign tasks. I talked to Pierre today and he would be happy to integrate things in framework we have to try tie things together. What would foremost be needed would be ways of treating data, meaning code that takes a raw spectral image and meta-data and converts it into “standard” format (spectral representation) that can then be fitted. Then also “plugins” that serve a specific purpose in the analysis/rendering that can be included in framework.
The way I see it (and please comment if you see differently), there are ~4 steps here:
Take raw data (in .tif,, .dat, txt, etc. format) and meta data (in .cvs, xlsx, .dat, .txt, etc.) and render a standard spectral presentation. Also take provided instrument response in one of these formats and extract key parameters from this Fit the data with drop-down menu list of functions, that will include different functional dependences and functions corrected for instrument response. Generate/display a visual representation of results (frequency shift(s) and linewidth(s)), that is ideally interactive to some extent (and maybe has some funky features like looking at spectra at different points. These can be spatial maps and/or evolution with some other parameter (time, temperature, angle, etc.). Also be able to display maps of relative peak intensities in case of multiple peak fits, and whatever else useful you can think of. Extract “mechanical” parameters given assigned refractive indices and densities
I think the idea of fitting modified functions (e.g. corrected based on instrument response) vs. deconvolving spectra makes more sense (as can account for more complex corrections due to non-optical anomalies in future –ultimately even functional variations in vicinity of e.g. phase transitions). It is also less error prone, as systematically doing decon with non-ideal registration data can really throw you off the cliff, so to speak.
My understanding is that we kind of agreed on initial meta-data reporting format. Getting from 1 to 2 will no doubt be most challenging as it is very instrument specific. So instructions will need to be written for different BLS implementations.
This is a huge project if we want it to be all inclusive.. so I would suggest to focus on making it work for just a couple of modalities first would be good (e.g. crossed VIPA, time-resolved, anisotropy, and maybe some time or temperature course of one of these). Extensions should then be more easy to navigate. At one point think would be good to involve SBS specific considerations also.
Think would be good to discuss a while per email to gather thoughts and opinions (and already start to share codes), and then plan a meeting beginning of March -- how does first week of March look for everyone?
I created this mailing list (software@biobrillouin.org <mailto:software@biobrillouin.org>) we can use for discussion. You should all be able to post to (and it makes it easier if we bring anyone else in along the way).
At moment on this mailing list is Robert, Carlo, Sal, Pierre and myself. Let me know if I should add anyone.
All the best,
Kareem
This message and any attachment are intended solely for the addressee and may contain confidential information. If you have received this message in error, please contact the sender and delete the email and attachment. Any views or opinions expressed by the author of this email do not necessarily reflect the views of the University of Nottingham. Email communications with the University of Nottingham may be monitored where permitted by law. _______________________________________________ Software mailing list -- software@biobrillouin.org <mailto:software@biobrillouin.org> To unsubscribe send an email to software-leave@biobrillouin.org <mailto:software-leave@biobrillouin.org>
Software mailing list -- software@biobrillouin.org <mailto:software@biobrillouin.org> To unsubscribe send an email to software-leave@biobrillouin.org <mailto:software-leave@biobrillouin.org>
Hi Pierre, thanks for your reply. Regarding the file structure, what I am still not very clear about is what you define as Raw_data and data, how the actual spectra are stored and how the association to spatial coordinates and parameters is made. That's why I would really appreciate if you could make a document similar to what I did (https://github.com/prevedel-lab/Brillouin-standard-file/blob/main/docs/Bh5_f...), where it is clear what each group should (or can) contain, what is the shape of each dataset, which attributes they have, etc... I am not saying that this should be the final structure of the file but I strongly believe that having it written in a structured way helps defining it and seeing potential issues. Regarding the webapp, it works by separating the frontend, which run in the browser and is responsible of running the GUI, and the backend which is doing the actual computation and that you can structure as you like with multithreading or any optimization you wish. The communication between frontend and backend is handled transparently by the framework, so you don't have to take care of it. When you run Dash locally a local server is created so the data stays on your computer and there is no issue with data transfer/privacy. If we want to move it to a server at a later stage, then you are right about the fact that data needs to be transferred to a server (although there might be solutions that allow you to still run the computation on the local browser, like WebAssembly (https://webassembly.org/), but I think it is too complex to look into this at this stage). Regarding safety and privacy, the data will be stored on the server only for the time that the user is using the app and then deleted (of course we will need to make a disclaimer on the website about this). Regarding space I don't think people at the beginning will load their 1Tb dataset on the webapp but rather look at some small dataset of few tens of Gb; in that case 1Tb of server space is more than enough (remember that the file will be stored only for the time the user is using the app). If people really start to use the webapp and space becomes a limitation, I would be super happy to look into WebAssembly so that the data can be handled locally from the browser without transferring it to the server. To summarize I would agree that, at this stage, there might be no advantage of a webapp over a local GUI (and might actually be a bit more work to develop it). But, if this project really flies, the potential of a webapp is huge, especially in the context of the BioBrillouin society where we want to have a database of spectral data and the webapp could be used to explore that without downloading anything on your computer. My main point is that moving now to a webapp would not be too much work, but if we want to do it at a later stage it will basically entail re-writing everything from scratch. Let me know what are your thoughts about it. Best, Carlo On Wed, Feb 19, 2025 at 08:51, Pierre Bouvet wrote: Hi Carlo, You’re right, the format is still a little fuzzy. The main idea is to have a data-based hierarchy for storage: each data is stored in an individual group. From there, abscissa dependent on the data are stored in the same group and the treated data are stored in sub-groups. The names of the groups and sub-groups are fixed (Data_i), as is the name of the raw data (Raw_data) and abscissa (Abscissa_i). Also, the measure and spectrometer-dependent arguments have a defined nomenclature. To differentiate groups between them, we preferably attribute them a name as an attribute that is not used as an identifier, the identifier being either the path to the data/group from file root (Data_0/Data_42/Data_2/Raw_data) or potentially a hash value (not implemented). This I think allows all possible configurations, and using an hierarchical approach we can also pass common attributes and arrays (parameters of the spectrometer or abscissa arrays for example) on parent to reduce memory complexity. Now regarding the use of server-based GUI, first off, I’ve never used them so I’m just making supposition here but if the platform is able to treat data online, it will have to store the spectra somewhere in memory and it will not be local. My primary concerns with this approach is safety, particularly in terms of intellectual property protection, ethical considerations, and potential security vulnerabilities. Additionally, managing storage space will be a headache. Now, this doesn’t mean that we can’t have a server-based data plotter, or a server-based interface that does treatments locally but I don’t really see the benefits of this over a local software that can have multiple windows, which could at one point be multithreaded, and that could wrap c code to speed regressions for example (some of this might apply to Dash, I’m not super familiar with it). Now regarding memory complexity, having all the data we treat go on a server is a bad idea as it will raise the question of cost which will very rapidly become a real problem. Just an example: for a 100x100 map, I need 10Gb of memory (1Mo/point) with my setup (1To of archive storage is approximately 1euro/month) so this would get out of hands super fast assuming people use it. Now maybe there are solutions I don’t see for these problems and someone can take care of them but for me it’s just not worth the effort when having a local GUI solves all of these issues at once. But if you find a solution, then I’ll be happy to migrate to Dash, it won’t be fast to translate every feature but I can totally join you on the platform. Best, Pierre Pierre Bouvet, PhD Post-doctoral Fellow Medical University Vienna Department of Anatomy and Cell Biology Wahringer Straße 13, 1090 Wien, Austria On 18/2/25, at 20:26, Carlo Bevilacqua wrote: Hi Pierre, regarding the structure of the file, I agree that we should keep it simple. I am not suggesting to make it more complex, rather to have a document where we define it in a clear and structured way rather than as a general description, to make sure that we are all on the same page. I am saying this because, to be honest, I am not sure I fully understand how you are structuring the HDF5 and I think it is important to agree on this now, rather than finding at a later stage that we had different ideas. Ideally if the GUI should be part of a single application, we should write it using a unified framework. The reasons why, after considering it for a bit, I lean towards Dash rather than Qt are: * it can run in a web browser so it will be easy to eventually move it to a website, thus people can use it without installing it (which will hopefully help in promoting its use) * it is based on plotly (https://plotly.com/python/) which is a graphical library with very good plotting capabilites and highly customizable, that would make the data visualization easier/more appealing Let me know what you think about it and if you see any advantage of Qt over a web app which I am not considering. Also, if we agree that Dash might be a better option, would you consider migrating to Dash? It might not be too much work if most of the code you wrote is for data processing rather that for the GUI itself and I could help you with that. Alternatively one workaround is to have a QtWebEngine (https://doc.qt.io/qtforpython-6/overviews/qtwebengine-overview.html) in your Qt app and have the Dash app run inside that, but that would make only the Dash part portable to a server later on. Best, Carlo On Tue, Feb 18, 2025 at 10:24, Pierre Bouvet wrote: Hi, Thanks, More than merge them later, just keep them separate in the process and rather than trying to build "one code to do it all", build one library and GUI that encapsulate codes to do everything. Having a structure is a must but it needs to be kept as simple as possible else we’ll rapidly find situations where we need to change the structure. The middle ground I think is to force the use of hierarchies and impose nomenclatures where problem are expected to appear: each dataset has its own group, each group can encapsulate other groups, each parameter of a group applies to all its sub-groups if the subgroup does not change its value, each array of a group applies to all of its sub-groups if the sub-group does not redefine an array with same name, the names of the groups are held as parameters and their ID are managed by the software. For the Plotly interface, I don’t know how to integrate it to Qt but if you find a way to do it, that’s perfect with me :) My vision of the GUI is something that unifies the format and can then execute scripts on the data stored in this format. I have pushed the application of the GUI to my data up to the point where I can do the whole information extraction process from it (add data, convert to PSD, fit curves). I think this could be super interesting if we implement it for all techniques. I think we could formalize the project in milestones, in particular define the minimal denominator that will allow us to have the paper. The milestone I reached for my spectro encompasses the following points: - Being able to add data to the file easily (by dragging & dropping to the GUI) - Being able to assign properties to these data easily (again by dragging & dropping) - Being able to structure the added data in groups/folders/containers/however we want to call it - Making it easy for new data types to be loaded - Allowing data from same type but different structure to be added (e.g. .dat files) - Execute scripts on the data easily and allowing parameters of these scripts to be defined from the GUI (e.g. select a peak on a curve to fit this peak) - Make it easy to add scripts for treating or extracting PSD from raw data. - Allow the export of a Python code to access the data from the file (we cans see them as “break points” in the treatment pipeline) - Edit of properties inside the GUI In any case I think we could build a spec sheet for the project with what we want to have in it based on what we want to advertise in the paper. We can always add things later on but if we agree on a strict minimum to have the project advertised, then that will set its first milestone on which we’ll be able to build later on. Best, Pierre Pierre Bouvet, PhD Post-doctoral Fellow Medical University Vienna Department of Anatomy and Cell Biology Wahringer Straße 13, 1090 Wien, Austria On 17/2/25, at 14:53, Carlo Bevilacqua via Software wrote: Hi Pierre, hi Sal, thanks for sharing your thoughts about it. @Pierre I am very sorry that Ren passed away :( As far as I understood you are suggesting to work on the individual aspects separately and then merge them together at a later stage? I am fine with that but I still think it is very important to now agree on what should be in the file format we are defining, because that is kind of the core of the project and will affect a lot of the design choices. I am happy to start working on the GUI for data visualization. In my idea, it will be something similar to this (https://www.nature.com/articles/s41592-023-02054-z/figures/10) but written in dash (https://dash.plotly.com/), so it is a web app that for now can run locally (so no transfer of data to an external server is required) but in the future can easily be uploaded to a website that people can just use without installing anything on their computer. The question is how much of the data processing should be possible to do (or trigger) from the same GUI? I think at least a drop down menu with different fitting functions should be there, so the user can quickly check the results on a spectrum from a specific point in the image. @Pierre how are you envisioning the GUI you are working on? As far as I understood it is mainly to get the raw data and save it to our HDF5 format with some treatment on it. One idea could be to have a shared list of features that we are implementing in the GUI as we work on it, to avoid having the same functionality duplicated (or worst inconsistent) between the GUI for generating our file format and the GUI for visualization. Let me know what you think about it. Best, Carlo On Mon, Feb 17, 2025 at 11:04, Pierre Bouvet via Software wrote: Hi everyone, Sorry for the delayed response, I just went through the loss of Ren (my dog) and wasn’t at all able to answer. First of, Sal, I am making progress and I should have everything you have made on your branch integrated to the GUI branch soon, at which point I will push everything to main. Regarding the project, I think I align with Sal: keep things as simple as possible. My approach was to divide everything in 3 mostly independent layers: - Store data in an organized file that anyone can use, and make it easy to do - Convert these data into something that has physical significance: a Power Spectrum Density - Extract information from this Power Spectrum Density Each layer has its own challenge but they are independent on the challenge of having people using it: personally, if I had someone come to me with a new software to play with my measures, I would most likely only look at it for 1 minute (or less depending who made it) with a lot of apprehension and then based on how simple it looks and how much I understood of it, use it or - what is most likely - discard it. This is why Project.pdf (https://github.com/bio-brillouin/HDF5_BLS/blob/GUI_development/guides/Projec...) is essentially meant to say: we put data arrays in groups and give them attributes written in text, but you can also create groups within groups to organize your data! I believe most of the people in the BioBrillouin society will have the same approach and before having something complex that can do a lot, I think it’s best to have something simple that can just unify the format (which in itself is a lot) and that people can use right away with a minimal impact on their own individual pipelines for data processing. To be honest, I don’t think people will blindly trust our software at first to treat their data, but they will most likely use it at first to organize their raw spectra, and maybe add their own treated data if they are feeling particularly adventurous. But that is not a problem as long as we start a movement. From there yes, we can complexity and create custom file architectures but that is already too complex I think for this first project. If we can all just import our data to the wrapper and specify their attributes, this will already be a success. Then for the paper, if we can all add a custom code to treat these data to obtain a PSD, I think this will be enough. As I said, the current API already allows you to add your data in a variety of format, so it’s just a question of developing the PSD conversion before having something we can publish (and then tell people to use). A few extra points: - Working with my setup, I realized if the user could choose between different algorithms to treat their own data, it would make the overall project much more usable (if an algorithm bugs for whatever reason, you can use another one) so I created 2 bottle necks in the form of functions (for PSD conversion and treatment) that would inspect modules dedicated to either PSD conversion or treatment, and list existing functions. It’s in between classical and modular programming but it makes the development of new PSD conversion code and treatment way way easier - The GUI is developed using oriented-object programming. Therefore I have already made some low-level choices that kind of impact all the GUI. I’m not saying they are the best choices, I’m just saying that they work, so if you want to work on the GUI, I would either recommend getting familiar with these choices, or making sure that all the functionalities are preserved, particularly the ones that are invisible (logging of treatment steps, treatment errors…) I’ll try merging the branches on Git asap and will definitely send you all an email when it’s done :) Best, Pierre Pierre Bouvet, PhD Post-doctoral Fellow Medical University Vienna Department of Anatomy and Cell Biology Wahringer Straße 13, 1090 Wien, Austria On 14/2/25, at 19:36, Sal La Cavera Iii via Software wrote: Hi all, I agree with the things enumerated and points made by Kareem/Carlo! I guess I would advocate for starting from a position of simplicity. We probably don't want to get weighed down by trying to include a bunch of bells and whistles from the start as these can be easily added once there is a minimally viable stable product. As long as data can be loaded to local memory, then treated in various (initially simple) ways through the GUI (and maybe maintain non-GUI compatibility for command-line warriors like myself), then the bh5 formatting stuff can be sorted on the back end? I definitely agree with Carlo's structure set out in the file format document; but all of that data will be floating around the memory in some shape or form and just needs to be wrapped up and packaged (according to Carlo's structure e.g.) when the user is happy and presses the "generate h5 filestore" etc. (?) Definitely agree with the recommendation to create the alpha using mainly requirements that our 3 labs would find useful (import filetypes, treatments, etc), and then we can add on more universal functionality second / get some beta testers in from other labs etc. I'm able to support on whatever jobs need doing and am free to meet in the beginning of March like you mentioned Kareem. Hope you guys have a nice weekend, Cheers, Sal ---------------------------------------------------------------Salvatore La Cavera IIIRoyal Academy of Engineering Research FellowNottingham Research FellowOptics and Photonics GroupUniversity of Nottingham Email: salvatore.lacaveraiii@nottingham.ac.uk (mailto:salvatore.lacaveraiii@nottingham.ac.uk) ORCID iD: 0000-0003-0210-3102 (https://outlook.office.com/bookwithme/user/6a3f960a8e89429cb6fc693c01d10119@...) Book a Coffee and Research chat with me! ------------------------------------ From: Carlo Bevilacqua via Software Sent: 12 February 2025 13:31 To: Kareem Elsayad Cc: sebastian.hambura@embl.de (mailto:sebastian.hambura@embl.de) ; software@biobrillouin.org (mailto:software@biobrillouin.org) Subject: [Software] Re: Software manuscript / BLS microscopy You don't often get email from software@biobrillouin.org (mailto:software@biobrillouin.org). Learn why this is important (https://aka.ms/LearnAboutSenderIdentification) Hi Kareem, thanks for restarting this and sorry for my silence, I just came back from US and was planning to start working on this again. Could you also add Sebastian (in CC) to the mailing list? As you outlined, I would split the project into two parts: 1) getting from the raw data to some standard "processed' spectra and 2) do data analysis/visualization on that. For the second part the way I envision it is: * the most updated definition of the file format from Pierre is this one (https://github.com/bio-brillouin/HDF5_BLS/blob/GUI_development/guides/Projec...), correct? In addition to this document I think it would be good to have a more structured description of the file (like this (https://github.com/prevedel-lab/Brillouin-standard-file/blob/main/docs/Bh5_f...)), where each field is clearly defined in terms of data type and dimensions. Sebastian was also suggesting that the document should contain the reasoning behind each specific choice in the specs and also things that we considered but decided had some issues (so in future we can look back at it). I still believe that the file format should contain the "processed" spectra (i.e. after FT and baseline subtraction for impulsive, or after taking a line profile and possibly linearization with VIPA,...) so we can apply standard data processing or visualization which is independent on the actual underlaying technique (e.g. VIPA, FP, stimulated, time domain, ...) * agree on an API to read the data from our file format (most likely a Python class). For that we should: 1) decide on which information is important to extract (spectral information, spatial coordinates, hyper-parameters, metadata,...) 2) implement an interface to read the data (e.g. readSpectrumAtIndex(...), readImage(...), ...) * build a GUI that use the previously defined API to show and process the data. I would say that, once we have a very solid description of the file format as in step 1, step 2 will come naturally and we can divide the actual implementation between us. Step 3 can also easily be implemented and divided between us once we have an API (and I am happy to work on the GUI myself). The first half of the project is the trickiest and I know Pierre has already done a lot of work in that direction. We should definitely agree on which extent we can define a standard to store the raw data, given the variability between labs, (and probably we should do it for common techniques like FP or VIPA) and how to implement the treatments, leaving to possibility to load some custom code in the pipeline to do the conversion. Let me know what you all think about this. If you agree I would start by making a document which clearly defines the file format in a structured way (as in my step 1 before). @Pierre could you write a new document or modify the document I originally made (https://github.com/prevedel-lab/Brillouin-standard-file/blob/main/docs/Bh5_f...) to reflect the latest structure you implemented for the file format? The metadata can still be defined in a separated excel sheet, as long as the data type and format is well defined there. Best regards, Carlo On Wed, Feb 12, 2025 at 02:19, Kareem Elsayad via Software wrote: Hi Robert, Carlo, Sal, Pierre, Think it would be good to follow up on software project. Pierre has made some progress here and would be good to try and define tasks a little bit clearer to make progress… There is always the potential issue of having “too many cooks in the kitchen” (that have different recipes for same thing) to move forward efficiently, something that I noticed can get quite confusing/frustrating when writing software together with people. So would be good to clearly assign tasks. I talked to Pierre today and he would be happy to integrate things in framework we have to try tie things together. What would foremost be needed would be ways of treating data, meaning code that takes a raw spectral image and meta-data and converts it into “standard” format (spectral representation) that can then be fitted. Then also “plugins” that serve a specific purpose in the analysis/rendering that can be included in framework. The way I see it (and please comment if you see differently), there are ~4 steps here: * Take raw data (in .tif,, .dat, txt, etc. format) and meta data (in .cvs, xlsx, .dat, .txt, etc.) and render a standard spectral presentation. Also take provided instrument response in one of these formats and extract key parameters from this * Fit the data with drop-down menu list of functions, that will include different functional dependences and functions corrected for instrument response. * Generate/display a visual representation of results (frequency shift(s) and linewidth(s)), that is ideally interactive to some extent (and maybe has some funky features like looking at spectra at different points. These can be spatial maps and/or evolution with some other parameter (time, temperature, angle, etc.). Also be able to display maps of relative peak intensities in case of multiple peak fits, and whatever else useful you can think of. * Extract “mechanical” parameters given assigned refractive indices and densities I think the idea of fitting modified functions (e.g. corrected based on instrument response) vs. deconvolving spectra makes more sense (as can account for more complex corrections due to non-optical anomalies in future –ultimately even functional variations in vicinity of e.g. phase transitions). It is also less error prone, as systematically doing decon with non-ideal registration data can really throw you off the cliff, so to speak. My understanding is that we kind of agreed on initial meta-data reporting format. Getting from 1 to 2 will no doubt be most challenging as it is very instrument specific. So instructions will need to be written for different BLS implementations. This is a huge project if we want it to be all inclusive.. so I would suggest to focus on making it work for just a couple of modalities first would be good (e.g. crossed VIPA, time-resolved, anisotropy, and maybe some time or temperature course of one of these). Extensions should then be more easy to navigate. At one point think would be good to involve SBS specific considerations also. Think would be good to discuss a while per email to gather thoughts and opinions (and already start to share codes), and then plan a meeting beginning of March -- how does first week of March look for everyone? I created this mailing list (software@biobrillouin.org (mailto:software@biobrillouin.org)) we can use for discussion. You should all be able to post to (and it makes it easier if we bring anyone else in along the way). At moment on this mailing list is Robert, Carlo, Sal, Pierre and myself. Let me know if I should add anyone. All the best, Kareem This message and any attachment are intended solely for the addressee and may contain confidential information. If you have received this message in error, please contact the sender and delete the email and attachment. Any views or opinions expressed by the author of this email do not necessarily reflect the views of the University of Nottingham. Email communications with the University of Nottingham may be monitored where permitted by law. _______________________________________________ Software mailing list -- software@biobrillouin.org (mailto:software@biobrillouin.org) To unsubscribe send an email to software-leave@biobrillouin.org (mailto:software-leave@biobrillouin.org) _______________________________________________ Software mailing list -- software@biobrillouin.org (mailto:software@biobrillouin.org) To unsubscribe send an email to software-leave@biobrillouin.org (mailto:software-leave@biobrillouin.org)
Hi, I think you're trying to go too far too fast. The approach I present here <https://github.com/bio-brillouin/HDF5_BLS/blob/GUI_development/guides/Projec...> is intentionally simple, so that people can very quickly get to storing their data in a HDF5 file format together with the parameters they used to acquire them with minimal effort. The closest to what you did is therefore as follows: - data are datasets with no other restriction and they are stored in groups - each group can have a set of attribute proper to the data they are storing - attributes have a nomenclature imposed by a spreadsheet and are in the form of text - the default name of a data is the name of a raw data: “Raw_data”, other arrays can have whatever name they want (Shift_5GHz, Frequency, ...) - arrays and attributes are hierarchical, so they apply to their groups and all groups under it. This is the bare minimum to meet our needs, so we need to stop here in the definition of the format since it’s already enough to have the GUI working correctly, and therefore the first version of the unified software advertised. Of course we will have to refine things later on, but we don’t want to scare people off by presenting them a file description that for one might not match their measurements and that is extremely hard to conceptually understand. To make my point clearer, take your definition of the format for example: there are 3 different amplitude arrays in your description, two different shift arrays and width arrays that are of different dimension, then we have a calibration group on one side but a spectrometer characterization array in another group that is called “experiment_info”, that’s just too complicated to use correctly. On the other hand, placing your raw data “as is” in a group dedicated to this data is conceptually easy and straightforward. Where you are right, is that should we have hundreds of people using it, we might in a near future want to store abscissa, impulse responses, … in a standardized manner. In that case, the question falls down to either adding sub-groups or storing the data together with the measure. Both are fine and don’t really pose a problem for now, essentially because we are not trying to visualize the results but just trying to unify the way to get them. Now regarding Dash, if I understand correctly, it’s just a way to change the frontend you propose? If that’s so, why not, but then I don’t really see the benefits: if you really want to use dash, you can always embed it inside a Qt app. Also Dash being browser based, you will only have one window for the whole interface, which will be a pain to deal with if you want to use the interface to do everything the GUI is expected to do (inspect an H5 file, convert PSD, treat data, edit parameters, inspect a failed treatment, simulate results using setups with slight changes of parameters…). We agree that at one point when people receive an h5 file, it will be useful to have a web interface that can do what yours or Sal’s GUI do (seeing the mapping results together with the spectrum, eventually the time-domain signal) but here again, it’s going too far too soon: let’s first have a simple and reliable GUI that can convert data from any spectrometer to PSDs and treat them with a unified code. This is the real challenge, visualization and nomenclature of results are both important but secondary. Also keep in mind that, the frontend can easily be generated by anyone really, with Copilot or ChatGPT or whatever AI, but you can’t ask them to develop the function that will correctly read your data and convert them to a PSD nor treat the PSD. This is done on the backend and is the priority since the unification essentially happens there. Best, Pierre Pierre Bouvet, PhD Post-doctoral Fellow Medical University Vienna Department of Anatomy and Cell Biology Wahringer Straße 13, 1090 Wien, Austria
On 19/2/25, at 13:21, Carlo Bevilacqua <carlo.bevilacqua@embl.de> wrote:
Hi Pierre, thanks for your reply.
Regarding the file structure, what I am still not very clear about is what you define as Raw_data and data, how the actual spectra are stored and how the association to spatial coordinates and parameters is made. That's why I would really appreciate if you could make a document similar to what I did <https://github.com/prevedel-lab/Brillouin-standard-file/blob/main/docs/Bh5_f...>, where it is clear what each group should (or can) contain, what is the shape of each dataset, which attributes they have, etc... I am not saying that this should be the final structure of the file but I strongly believe that having it written in a structured way helps defining it and seeing potential issues.
Regarding the webapp, it works by separating the frontend, which run in the browser and is responsible of running the GUI, and the backend which is doing the actual computation and that you can structure as you like with multithreading or any optimization you wish. The communication between frontend and backend is handled transparently by the framework, so you don't have to take care of it. When you run Dash locally a local server is created so the data stays on your computer and there is no issue with data transfer/privacy. If we want to move it to a server at a later stage, then you are right about the fact that data needs to be transferred to a server (although there might be solutions that allow you to still run the computation on the local browser, like WebAssembly <https://webassembly.org/>, but I think it is too complex to look into this at this stage). Regarding safety and privacy, the data will be stored on the server only for the time that the user is using the app and then deleted (of course we will need to make a disclaimer on the website about this). Regarding space I don't think people at the beginning will load their 1Tb dataset on the webapp but rather look at some small dataset of few tens of Gb; in that case 1Tb of server space is more than enough (remember that the file will be stored only for the time the user is using the app). If people really start to use the webapp and space becomes a limitation, I would be super happy to look into WebAssembly so that the data can be handled locally from the browser without transferring it to the server.
To summarize I would agree that, at this stage, there might be no advantage of a webapp over a local GUI (and might actually be a bit more work to develop it). But, if this project really flies, the potential of a webapp is huge, especially in the context of the BioBrillouin society where we want to have a database of spectral data and the webapp could be used to explore that without downloading anything on your computer. My main point is that moving now to a webapp would not be too much work, but if we want to do it at a later stage it will basically entail re-writing everything from scratch.
Let me know what are your thoughts about it.
Best, Carlo
On Wed, Feb 19, 2025 at 08:51, Pierre Bouvet <pierre.bouvet@meduniwien.ac.at <mailto:pierre.bouvet@meduniwien.ac.at>> wrote: Hi Carlo,
You’re right, the format is still a little fuzzy. The main idea is to have a data-based hierarchy for storage: each data is stored in an individual group. From there, abscissa dependent on the data are stored in the same group and the treated data are stored in sub-groups. The names of the groups and sub-groups are fixed (Data_i), as is the name of the raw data (Raw_data) and abscissa (Abscissa_i). Also, the measure and spectrometer-dependent arguments have a defined nomenclature. To differentiate groups between them, we preferably attribute them a name as an attribute that is not used as an identifier, the identifier being either the path to the data/group from file root (Data_0/Data_42/Data_2/Raw_data) or potentially a hash value (not implemented). This I think allows all possible configurations, and using an hierarchical approach we can also pass common attributes and arrays (parameters of the spectrometer or abscissa arrays for example) on parent to reduce memory complexity. Now regarding the use of server-based GUI, first off, I’ve never used them so I’m just making supposition here but if the platform is able to treat data online, it will have to store the spectra somewhere in memory and it will not be local. My primary concerns with this approach is safety, particularly in terms of intellectual property protection, ethical considerations, and potential security vulnerabilities. Additionally, managing storage space will be a headache. Now, this doesn’t mean that we can’t have a server-based data plotter, or a server-based interface that does treatments locally but I don’t really see the benefits of this over a local software that can have multiple windows, which could at one point be multithreaded, and that could wrap c code to speed regressions for example (some of this might apply to Dash, I’m not super familiar with it). Now regarding memory complexity, having all the data we treat go on a server is a bad idea as it will raise the question of cost which will very rapidly become a real problem. Just an example: for a 100x100 map, I need 10Gb of memory (1Mo/point) with my setup (1To of archive storage is approximately 1euro/month) so this would get out of hands super fast assuming people use it. Now maybe there are solutions I don’t see for these problems and someone can take care of them but for me it’s just not worth the effort when having a local GUI solves all of these issues at once. But if you find a solution, then I’ll be happy to migrate to Dash, it won’t be fast to translate every feature but I can totally join you on the platform.
Best,
Pierre
Pierre Bouvet, PhD Post-doctoral Fellow Medical University Vienna Department of Anatomy and Cell Biology Wahringer Straße 13, 1090 Wien, Austria
On 18/2/25, at 20:26, Carlo Bevilacqua <carlo.bevilacqua@embl.de <mailto:carlo.bevilacqua@embl.de>> wrote:
Hi Pierre,
regarding the structure of the file, I agree that we should keep it simple. I am not suggesting to make it more complex, rather to have a document where we define it in a clear and structured way rather than as a general description, to make sure that we are all on the same page. I am saying this because, to be honest, I am not sure I fully understand how you are structuring the HDF5 and I think it is important to agree on this now, rather than finding at a later stage that we had different ideas.
Ideally if the GUI should be part of a single application, we should write it using a unified framework. The reasons why, after considering it for a bit, I lean towards Dash rather than Qt are: it can run in a web browser so it will be easy to eventually move it to a website, thus people can use it without installing it (which will hopefully help in promoting its use) it is based on plotly <https://plotly.com/python/> which is a graphical library with very good plotting capabilites and highly customizable, that would make the data visualization easier/more appealing Let me know what you think about it and if you see any advantage of Qt over a web app which I am not considering. Also, if we agree that Dash might be a better option, would you consider migrating to Dash? It might not be too much work if most of the code you wrote is for data processing rather that for the GUI itself and I could help you with that. Alternatively one workaround is to have a QtWebEngine <https://doc.qt.io/qtforpython-6/overviews/qtwebengine-overview.html> in your Qt app and have the Dash app run inside that, but that would make only the Dash part portable to a server later on.
Best, Carlo
On Tue, Feb 18, 2025 at 10:24, Pierre Bouvet <pierre.bouvet@meduniwien.ac.at <mailto:pierre.bouvet@meduniwien.ac.at>> wrote: Hi,
Thanks,
More than merge them later, just keep them separate in the process and rather than trying to build "one code to do it all", build one library and GUI that encapsulate codes to do everything. Having a structure is a must but it needs to be kept as simple as possible else we’ll rapidly find situations where we need to change the structure. The middle ground I think is to force the use of hierarchies and impose nomenclatures where problem are expected to appear: each dataset has its own group, each group can encapsulate other groups, each parameter of a group applies to all its sub-groups if the subgroup does not change its value, each array of a group applies to all of its sub-groups if the sub-group does not redefine an array with same name, the names of the groups are held as parameters and their ID are managed by the software. For the Plotly interface, I don’t know how to integrate it to Qt but if you find a way to do it, that’s perfect with me :) My vision of the GUI is something that unifies the format and can then execute scripts on the data stored in this format. I have pushed the application of the GUI to my data up to the point where I can do the whole information extraction process from it (add data, convert to PSD, fit curves). I think this could be super interesting if we implement it for all techniques. I think we could formalize the project in milestones, in particular define the minimal denominator that will allow us to have the paper. The milestone I reached for my spectro encompasses the following points: - Being able to add data to the file easily (by dragging & dropping to the GUI) - Being able to assign properties to these data easily (again by dragging & dropping) - Being able to structure the added data in groups/folders/containers/however we want to call it - Making it easy for new data types to be loaded - Allowing data from same type but different structure to be added (e.g. .dat files) - Execute scripts on the data easily and allowing parameters of these scripts to be defined from the GUI (e.g. select a peak on a curve to fit this peak) - Make it easy to add scripts for treating or extracting PSD from raw data. - Allow the export of a Python code to access the data from the file (we cans see them as “break points” in the treatment pipeline) - Edit of properties inside the GUI In any case I think we could build a spec sheet for the project with what we want to have in it based on what we want to advertise in the paper. We can always add things later on but if we agree on a strict minimum to have the project advertised, then that will set its first milestone on which we’ll be able to build later on.
Best,
Pierre
Pierre Bouvet, PhD Post-doctoral Fellow Medical University Vienna Department of Anatomy and Cell Biology Wahringer Straße 13, 1090 Wien, Austria
On 17/2/25, at 14:53, Carlo Bevilacqua via Software <software@biobrillouin.org <mailto:software@biobrillouin.org>> wrote:
Hi Pierre, hi Sal, thanks for sharing your thoughts about it. @Pierre I am very sorry that Ren passed away :(
As far as I understood you are suggesting to work on the individual aspects separately and then merge them together at a later stage? I am fine with that but I still think it is very important to now agree on what should be in the file format we are defining, because that is kind of the core of the project and will affect a lot of the design choices.
I am happy to start working on the GUI for data visualization. In my idea, it will be something similar to this <https://www.nature.com/articles/s41592-023-02054-z/figures/10> but written in dash <https://dash.plotly.com/>, so it is a web app that for now can run locally (so no transfer of data to an external server is required) but in the future can easily be uploaded to a website that people can just use without installing anything on their computer. The question is how much of the data processing should be possible to do (or trigger) from the same GUI? I think at least a drop down menu with different fitting functions should be there, so the user can quickly check the results on a spectrum from a specific point in the image. @Pierre how are you envisioning the GUI you are working on? As far as I understood it is mainly to get the raw data and save it to our HDF5 format with some treatment on it. One idea could be to have a shared list of features that we are implementing in the GUI as we work on it, to avoid having the same functionality duplicated (or worst inconsistent) between the GUI for generating our file format and the GUI for visualization.
Let me know what you think about it.
Best, Carlo
On Mon, Feb 17, 2025 at 11:04, Pierre Bouvet via Software <software@biobrillouin.org <mailto:software@biobrillouin.org>> wrote: Hi everyone,
Sorry for the delayed response, I just went through the loss of Ren (my dog) and wasn’t at all able to answer. First of, Sal, I am making progress and I should have everything you have made on your branch integrated to the GUI branch soon, at which point I will push everything to main. Regarding the project, I think I align with Sal: keep things as simple as possible. My approach was to divide everything in 3 mostly independent layers: - Store data in an organized file that anyone can use, and make it easy to do - Convert these data into something that has physical significance: a Power Spectrum Density - Extract information from this Power Spectrum Density Each layer has its own challenge but they are independent on the challenge of having people using it: personally, if I had someone come to me with a new software to play with my measures, I would most likely only look at it for 1 minute (or less depending who made it) with a lot of apprehension and then based on how simple it looks and how much I understood of it, use it or - what is most likely - discard it. This is why Project.pdf <https://github.com/bio-brillouin/HDF5_BLS/blob/GUI_development/guides/Projec...> is essentially meant to say: we put data arrays in groups and give them attributes written in text, but you can also create groups within groups to organize your data! I believe most of the people in the BioBrillouin society will have the same approach and before having something complex that can do a lot, I think it’s best to have something simple that can just unify the format (which in itself is a lot) and that people can use right away with a minimal impact on their own individual pipelines for data processing. To be honest, I don’t think people will blindly trust our software at first to treat their data, but they will most likely use it at first to organize their raw spectra, and maybe add their own treated data if they are feeling particularly adventurous. But that is not a problem as long as we start a movement. From there yes, we can complexity and create custom file architectures but that is already too complex I think for this first project. If we can all just import our data to the wrapper and specify their attributes, this will already be a success. Then for the paper, if we can all add a custom code to treat these data to obtain a PSD, I think this will be enough. As I said, the current API already allows you to add your data in a variety of format, so it’s just a question of developing the PSD conversion before having something we can publish (and then tell people to use).
A few extra points: - Working with my setup, I realized if the user could choose between different algorithms to treat their own data, it would make the overall project much more usable (if an algorithm bugs for whatever reason, you can use another one) so I created 2 bottle necks in the form of functions (for PSD conversion and treatment) that would inspect modules dedicated to either PSD conversion or treatment, and list existing functions. It’s in between classical and modular programming but it makes the development of new PSD conversion code and treatment way way easier - The GUI is developed using oriented-object programming. Therefore I have already made some low-level choices that kind of impact all the GUI. I’m not saying they are the best choices, I’m just saying that they work, so if you want to work on the GUI, I would either recommend getting familiar with these choices, or making sure that all the functionalities are preserved, particularly the ones that are invisible (logging of treatment steps, treatment errors…)
I’ll try merging the branches on Git asap and will definitely send you all an email when it’s done :)
Best,
Pierre
Pierre Bouvet, PhD Post-doctoral Fellow Medical University Vienna Department of Anatomy and Cell Biology Wahringer Straße 13, 1090 Wien, Austria
On 14/2/25, at 19:36, Sal La Cavera Iii via Software <software@biobrillouin.org <mailto:software@biobrillouin.org>> wrote:
Hi all,
I agree with the things enumerated and points made by Kareem/Carlo! I guess I would advocate for starting from a position of simplicity. We probably don't want to get weighed down by trying to include a bunch of bells and whistles from the start as these can be easily added once there is a minimally viable stable product.
As long as data can be loaded to local memory, then treated in various (initially simple) ways through the GUI (and maybe maintain non-GUI compatibility for command-line warriors like myself), then the bh5 formatting stuff can be sorted on the back end? I definitely agree with Carlo's structure set out in the file format document; but all of that data will be floating around the memory in some shape or form and just needs to be wrapped up and packaged (according to Carlo's structure e.g.) when the user is happy and presses the "generate h5 filestore" etc. (?)
Definitely agree with the recommendation to create the alpha using mainly requirements that our 3 labs would find useful (import filetypes, treatments, etc), and then we can add on more universal functionality second / get some beta testers in from other labs etc.
I'm able to support on whatever jobs need doing and am free to meet in the beginning of March like you mentioned Kareem.
Hope you guys have a nice weekend,
Cheers,
Sal
--------------------------------------------------------------- Salvatore La Cavera III Royal Academy of Engineering Research Fellow Nottingham Research Fellow Optics and Photonics Group University of Nottingham Email: salvatore.lacaveraiii@nottingham.ac.uk <mailto:salvatore.lacaveraiii@nottingham.ac.uk> ORCID iD: 0000-0003-0210-3102 <Outlook-tygjxucs.png> <https://outlook.office.com/bookwithme/user/6a3f960a8e89429cb6fc693c01d10119@...> Book a Coffee and Research chat with me! From: Carlo Bevilacqua via Software <software@biobrillouin.org <mailto:software@biobrillouin.org>> Sent: 12 February 2025 13:31 To: Kareem Elsayad <kareem.elsayad@meduniwien.ac.at <mailto:kareem.elsayad@meduniwien.ac.at>> Cc: sebastian.hambura@embl.de <mailto:sebastian.hambura@embl.de> <sebastian.hambura@embl.de <mailto:sebastian.hambura@embl.de>>; software@biobrillouin.org <mailto:software@biobrillouin.org> <software@biobrillouin.org <mailto:software@biobrillouin.org>> Subject: [Software] Re: Software manuscript / BLS microscopy
You don't often get email from software@biobrillouin.org <mailto:software@biobrillouin.org>. Learn why this is important <https://aka.ms/LearnAboutSenderIdentification> Hi Kareem, thanks for restarting this and sorry for my silence, I just came back from US and was planning to start working on this again. Could you also add Sebastian (in CC) to the mailing list?
As you outlined, I would split the project into two parts: 1) getting from the raw data to some standard "processed' spectra and 2) do data analysis/visualization on that. For the second part the way I envision it is: the most updated definition of the file format from Pierre is this one <https://github.com/bio-brillouin/HDF5_BLS/blob/GUI_development/guides/Projec...>, correct? In addition to this document I think it would be good to have a more structured description of the file (like this <https://github.com/prevedel-lab/Brillouin-standard-file/blob/main/docs/Bh5_f...>), where each field is clearly defined in terms of data type and dimensions. Sebastian was also suggesting that the document should contain the reasoning behind each specific choice in the specs and also things that we considered but decided had some issues (so in future we can look back at it). I still believe that the file format should contain the "processed" spectra (i.e. after FT and baseline subtraction for impulsive, or after taking a line profile and possibly linearization with VIPA,...) so we can apply standard data processing or visualization which is independent on the actual underlaying technique (e.g. VIPA, FP, stimulated, time domain, ...) agree on an API to read the data from our file format (most likely a Python class). For that we should: 1) decide on which information is important to extract (spectral information, spatial coordinates, hyper-parameters, metadata,...) 2) implement an interface to read the data (e.g. readSpectrumAtIndex(...), readImage(...), ...) build a GUI that use the previously defined API to show and process the data. I would say that, once we have a very solid description of the file format as in step 1, step 2 will come naturally and we can divide the actual implementation between us. Step 3 can also easily be implemented and divided between us once we have an API (and I am happy to work on the GUI myself).
The first half of the project is the trickiest and I know Pierre has already done a lot of work in that direction. We should definitely agree on which extent we can define a standard to store the raw data, given the variability between labs, (and probably we should do it for common techniques like FP or VIPA) and how to implement the treatments, leaving to possibility to load some custom code in the pipeline to do the conversion.
Let me know what you all think about this. If you agree I would start by making a document which clearly defines the file format in a structured way (as in my step 1 before). @Pierre could you write a new document or modify the document I originally made <https://github.com/prevedel-lab/Brillouin-standard-file/blob/main/docs/Bh5_f...> to reflect the latest structure you implemented for the file format? The metadata can still be defined in a separated excel sheet, as long as the data type and format is well defined there.
Best regards, Carlo
On Wed, Feb 12, 2025 at 02:19, Kareem Elsayad via Software <software@biobrillouin.org <mailto:software@biobrillouin.org>> wrote: Hi Robert, Carlo, Sal, Pierre,
Think it would be good to follow up on software project. Pierre has made some progress here and would be good to try and define tasks a little bit clearer to make progress…
There is always the potential issue of having “too many cooks in the kitchen” (that have different recipes for same thing) to move forward efficiently, something that I noticed can get quite confusing/frustrating when writing software together with people. So would be good to clearly assign tasks. I talked to Pierre today and he would be happy to integrate things in framework we have to try tie things together. What would foremost be needed would be ways of treating data, meaning code that takes a raw spectral image and meta-data and converts it into “standard” format (spectral representation) that can then be fitted. Then also “plugins” that serve a specific purpose in the analysis/rendering that can be included in framework.
The way I see it (and please comment if you see differently), there are ~4 steps here:
Take raw data (in .tif,, .dat, txt, etc. format) and meta data (in .cvs, xlsx, .dat, .txt, etc.) and render a standard spectral presentation. Also take provided instrument response in one of these formats and extract key parameters from this Fit the data with drop-down menu list of functions, that will include different functional dependences and functions corrected for instrument response. Generate/display a visual representation of results (frequency shift(s) and linewidth(s)), that is ideally interactive to some extent (and maybe has some funky features like looking at spectra at different points. These can be spatial maps and/or evolution with some other parameter (time, temperature, angle, etc.). Also be able to display maps of relative peak intensities in case of multiple peak fits, and whatever else useful you can think of. Extract “mechanical” parameters given assigned refractive indices and densities
I think the idea of fitting modified functions (e.g. corrected based on instrument response) vs. deconvolving spectra makes more sense (as can account for more complex corrections due to non-optical anomalies in future –ultimately even functional variations in vicinity of e.g. phase transitions). It is also less error prone, as systematically doing decon with non-ideal registration data can really throw you off the cliff, so to speak.
My understanding is that we kind of agreed on initial meta-data reporting format. Getting from 1 to 2 will no doubt be most challenging as it is very instrument specific. So instructions will need to be written for different BLS implementations.
This is a huge project if we want it to be all inclusive.. so I would suggest to focus on making it work for just a couple of modalities first would be good (e.g. crossed VIPA, time-resolved, anisotropy, and maybe some time or temperature course of one of these). Extensions should then be more easy to navigate. At one point think would be good to involve SBS specific considerations also.
Think would be good to discuss a while per email to gather thoughts and opinions (and already start to share codes), and then plan a meeting beginning of March -- how does first week of March look for everyone?
I created this mailing list (software@biobrillouin.org <mailto:software@biobrillouin.org>) we can use for discussion. You should all be able to post to (and it makes it easier if we bring anyone else in along the way).
At moment on this mailing list is Robert, Carlo, Sal, Pierre and myself. Let me know if I should add anyone.
All the best,
Kareem
This message and any attachment are intended solely for the addressee and may contain confidential information. If you have received this message in error, please contact the sender and delete the email and attachment. Any views or opinions expressed by the author of this email do not necessarily reflect the views of the University of Nottingham. Email communications with the University of Nottingham may be monitored where permitted by law. _______________________________________________ Software mailing list -- software@biobrillouin.org <mailto:software@biobrillouin.org> To unsubscribe send an email to software-leave@biobrillouin.org <mailto:software-leave@biobrillouin.org>
Software mailing list -- software@biobrillouin.org <mailto:software@biobrillouin.org> To unsubscribe send an email to software-leave@biobrillouin.org <mailto:software-leave@biobrillouin.org>
Hi Pierre, I realized that we might have slightly different aims. For me the most important part of this project is to have a unified file format that can be read and visualized by a standard software. The file format you are proposing is not sufficient for that in my opinion. For example one of my main motivation was to have an interface where the user can see the reconstructed image, click on a pixel, see the corresponding spectrum to check its quality and maybe try different fitting functions; that would already not be possible with your structure because the software would have no notion on where the spectral data is stored and how to associate it to a specific pixel. I don't see the structure of the file to be too complex as an issue, as long as it is functional: we can always provide an API and/or a GUI that allow people to take their spectra and save them in whatever format we decide without bothering about understanding the actual structure, the same way you can work with HDF5 file without having any understanding on how the data is actually stored on the disk. My idea of making a webapp as a GUI follows directly from there. Typical case: I sent some data to a collaborator and they can just run the app in their browser and check if the outliers they see in the image are real or a bad spectra. Similarly if we make a common database of Brillouin spectra, people can explore it easily using the webapp. From what I understood, you are instead more interested in going from raw data to an actual spectrum, which I don't see so much as a priority because each lab has their own code already and the actual procedure would be different for each lab (apart from standard instruments like the FP). I am not saying this should not be part of the software but not as a priority and rather has a layer where people can easily implement their own code (of course we could already implement code for standard instruments). I think it would be good to cleary define what is our common aim now, so we are sure we are working in the same direction. Let me know if you agree or I misunderstood what is your idea. Best, Carlo On Wed, Feb 19, 2025 at 16:11, Pierre Bouvet wrote: Hi, I think you're trying to go too far too fast. The approach I present here (https://github.com/bio-brillouin/HDF5_BLS/blob/GUI_development/guides/Projec...) is intentionally simple, so that people can very quickly get to storing their data in a HDF5 file format together with the parameters they used to acquire them with minimal effort. The closest to what you did is therefore as follows: - data are datasets with no other restriction and they are stored in groups - each group can have a set of attribute proper to the data they are storing - attributes have a nomenclature imposed by a spreadsheet and are in the form of text - the default name of a data is the name of a raw data: “Raw_data”, other arrays can have whatever name they want (Shift_5GHz, Frequency, ...) - arrays and attributes are hierarchical, so they apply to their groups and all groups under it. This is the bare minimum to meet our needs, so we need to stop here in the definition of the format since it’s already enough to have the GUI working correctly, and therefore the first version of the unified software advertised. Of course we will have to refine things later on, but we don’t want to scare people off by presenting them a file description that for one might not match their measurements and that is extremely hard to conceptually understand. To make my point clearer, take your definition of the format for example: there are 3 different amplitude arrays in your description, two different shift arrays and width arrays that are of different dimension, then we have a calibration group on one side but a spectrometer characterization array in another group that is called “experiment_info”, that’s just too complicated to use correctly. On the other hand, placing your raw data “as is” in a group dedicated to this data is conceptually easy and straightforward. Where you are right, is that should we have hundreds of people using it, we might in a near future want to store abscissa, impulse responses, … in a standardized manner. In that case, the question falls down to either adding sub-groups or storing the data together with the measure. Both are fine and don’t really pose a problem for now, essentially because we are not trying to visualize the results but just trying to unify the way to get them. Now regarding Dash, if I understand correctly, it’s just a way to change the frontend you propose? If that’s so, why not, but then I don’t really see the benefits: if you really want to use dash, you can always embed it inside a Qt app. Also Dash being browser based, you will only have one window for the whole interface, which will be a pain to deal with if you want to use the interface to do everything the GUI is expected to do (inspect an H5 file, convert PSD, treat data, edit parameters, inspect a failed treatment, simulate results using setups with slight changes of parameters…). We agree that at one point when people receive an h5 file, it will be useful to have a web interface that can do what yours or Sal’s GUI do (seeing the mapping results together with the spectrum, eventually the time-domain signal) but here again, it’s going too far too soon: let’s first have a simple and reliable GUI that can convert data from any spectrometer to PSDs and treat them with a unified code. This is the real challenge, visualization and nomenclature of results are both important but secondary. Also keep in mind that, the frontend can easily be generated by anyone really, with Copilot or ChatGPT or whatever AI, but you can’t ask them to develop the function that will correctly read your data and convert them to a PSD nor treat the PSD. This is done on the backend and is the priority since the unification essentially happens there. Best, Pierre Pierre Bouvet, PhD Post-doctoral Fellow Medical University Vienna Department of Anatomy and Cell Biology Wahringer Straße 13, 1090 Wien, Austria On 19/2/25, at 13:21, Carlo Bevilacqua wrote: Hi Pierre, thanks for your reply. Regarding the file structure, what I am still not very clear about is what you define as Raw_data and data, how the actual spectra are stored and how the association to spatial coordinates and parameters is made. That's why I would really appreciate if you could make a document similar to what I did (https://github.com/prevedel-lab/Brillouin-standard-file/blob/main/docs/Bh5_f...), where it is clear what each group should (or can) contain, what is the shape of each dataset, which attributes they have, etc... I am not saying that this should be the final structure of the file but I strongly believe that having it written in a structured way helps defining it and seeing potential issues. Regarding the webapp, it works by separating the frontend, which run in the browser and is responsible of running the GUI, and the backend which is doing the actual computation and that you can structure as you like with multithreading or any optimization you wish. The communication between frontend and backend is handled transparently by the framework, so you don't have to take care of it. When you run Dash locally a local server is created so the data stays on your computer and there is no issue with data transfer/privacy. If we want to move it to a server at a later stage, then you are right about the fact that data needs to be transferred to a server (although there might be solutions that allow you to still run the computation on the local browser, like WebAssembly (https://webassembly.org/), but I think it is too complex to look into this at this stage). Regarding safety and privacy, the data will be stored on the server only for the time that the user is using the app and then deleted (of course we will need to make a disclaimer on the website about this). Regarding space I don't think people at the beginning will load their 1Tb dataset on the webapp but rather look at some small dataset of few tens of Gb; in that case 1Tb of server space is more than enough (remember that the file will be stored only for the time the user is using the app). If people really start to use the webapp and space becomes a limitation, I would be super happy to look into WebAssembly so that the data can be handled locally from the browser without transferring it to the server. To summarize I would agree that, at this stage, there might be no advantage of a webapp over a local GUI (and might actually be a bit more work to develop it). But, if this project really flies, the potential of a webapp is huge, especially in the context of the BioBrillouin society where we want to have a database of spectral data and the webapp could be used to explore that without downloading anything on your computer. My main point is that moving now to a webapp would not be too much work, but if we want to do it at a later stage it will basically entail re-writing everything from scratch. Let me know what are your thoughts about it. Best, Carlo On Wed, Feb 19, 2025 at 08:51, Pierre Bouvet wrote: Hi Carlo, You’re right, the format is still a little fuzzy. The main idea is to have a data-based hierarchy for storage: each data is stored in an individual group. From there, abscissa dependent on the data are stored in the same group and the treated data are stored in sub-groups. The names of the groups and sub-groups are fixed (Data_i), as is the name of the raw data (Raw_data) and abscissa (Abscissa_i). Also, the measure and spectrometer-dependent arguments have a defined nomenclature. To differentiate groups between them, we preferably attribute them a name as an attribute that is not used as an identifier, the identifier being either the path to the data/group from file root (Data_0/Data_42/Data_2/Raw_data) or potentially a hash value (not implemented). This I think allows all possible configurations, and using an hierarchical approach we can also pass common attributes and arrays (parameters of the spectrometer or abscissa arrays for example) on parent to reduce memory complexity. Now regarding the use of server-based GUI, first off, I’ve never used them so I’m just making supposition here but if the platform is able to treat data online, it will have to store the spectra somewhere in memory and it will not be local. My primary concerns with this approach is safety, particularly in terms of intellectual property protection, ethical considerations, and potential security vulnerabilities. Additionally, managing storage space will be a headache. Now, this doesn’t mean that we can’t have a server-based data plotter, or a server-based interface that does treatments locally but I don’t really see the benefits of this over a local software that can have multiple windows, which could at one point be multithreaded, and that could wrap c code to speed regressions for example (some of this might apply to Dash, I’m not super familiar with it). Now regarding memory complexity, having all the data we treat go on a server is a bad idea as it will raise the question of cost which will very rapidly become a real problem. Just an example: for a 100x100 map, I need 10Gb of memory (1Mo/point) with my setup (1To of archive storage is approximately 1euro/month) so this would get out of hands super fast assuming people use it. Now maybe there are solutions I don’t see for these problems and someone can take care of them but for me it’s just not worth the effort when having a local GUI solves all of these issues at once. But if you find a solution, then I’ll be happy to migrate to Dash, it won’t be fast to translate every feature but I can totally join you on the platform. Best, Pierre Pierre Bouvet, PhD Post-doctoral Fellow Medical University Vienna Department of Anatomy and Cell Biology Wahringer Straße 13, 1090 Wien, Austria On 18/2/25, at 20:26, Carlo Bevilacqua wrote: Hi Pierre, regarding the structure of the file, I agree that we should keep it simple. I am not suggesting to make it more complex, rather to have a document where we define it in a clear and structured way rather than as a general description, to make sure that we are all on the same page. I am saying this because, to be honest, I am not sure I fully understand how you are structuring the HDF5 and I think it is important to agree on this now, rather than finding at a later stage that we had different ideas. Ideally if the GUI should be part of a single application, we should write it using a unified framework. The reasons why, after considering it for a bit, I lean towards Dash rather than Qt are: * it can run in a web browser so it will be easy to eventually move it to a website, thus people can use it without installing it (which will hopefully help in promoting its use) * it is based on plotly (https://plotly.com/python/) which is a graphical library with very good plotting capabilites and highly customizable, that would make the data visualization easier/more appealing Let me know what you think about it and if you see any advantage of Qt over a web app which I am not considering. Also, if we agree that Dash might be a better option, would you consider migrating to Dash? It might not be too much work if most of the code you wrote is for data processing rather that for the GUI itself and I could help you with that. Alternatively one workaround is to have a QtWebEngine (https://doc.qt.io/qtforpython-6/overviews/qtwebengine-overview.html) in your Qt app and have the Dash app run inside that, but that would make only the Dash part portable to a server later on. Best, Carlo On Tue, Feb 18, 2025 at 10:24, Pierre Bouvet wrote: Hi, Thanks, More than merge them later, just keep them separate in the process and rather than trying to build "one code to do it all", build one library and GUI that encapsulate codes to do everything. Having a structure is a must but it needs to be kept as simple as possible else we’ll rapidly find situations where we need to change the structure. The middle ground I think is to force the use of hierarchies and impose nomenclatures where problem are expected to appear: each dataset has its own group, each group can encapsulate other groups, each parameter of a group applies to all its sub-groups if the subgroup does not change its value, each array of a group applies to all of its sub-groups if the sub-group does not redefine an array with same name, the names of the groups are held as parameters and their ID are managed by the software. For the Plotly interface, I don’t know how to integrate it to Qt but if you find a way to do it, that’s perfect with me :) My vision of the GUI is something that unifies the format and can then execute scripts on the data stored in this format. I have pushed the application of the GUI to my data up to the point where I can do the whole information extraction process from it (add data, convert to PSD, fit curves). I think this could be super interesting if we implement it for all techniques. I think we could formalize the project in milestones, in particular define the minimal denominator that will allow us to have the paper. The milestone I reached for my spectro encompasses the following points: - Being able to add data to the file easily (by dragging & dropping to the GUI) - Being able to assign properties to these data easily (again by dragging & dropping) - Being able to structure the added data in groups/folders/containers/however we want to call it - Making it easy for new data types to be loaded - Allowing data from same type but different structure to be added (e.g. .dat files) - Execute scripts on the data easily and allowing parameters of these scripts to be defined from the GUI (e.g. select a peak on a curve to fit this peak) - Make it easy to add scripts for treating or extracting PSD from raw data. - Allow the export of a Python code to access the data from the file (we cans see them as “break points” in the treatment pipeline) - Edit of properties inside the GUI In any case I think we could build a spec sheet for the project with what we want to have in it based on what we want to advertise in the paper. We can always add things later on but if we agree on a strict minimum to have the project advertised, then that will set its first milestone on which we’ll be able to build later on. Best, Pierre Pierre Bouvet, PhD Post-doctoral Fellow Medical University Vienna Department of Anatomy and Cell Biology Wahringer Straße 13, 1090 Wien, Austria On 17/2/25, at 14:53, Carlo Bevilacqua via Software wrote: Hi Pierre, hi Sal, thanks for sharing your thoughts about it. @Pierre I am very sorry that Ren passed away :( As far as I understood you are suggesting to work on the individual aspects separately and then merge them together at a later stage? I am fine with that but I still think it is very important to now agree on what should be in the file format we are defining, because that is kind of the core of the project and will affect a lot of the design choices. I am happy to start working on the GUI for data visualization. In my idea, it will be something similar to this (https://www.nature.com/articles/s41592-023-02054-z/figures/10) but written in dash (https://dash.plotly.com/), so it is a web app that for now can run locally (so no transfer of data to an external server is required) but in the future can easily be uploaded to a website that people can just use without installing anything on their computer. The question is how much of the data processing should be possible to do (or trigger) from the same GUI? I think at least a drop down menu with different fitting functions should be there, so the user can quickly check the results on a spectrum from a specific point in the image. @Pierre how are you envisioning the GUI you are working on? As far as I understood it is mainly to get the raw data and save it to our HDF5 format with some treatment on it. One idea could be to have a shared list of features that we are implementing in the GUI as we work on it, to avoid having the same functionality duplicated (or worst inconsistent) between the GUI for generating our file format and the GUI for visualization. Let me know what you think about it. Best, Carlo On Mon, Feb 17, 2025 at 11:04, Pierre Bouvet via Software wrote: Hi everyone, Sorry for the delayed response, I just went through the loss of Ren (my dog) and wasn’t at all able to answer. First of, Sal, I am making progress and I should have everything you have made on your branch integrated to the GUI branch soon, at which point I will push everything to main. Regarding the project, I think I align with Sal: keep things as simple as possible. My approach was to divide everything in 3 mostly independent layers: - Store data in an organized file that anyone can use, and make it easy to do - Convert these data into something that has physical significance: a Power Spectrum Density - Extract information from this Power Spectrum Density Each layer has its own challenge but they are independent on the challenge of having people using it: personally, if I had someone come to me with a new software to play with my measures, I would most likely only look at it for 1 minute (or less depending who made it) with a lot of apprehension and then based on how simple it looks and how much I understood of it, use it or - what is most likely - discard it. This is why Project.pdf (https://github.com/bio-brillouin/HDF5_BLS/blob/GUI_development/guides/Projec...) is essentially meant to say: we put data arrays in groups and give them attributes written in text, but you can also create groups within groups to organize your data! I believe most of the people in the BioBrillouin society will have the same approach and before having something complex that can do a lot, I think it’s best to have something simple that can just unify the format (which in itself is a lot) and that people can use right away with a minimal impact on their own individual pipelines for data processing. To be honest, I don’t think people will blindly trust our software at first to treat their data, but they will most likely use it at first to organize their raw spectra, and maybe add their own treated data if they are feeling particularly adventurous. But that is not a problem as long as we start a movement. From there yes, we can complexity and create custom file architectures but that is already too complex I think for this first project. If we can all just import our data to the wrapper and specify their attributes, this will already be a success. Then for the paper, if we can all add a custom code to treat these data to obtain a PSD, I think this will be enough. As I said, the current API already allows you to add your data in a variety of format, so it’s just a question of developing the PSD conversion before having something we can publish (and then tell people to use). A few extra points: - Working with my setup, I realized if the user could choose between different algorithms to treat their own data, it would make the overall project much more usable (if an algorithm bugs for whatever reason, you can use another one) so I created 2 bottle necks in the form of functions (for PSD conversion and treatment) that would inspect modules dedicated to either PSD conversion or treatment, and list existing functions. It’s in between classical and modular programming but it makes the development of new PSD conversion code and treatment way way easier - The GUI is developed using oriented-object programming. Therefore I have already made some low-level choices that kind of impact all the GUI. I’m not saying they are the best choices, I’m just saying that they work, so if you want to work on the GUI, I would either recommend getting familiar with these choices, or making sure that all the functionalities are preserved, particularly the ones that are invisible (logging of treatment steps, treatment errors…) I’ll try merging the branches on Git asap and will definitely send you all an email when it’s done :) Best, Pierre Pierre Bouvet, PhD Post-doctoral Fellow Medical University Vienna Department of Anatomy and Cell Biology Wahringer Straße 13, 1090 Wien, Austria On 14/2/25, at 19:36, Sal La Cavera Iii via Software wrote: Hi all, I agree with the things enumerated and points made by Kareem/Carlo! I guess I would advocate for starting from a position of simplicity. We probably don't want to get weighed down by trying to include a bunch of bells and whistles from the start as these can be easily added once there is a minimally viable stable product. As long as data can be loaded to local memory, then treated in various (initially simple) ways through the GUI (and maybe maintain non-GUI compatibility for command-line warriors like myself), then the bh5 formatting stuff can be sorted on the back end? I definitely agree with Carlo's structure set out in the file format document; but all of that data will be floating around the memory in some shape or form and just needs to be wrapped up and packaged (according to Carlo's structure e.g.) when the user is happy and presses the "generate h5 filestore" etc. (?) Definitely agree with the recommendation to create the alpha using mainly requirements that our 3 labs would find useful (import filetypes, treatments, etc), and then we can add on more universal functionality second / get some beta testers in from other labs etc. I'm able to support on whatever jobs need doing and am free to meet in the beginning of March like you mentioned Kareem. Hope you guys have a nice weekend, Cheers, Sal ---------------------------------------------------------------Salvatore La Cavera IIIRoyal Academy of Engineering Research FellowNottingham Research FellowOptics and Photonics GroupUniversity of Nottingham Email: salvatore.lacaveraiii@nottingham.ac.uk (mailto:salvatore.lacaveraiii@nottingham.ac.uk) ORCID iD: 0000-0003-0210-3102 (https://outlook.office.com/bookwithme/user/6a3f960a8e89429cb6fc693c01d10119@...) Book a Coffee and Research chat with me! ------------------------------------ From: Carlo Bevilacqua via Software Sent: 12 February 2025 13:31 To: Kareem Elsayad Cc: sebastian.hambura@embl.de (mailto:sebastian.hambura@embl.de) ; software@biobrillouin.org (mailto:software@biobrillouin.org) Subject: [Software] Re: Software manuscript / BLS microscopy You don't often get email from software@biobrillouin.org (mailto:software@biobrillouin.org). Learn why this is important (https://aka.ms/LearnAboutSenderIdentification) Hi Kareem, thanks for restarting this and sorry for my silence, I just came back from US and was planning to start working on this again. Could you also add Sebastian (in CC) to the mailing list? As you outlined, I would split the project into two parts: 1) getting from the raw data to some standard "processed' spectra and 2) do data analysis/visualization on that. For the second part the way I envision it is: * the most updated definition of the file format from Pierre is this one (https://github.com/bio-brillouin/HDF5_BLS/blob/GUI_development/guides/Projec...), correct? In addition to this document I think it would be good to have a more structured description of the file (like this (https://github.com/prevedel-lab/Brillouin-standard-file/blob/main/docs/Bh5_f...)), where each field is clearly defined in terms of data type and dimensions. Sebastian was also suggesting that the document should contain the reasoning behind each specific choice in the specs and also things that we considered but decided had some issues (so in future we can look back at it). I still believe that the file format should contain the "processed" spectra (i.e. after FT and baseline subtraction for impulsive, or after taking a line profile and possibly linearization with VIPA,...) so we can apply standard data processing or visualization which is independent on the actual underlaying technique (e.g. VIPA, FP, stimulated, time domain, ...) * agree on an API to read the data from our file format (most likely a Python class). For that we should: 1) decide on which information is important to extract (spectral information, spatial coordinates, hyper-parameters, metadata,...) 2) implement an interface to read the data (e.g. readSpectrumAtIndex(...), readImage(...), ...) * build a GUI that use the previously defined API to show and process the data. I would say that, once we have a very solid description of the file format as in step 1, step 2 will come naturally and we can divide the actual implementation between us. Step 3 can also easily be implemented and divided between us once we have an API (and I am happy to work on the GUI myself). The first half of the project is the trickiest and I know Pierre has already done a lot of work in that direction. We should definitely agree on which extent we can define a standard to store the raw data, given the variability between labs, (and probably we should do it for common techniques like FP or VIPA) and how to implement the treatments, leaving to possibility to load some custom code in the pipeline to do the conversion. Let me know what you all think about this. If you agree I would start by making a document which clearly defines the file format in a structured way (as in my step 1 before). @Pierre could you write a new document or modify the document I originally made (https://github.com/prevedel-lab/Brillouin-standard-file/blob/main/docs/Bh5_f...) to reflect the latest structure you implemented for the file format? The metadata can still be defined in a separated excel sheet, as long as the data type and format is well defined there. Best regards, Carlo On Wed, Feb 12, 2025 at 02:19, Kareem Elsayad via Software wrote: Hi Robert, Carlo, Sal, Pierre, Think it would be good to follow up on software project. Pierre has made some progress here and would be good to try and define tasks a little bit clearer to make progress… There is always the potential issue of having “too many cooks in the kitchen” (that have different recipes for same thing) to move forward efficiently, something that I noticed can get quite confusing/frustrating when writing software together with people. So would be good to clearly assign tasks. I talked to Pierre today and he would be happy to integrate things in framework we have to try tie things together. What would foremost be needed would be ways of treating data, meaning code that takes a raw spectral image and meta-data and converts it into “standard” format (spectral representation) that can then be fitted. Then also “plugins” that serve a specific purpose in the analysis/rendering that can be included in framework. The way I see it (and please comment if you see differently), there are ~4 steps here: * Take raw data (in .tif,, .dat, txt, etc. format) and meta data (in .cvs, xlsx, .dat, .txt, etc.) and render a standard spectral presentation. Also take provided instrument response in one of these formats and extract key parameters from this * Fit the data with drop-down menu list of functions, that will include different functional dependences and functions corrected for instrument response. * Generate/display a visual representation of results (frequency shift(s) and linewidth(s)), that is ideally interactive to some extent (and maybe has some funky features like looking at spectra at different points. These can be spatial maps and/or evolution with some other parameter (time, temperature, angle, etc.). Also be able to display maps of relative peak intensities in case of multiple peak fits, and whatever else useful you can think of. * Extract “mechanical” parameters given assigned refractive indices and densities I think the idea of fitting modified functions (e.g. corrected based on instrument response) vs. deconvolving spectra makes more sense (as can account for more complex corrections due to non-optical anomalies in future –ultimately even functional variations in vicinity of e.g. phase transitions). It is also less error prone, as systematically doing decon with non-ideal registration data can really throw you off the cliff, so to speak. My understanding is that we kind of agreed on initial meta-data reporting format. Getting from 1 to 2 will no doubt be most challenging as it is very instrument specific. So instructions will need to be written for different BLS implementations. This is a huge project if we want it to be all inclusive.. so I would suggest to focus on making it work for just a couple of modalities first would be good (e.g. crossed VIPA, time-resolved, anisotropy, and maybe some time or temperature course of one of these). Extensions should then be more easy to navigate. At one point think would be good to involve SBS specific considerations also. Think would be good to discuss a while per email to gather thoughts and opinions (and already start to share codes), and then plan a meeting beginning of March -- how does first week of March look for everyone? I created this mailing list (software@biobrillouin.org (mailto:software@biobrillouin.org)) we can use for discussion. You should all be able to post to (and it makes it easier if we bring anyone else in along the way). At moment on this mailing list is Robert, Carlo, Sal, Pierre and myself. Let me know if I should add anyone. All the best, Kareem This message and any attachment are intended solely for the addressee and may contain confidential information. If you have received this message in error, please contact the sender and delete the email and attachment. Any views or opinions expressed by the author of this email do not necessarily reflect the views of the University of Nottingham. Email communications with the University of Nottingham may be monitored where permitted by law. _______________________________________________ Software mailing list -- software@biobrillouin.org (mailto:software@biobrillouin.org) To unsubscribe send an email to software-leave@biobrillouin.org (mailto:software-leave@biobrillouin.org) _______________________________________________ Software mailing list -- software@biobrillouin.org (mailto:software@biobrillouin.org) To unsubscribe send an email to software-leave@biobrillouin.org (mailto:software-leave@biobrillouin.org)
Dear All, (and I guess especially Carlo & Pierre 😊) I understand both your (main) points concerning what this all should be, and I think this is actually perfect for dividing tasks. The format of the hf or bh5 file being where things meet and what needs to be agreed on. The thing with raw data is ofcourse that it is variable between instruments and labs, and the conversion to “standard spectra” that can then be fitted etc. is going to be unique (maybe even between experiments in same project). That said, asking people to create some complex file from their data that works with a developed software is also unlikely to get a following. So (the way I see it) there are basically two parts. Getting from raw data to h5 (or bh5) format which contains the spectra in standard format. And then the whole analysis part and visualization (GUI, pretty features, etc.). While the latter may get the spotlight, it obviously relies heavily on the former being done right. Given that there are numerous “standard” BLS setup implementations the development of software for getting from raw data to h5 I think makes sense, since the h5 will no doubt be cryptic, and creating a working h5 is not something everyone will want to program by themselves (it is not an insignificant step given we are also trying to ultimately cater to biologists). As such a software that generates the h5 files, with drag and drop features and entering system parameters, for different setups makes sense and will save many labs a headache if they don’t have a good programmer on hand. So I would suggest that Pierre & Sal lead the work on developing this, while Carlo & Sebastian lead the work on developing the analysis/interface-presentation part. This way things are nicely divided and we just need to agree on the h5 file that is transferred between the two. From the side of Pierre & Sal there could maybe also be a second h5 generated that contains all the raw data and details on how it was converted to the transferred h5 file (for complete transparency this could then also be reported in papers if people wish). These could exist as two separate programs with respective GUIs but also eventually combined to a single one. How does this sound to everyone? To clear up details and try assign tasks going forward how about a Zoom first week of March (I would be free Monday 3rd and Tue 4th after 1pm)? All the best, Kareem From: Carlo Bevilacqua via Software <software@biobrillouin.org> Reply to: Carlo Bevilacqua <carlo.bevilacqua@embl.de> Date: Wednesday, 19. February 2025 at 20:43 To: Pierre Bouvet <pierre.bouvet@meduniwien.ac.at> Cc: <software@biobrillouin.org> Subject: [Software] Re: [EXTERN] Re: Software manuscript / BLS microscopy Hi Pierre, I realized that we might have slightly different aims. For me the most important part of this project is to have a unified file format that can be read and visualized by a standard software. The file format you are proposing is not sufficient for that in my opinion. For example one of my main motivation was to have an interface where the user can see the reconstructed image, click on a pixel, see the corresponding spectrum to check its quality and maybe try different fitting functions; that would already not be possible with your structure because the software would have no notion on where the spectral data is stored and how to associate it to a specific pixel. I don't see the structure of the file to be too complex as an issue, as long as it is functional: we can always provide an API and/or a GUI that allow people to take their spectra and save them in whatever format we decide without bothering about understanding the actual structure, the same way you can work with HDF5 file without having any understanding on how the data is actually stored on the disk. My idea of making a webapp as a GUI follows directly from there. Typical case: I sent some data to a collaborator and they can just run the app in their browser and check if the outliers they see in the image are real or a bad spectra. Similarly if we make a common database of Brillouin spectra, people can explore it easily using the webapp. From what I understood, you are instead more interested in going from raw data to an actual spectrum, which I don't see so much as a priority because each lab has their own code already and the actual procedure would be different for each lab (apart from standard instruments like the FP). I am not saying this should not be part of the software but not as a priority and rather has a layer where people can easily implement their own code (of course we could already implement code for standard instruments). I think it would be good to cleary define what is our common aim now, so we are sure we are working in the same direction. Let me know if you agree or I misunderstood what is your idea. Best, Carlo On Wed, Feb 19, 2025 at 16:11, Pierre Bouvet <pierre.bouvet@meduniwien.ac.at> wrote: Hi, I think you're trying to go too far too fast. The approach I present here is intentionally simple, so that people can very quickly get to storing their data in a HDF5 file format together with the parameters they used to acquire them with minimal effort. The closest to what you did is therefore as follows: - data are datasets with no other restriction and they are stored in groups - each group can have a set of attribute proper to the data they are storing - attributes have a nomenclature imposed by a spreadsheet and are in the form of text - the default name of a data is the name of a raw data: “Raw_data”, other arrays can have whatever name they want (Shift_5GHz, Frequency, ...) - arrays and attributes are hierarchical, so they apply to their groups and all groups under it. This is the bare minimum to meet our needs, so we need to stop here in the definition of the format since it’s already enough to have the GUI working correctly, and therefore the first version of the unified software advertised. Of course we will have to refine things later on, but we don’t want to scare people off by presenting them a file description that for one might not match their measurements and that is extremely hard to conceptually understand. To make my point clearer, take your definition of the format for example: there are 3 different amplitude arrays in your description, two different shift arrays and width arrays that are of different dimension, then we have a calibration group on one side but a spectrometer characterization array in another group that is called “experiment_info”, that’s just too complicated to use correctly. On the other hand, placing your raw data “as is” in a group dedicated to this data is conceptually easy and straightforward. Where you are right, is that should we have hundreds of people using it, we might in a near future want to store abscissa, impulse responses, … in a standardized manner. In that case, the question falls down to either adding sub-groups or storing the data together with the measure. Both are fine and don’t really pose a problem for now, essentially because we are not trying to visualize the results but just trying to unify the way to get them. Now regarding Dash, if I understand correctly, it’s just a way to change the frontend you propose? If that’s so, why not, but then I don’t really see the benefits: if you really want to use dash, you can always embed it inside a Qt app. Also Dash being browser based, you will only have one window for the whole interface, which will be a pain to deal with if you want to use the interface to do everything the GUI is expected to do (inspect an H5 file, convert PSD, treat data, edit parameters, inspect a failed treatment, simulate results using setups with slight changes of parameters…). We agree that at one point when people receive an h5 file, it will be useful to have a web interface that can do what yours or Sal’s GUI do (seeing the mapping results together with the spectrum, eventually the time-domain signal) but here again, it’s going too far too soon: let’s first have a simple and reliable GUI that can convert data from any spectrometer to PSDs and treat them with a unified code. This is the real challenge, visualization and nomenclature of results are both important but secondary. Also keep in mind that, the frontend can easily be generated by anyone really, with Copilot or ChatGPT or whatever AI, but you can’t ask them to develop the function that will correctly read your data and convert them to a PSD nor treat the PSD. This is done on the backend and is the priority since the unification essentially happens there. Best, Pierre Pierre Bouvet, PhD Post-doctoral Fellow Medical University Vienna Department of Anatomy and Cell Biology Wahringer Straße 13, 1090 Wien, Austria On 19/2/25, at 13:21, Carlo Bevilacqua <carlo.bevilacqua@embl.de> wrote: Hi Pierre, thanks for your reply. Regarding the file structure, what I am still not very clear about is what you define as Raw_data and data, how the actual spectra are stored and how the association to spatial coordinates and parameters is made. That's why I would really appreciate if you could make a document similar to what I did, where it is clear what each group should (or can) contain, what is the shape of each dataset, which attributes they have, etc... I am not saying that this should be the final structure of the file but I strongly believe that having it written in a structured way helps defining it and seeing potential issues. Regarding the webapp, it works by separating the frontend, which run in the browser and is responsible of running the GUI, and the backend which is doing the actual computation and that you can structure as you like with multithreading or any optimization you wish. The communication between frontend and backend is handled transparently by the framework, so you don't have to take care of it. When you run Dash locally a local server is created so the data stays on your computer and there is no issue with data transfer/privacy. If we want to move it to a server at a later stage, then you are right about the fact that data needs to be transferred to a server (although there might be solutions that allow you to still run the computation on the local browser, like WebAssembly, but I think it is too complex to look into this at this stage). Regarding safety and privacy, the data will be stored on the server only for the time that the user is using the app and then deleted (of course we will need to make a disclaimer on the website about this). Regarding space I don't think people at the beginning will load their 1Tb dataset on the webapp but rather look at some small dataset of few tens of Gb; in that case 1Tb of server space is more than enough (remember that the file will be stored only for the time the user is using the app). If people really start to use the webapp and space becomes a limitation, I would be super happy to look into WebAssembly so that the data can be handled locally from the browser without transferring it to the server. To summarize I would agree that, at this stage, there might be no advantage of a webapp over a local GUI (and might actually be a bit more work to develop it). But, if this project really flies, the potential of a webapp is huge, especially in the context of the BioBrillouin society where we want to have a database of spectral data and the webapp could be used to explore that without downloading anything on your computer. My main point is that moving now to a webapp would not be too much work, but if we want to do it at a later stage it will basically entail re-writing everything from scratch. Let me know what are your thoughts about it. Best, Carlo On Wed, Feb 19, 2025 at 08:51, Pierre Bouvet <pierre.bouvet@meduniwien.ac.at> wrote: Hi Carlo, You’re right, the format is still a little fuzzy. The main idea is to have a data-based hierarchy for storage: each data is stored in an individual group. From there, abscissa dependent on the data are stored in the same group and the treated data are stored in sub-groups. The names of the groups and sub-groups are fixed (Data_i), as is the name of the raw data (Raw_data) and abscissa (Abscissa_i). Also, the measure and spectrometer-dependent arguments have a defined nomenclature. To differentiate groups between them, we preferably attribute them a name as an attribute that is not used as an identifier, the identifier being either the path to the data/group from file root (Data_0/Data_42/Data_2/Raw_data) or potentially a hash value (not implemented). This I think allows all possible configurations, and using an hierarchical approach we can also pass common attributes and arrays (parameters of the spectrometer or abscissa arrays for example) on parent to reduce memory complexity. Now regarding the use of server-based GUI, first off, I’ve never used them so I’m just making supposition here but if the platform is able to treat data online, it will have to store the spectra somewhere in memory and it will not be local. My primary concerns with this approach is safety, particularly in terms of intellectual property protection, ethical considerations, and potential security vulnerabilities. Additionally, managing storage space will be a headache. Now, this doesn’t mean that we can’t have a server-based data plotter, or a server-based interface that does treatments locally but I don’t really see the benefits of this over a local software that can have multiple windows, which could at one point be multithreaded, and that could wrap c code to speed regressions for example (some of this might apply to Dash, I’m not super familiar with it). Now regarding memory complexity, having all the data we treat go on a server is a bad idea as it will raise the question of cost which will very rapidly become a real problem. Just an example: for a 100x100 map, I need 10Gb of memory (1Mo/point) with my setup (1To of archive storage is approximately 1euro/month) so this would get out of hands super fast assuming people use it. Now maybe there are solutions I don’t see for these problems and someone can take care of them but for me it’s just not worth the effort when having a local GUI solves all of these issues at once. But if you find a solution, then I’ll be happy to migrate to Dash, it won’t be fast to translate every feature but I can totally join you on the platform. Best, Pierre Pierre Bouvet, PhD Post-doctoral Fellow Medical University Vienna Department of Anatomy and Cell Biology Wahringer Straße 13, 1090 Wien, Austria On 18/2/25, at 20:26, Carlo Bevilacqua <carlo.bevilacqua@embl.de> wrote: Hi Pierre, regarding the structure of the file, I agree that we should keep it simple. I am not suggesting to make it more complex, rather to have a document where we define it in a clear and structured way rather than as a general description, to make sure that we are all on the same page. I am saying this because, to be honest, I am not sure I fully understand how you are structuring the HDF5 and I think it is important to agree on this now, rather than finding at a later stage that we had different ideas. Ideally if the GUI should be part of a single application, we should write it using a unified framework. The reasons why, after considering it for a bit, I lean towards Dash rather than Qt are: it can run in a web browser so it will be easy to eventually move it to a website, thus people can use it without installing it (which will hopefully help in promoting its use) it is based on plotly which is a graphical library with very good plotting capabilites and highly customizable, that would make the data visualization easier/more appealing Let me know what you think about it and if you see any advantage of Qt over a web app which I am not considering. Also, if we agree that Dash might be a better option, would you consider migrating to Dash? It might not be too much work if most of the code you wrote is for data processing rather that for the GUI itself and I could help you with that. Alternatively one workaround is to have a QtWebEngine in your Qt app and have the Dash app run inside that, but that would make only the Dash part portable to a server later on. Best, Carlo On Tue, Feb 18, 2025 at 10:24, Pierre Bouvet <pierre.bouvet@meduniwien.ac.at> wrote: Hi, Thanks, More than merge them later, just keep them separate in the process and rather than trying to build "one code to do it all", build one library and GUI that encapsulate codes to do everything. Having a structure is a must but it needs to be kept as simple as possible else we’ll rapidly find situations where we need to change the structure. The middle ground I think is to force the use of hierarchies and impose nomenclatures where problem are expected to appear: each dataset has its own group, each group can encapsulate other groups, each parameter of a group applies to all its sub-groups if the subgroup does not change its value, each array of a group applies to all of its sub-groups if the sub-group does not redefine an array with same name, the names of the groups are held as parameters and their ID are managed by the software. For the Plotly interface, I don’t know how to integrate it to Qt but if you find a way to do it, that’s perfect with me :) My vision of the GUI is something that unifies the format and can then execute scripts on the data stored in this format. I have pushed the application of the GUI to my data up to the point where I can do the whole information extraction process from it (add data, convert to PSD, fit curves). I think this could be super interesting if we implement it for all techniques. I think we could formalize the project in milestones, in particular define the minimal denominator that will allow us to have the paper. The milestone I reached for my spectro encompasses the following points: - Being able to add data to the file easily (by dragging & dropping to the GUI) - Being able to assign properties to these data easily (again by dragging & dropping) - Being able to structure the added data in groups/folders/containers/however we want to call it - Making it easy for new data types to be loaded - Allowing data from same type but different structure to be added (e.g. .dat files) - Execute scripts on the data easily and allowing parameters of these scripts to be defined from the GUI (e.g. select a peak on a curve to fit this peak) - Make it easy to add scripts for treating or extracting PSD from raw data. - Allow the export of a Python code to access the data from the file (we cans see them as “break points” in the treatment pipeline) - Edit of properties inside the GUI In any case I think we could build a spec sheet for the project with what we want to have in it based on what we want to advertise in the paper. We can always add things later on but if we agree on a strict minimum to have the project advertised, then that will set its first milestone on which we’ll be able to build later on. Best, Pierre Pierre Bouvet, PhD Post-doctoral Fellow Medical University Vienna Department of Anatomy and Cell Biology Wahringer Straße 13, 1090 Wien, Austria On 17/2/25, at 14:53, Carlo Bevilacqua via Software <software@biobrillouin.org> wrote: Hi Pierre, hi Sal, thanks for sharing your thoughts about it. @Pierre I am very sorry that Ren passed away :( As far as I understood you are suggesting to work on the individual aspects separately and then merge them together at a later stage? I am fine with that but I still think it is very important to now agree on what should be in the file format we are defining, because that is kind of the core of the project and will affect a lot of the design choices. I am happy to start working on the GUI for data visualization. In my idea, it will be something similar to this but written in dash, so it is a web app that for now can run locally (so no transfer of data to an external server is required) but in the future can easily be uploaded to a website that people can just use without installing anything on their computer. The question is how much of the data processing should be possible to do (or trigger) from the same GUI? I think at least a drop down menu with different fitting functions should be there, so the user can quickly check the results on a spectrum from a specific point in the image. @Pierre how are you envisioning the GUI you are working on? As far as I understood it is mainly to get the raw data and save it to our HDF5 format with some treatment on it. One idea could be to have a shared list of features that we are implementing in the GUI as we work on it, to avoid having the same functionality duplicated (or worst inconsistent) between the GUI for generating our file format and the GUI for visualization. Let me know what you think about it. Best, Carlo On Mon, Feb 17, 2025 at 11:04, Pierre Bouvet via Software <software@biobrillouin.org> wrote: Hi everyone, Sorry for the delayed response, I just went through the loss of Ren (my dog) and wasn’t at all able to answer. First of, Sal, I am making progress and I should have everything you have made on your branch integrated to the GUI branch soon, at which point I will push everything to main. Regarding the project, I think I align with Sal: keep things as simple as possible. My approach was to divide everything in 3 mostly independent layers: - Store data in an organized file that anyone can use, and make it easy to do - Convert these data into something that has physical significance: a Power Spectrum Density - Extract information from this Power Spectrum Density Each layer has its own challenge but they are independent on the challenge of having people using it: personally, if I had someone come to me with a new software to play with my measures, I would most likely only look at it for 1 minute (or less depending who made it) with a lot of apprehension and then based on how simple it looks and how much I understood of it, use it or - what is most likely - discard it. This is why Project.pdf is essentially meant to say: we put data arrays in groups and give them attributes written in text, but you can also create groups within groups to organize your data! I believe most of the people in the BioBrillouin society will have the same approach and before having something complex that can do a lot, I think it’s best to have something simple that can just unify the format (which in itself is a lot) and that people can use right away with a minimal impact on their own individual pipelines for data processing. To be honest, I don’t think people will blindly trust our software at first to treat their data, but they will most likely use it at first to organize their raw spectra, and maybe add their own treated data if they are feeling particularly adventurous. But that is not a problem as long as we start a movement. From there yes, we can complexity and create custom file architectures but that is already too complex I think for this first project. If we can all just import our data to the wrapper and specify their attributes, this will already be a success. Then for the paper, if we can all add a custom code to treat these data to obtain a PSD, I think this will be enough. As I said, the current API already allows you to add your data in a variety of format, so it’s just a question of developing the PSD conversion before having something we can publish (and then tell people to use). A few extra points: - Working with my setup, I realized if the user could choose between different algorithms to treat their own data, it would make the overall project much more usable (if an algorithm bugs for whatever reason, you can use another one) so I created 2 bottle necks in the form of functions (for PSD conversion and treatment) that would inspect modules dedicated to either PSD conversion or treatment, and list existing functions. It’s in between classical and modular programming but it makes the development of new PSD conversion code and treatment way way easier - The GUI is developed using oriented-object programming. Therefore I have already made some low-level choices that kind of impact all the GUI. I’m not saying they are the best choices, I’m just saying that they work, so if you want to work on the GUI, I would either recommend getting familiar with these choices, or making sure that all the functionalities are preserved, particularly the ones that are invisible (logging of treatment steps, treatment errors…) I’ll try merging the branches on Git asap and will definitely send you all an email when it’s done :) Best, Pierre Pierre Bouvet, PhD Post-doctoral Fellow Medical University Vienna Department of Anatomy and Cell Biology Wahringer Straße 13, 1090 Wien, Austria On 14/2/25, at 19:36, Sal La Cavera Iii via Software <software@biobrillouin.org> wrote: Hi all, I agree with the things enumerated and points made by Kareem/Carlo! I guess I would advocate for starting from a position of simplicity. We probably don't want to get weighed down by trying to include a bunch of bells and whistles from the start as these can be easily added once there is a minimally viable stable product. As long as data can be loaded to local memory, then treated in various (initially simple) ways through the GUI (and maybe maintain non-GUI compatibility for command-line warriors like myself), then the bh5 formatting stuff can be sorted on the back end? I definitely agree with Carlo's structure set out in the file format document; but all of that data will be floating around the memory in some shape or form and just needs to be wrapped up and packaged (according to Carlo's structure e.g.) when the user is happy and presses the "generate h5 filestore" etc. (?) Definitely agree with the recommendation to create the alpha using mainly requirements that our 3 labs would find useful (import filetypes, treatments, etc), and then we can add on more universal functionality second / get some beta testers in from other labs etc. I'm able to support on whatever jobs need doing and am free to meet in the beginning of March like you mentioned Kareem. Hope you guys have a nice weekend, Cheers, Sal --------------------------------------------------------------- Salvatore La Cavera III Royal Academy of Engineering Research Fellow Nottingham Research Fellow Optics and Photonics Group University of Nottingham Email: salvatore.lacaveraiii@nottingham.ac.uk ORCID iD: 0000-0003-0210-3102 <Outlook-tygjxucs.png>Book a Coffee and Research chat with me! From: Carlo Bevilacqua via Software <software@biobrillouin.org> Sent: 12 February 2025 13:31 To: Kareem Elsayad <kareem.elsayad@meduniwien.ac.at> Cc: sebastian.hambura@embl.de <sebastian.hambura@embl.de>; software@biobrillouin.org <software@biobrillouin.org> Subject: [Software] Re: Software manuscript / BLS microscopy You don't often get email from software@biobrillouin.org. Learn why this is important Hi Kareem, thanks for restarting this and sorry for my silence, I just came back from US and was planning to start working on this again. Could you also add Sebastian (in CC) to the mailing list? As you outlined, I would split the project into two parts: 1) getting from the raw data to some standard "processed' spectra and 2) do data analysis/visualization on that. For the second part the way I envision it is: the most updated definition of the file format from Pierre is this one, correct? In addition to this document I think it would be good to have a more structured description of the file (like this), where each field is clearly defined in terms of data type and dimensions. Sebastian was also suggesting that the document should contain the reasoning behind each specific choice in the specs and also things that we considered but decided had some issues (so in future we can look back at it). I still believe that the file format should contain the "processed" spectra (i.e. after FT and baseline subtraction for impulsive, or after taking a line profile and possibly linearization with VIPA,...) so we can apply standard data processing or visualization which is independent on the actual underlaying technique (e.g. VIPA, FP, stimulated, time domain, ...) agree on an API to read the data from our file format (most likely a Python class). For that we should: 1) decide on which information is important to extract (spectral information, spatial coordinates, hyper-parameters, metadata,...) 2) implement an interface to read the data (e.g. readSpectrumAtIndex(...), readImage(...), ...) build a GUI that use the previously defined API to show and process the data. I would say that, once we have a very solid description of the file format as in step 1, step 2 will come naturally and we can divide the actual implementation between us. Step 3 can also easily be implemented and divided between us once we have an API (and I am happy to work on the GUI myself). The first half of the project is the trickiest and I know Pierre has already done a lot of work in that direction. We should definitely agree on which extent we can define a standard to store the raw data, given the variability between labs, (and probably we should do it for common techniques like FP or VIPA) and how to implement the treatments, leaving to possibility to load some custom code in the pipeline to do the conversion. Let me know what you all think about this. If you agree I would start by making a document which clearly defines the file format in a structured way (as in my step 1 before). @Pierre could you write a new document or modify the document I originally made to reflect the latest structure you implemented for the file format? The metadata can still be defined in a separated excel sheet, as long as the data type and format is well defined there. Best regards, Carlo On Wed, Feb 12, 2025 at 02:19, Kareem Elsayad via Software <software@biobrillouin.org> wrote: Hi Robert, Carlo, Sal, Pierre, Think it would be good to follow up on software project. Pierre has made some progress here and would be good to try and define tasks a little bit clearer to make progress… There is always the potential issue of having “too many cooks in the kitchen” (that have different recipes for same thing) to move forward efficiently, something that I noticed can get quite confusing/frustrating when writing software together with people. So would be good to clearly assign tasks. I talked to Pierre today and he would be happy to integrate things in framework we have to try tie things together. What would foremost be needed would be ways of treating data, meaning code that takes a raw spectral image and meta-data and converts it into “standard” format (spectral representation) that can then be fitted. Then also “plugins” that serve a specific purpose in the analysis/rendering that can be included in framework. The way I see it (and please comment if you see differently), there are ~4 steps here: Take raw data (in .tif,, .dat, txt, etc. format) and meta data (in .cvs, xlsx, .dat, .txt, etc.) and render a standard spectral presentation. Also take provided instrument response in one of these formats and extract key parameters from this Fit the data with drop-down menu list of functions, that will include different functional dependences and functions corrected for instrument response. Generate/display a visual representation of results (frequency shift(s) and linewidth(s)), that is ideally interactive to some extent (and maybe has some funky features like looking at spectra at different points. These can be spatial maps and/or evolution with some other parameter (time, temperature, angle, etc.). Also be able to display maps of relative peak intensities in case of multiple peak fits, and whatever else useful you can think of. Extract “mechanical” parameters given assigned refractive indices and densities I think the idea of fitting modified functions (e.g. corrected based on instrument response) vs. deconvolving spectra makes more sense (as can account for more complex corrections due to non-optical anomalies in future –ultimately even functional variations in vicinity of e.g. phase transitions). It is also less error prone, as systematically doing decon with non-ideal registration data can really throw you off the cliff, so to speak. My understanding is that we kind of agreed on initial meta-data reporting format. Getting from 1 to 2 will no doubt be most challenging as it is very instrument specific. So instructions will need to be written for different BLS implementations. This is a huge project if we want it to be all inclusive.. so I would suggest to focus on making it work for just a couple of modalities first would be good (e.g. crossed VIPA, time-resolved, anisotropy, and maybe some time or temperature course of one of these). Extensions should then be more easy to navigate. At one point think would be good to involve SBS specific considerations also. Think would be good to discuss a while per email to gather thoughts and opinions (and already start to share codes), and then plan a meeting beginning of March -- how does first week of March look for everyone? I created this mailing list (software@biobrillouin.org) we can use for discussion. You should all be able to post to (and it makes it easier if we bring anyone else in along the way). At moment on this mailing list is Robert, Carlo, Sal, Pierre and myself. Let me know if I should add anyone. All the best, Kareem This message and any attachment are intended solely for the addressee and may contain confidential information. If you have received this message in error, please contact the sender and delete the email and attachment. Any views or opinions expressed by the author of this email do not necessarily reflect the views of the University of Nottingham. Email communications with the University of Nottingham may be monitored where permitted by law. _______________________________________________ Software mailing list -- software@biobrillouin.org To unsubscribe send an email to software-leave@biobrillouin.org _______________________________________________ Software mailing list -- software@biobrillouin.org To unsubscribe send an email to software-leave@biobrillouin.org _______________________________________________ Software mailing list -- software@biobrillouin.org To unsubscribe send an email to software-leave@biobrillouin.org
Hi, Looks great to me :) Best, Pierre Pierre Bouvet, PhD Post-doctoral Fellow Medical University Vienna Department of Anatomy and Cell Biology Wahringer Straße 13, 1090 Wien, Austria
On 20/2/25, at 02:49, Kareem Elsayad via Software <software@biobrillouin.org> wrote:
Dear All, (and I guess especially Carlo & Pierre 😊)
I understand both your (main) points concerning what this all should be, and I think this is actually perfect for dividing tasks. The format of the hf or bh5 file being where things meet and what needs to be agreed on.
The thing with raw data is ofcourse that it is variable between instruments and labs, and the conversion to “standard spectra” that can then be fitted etc. is going to be unique (maybe even between experiments in same project). That said, asking people to create some complex file from their data that works with a developed software is also unlikely to get a following.
So (the way I see it) there are basically two parts. Getting from raw data to h5 (or bh5) format which contains the spectra in standard format. And then the whole analysis part and visualization (GUI, pretty features, etc.). While the latter may get the spotlight, it obviously relies heavily on the former being done right. Given that there are numerous “standard” BLS setup implementations the development of software for getting from raw data to h5 I think makes sense, since the h5 will no doubt be cryptic, and creating a working h5 is not something everyone will want to program by themselves (it is not an insignificant step given we are also trying to ultimately cater to biologists). As such a software that generates the h5 files, with drag and drop features and entering system parameters, for different setups makes sense and will save many labs a headache if they don’t have a good programmer on hand.
So I would suggest that Pierre & Sal lead the work on developing this, while Carlo & Sebastian lead the work on developing the analysis/interface-presentation part. This way things are nicely divided and we just need to agree on the h5 file that is transferred between the two. From the side of Pierre & Sal there could maybe also be a second h5 generated that contains all the raw data and details on how it was converted to the transferred h5 file (for complete transparency this could then also be reported in papers if people wish). These could exist as two separate programs with respective GUIs but also eventually combined to a single one. How does this sound to everyone?
To clear up details and try assign tasks going forward how about a Zoom first week of March (I would be free Monday 3rd and Tue 4th after 1pm)?
All the best, Kareem
From: Carlo Bevilacqua via Software <software@biobrillouin.org <mailto:software@biobrillouin.org>> Reply to: Carlo Bevilacqua <carlo.bevilacqua@embl.de <mailto:carlo.bevilacqua@embl.de>> Date: Wednesday, 19. February 2025 at 20:43 To: Pierre Bouvet <pierre.bouvet@meduniwien.ac.at> Cc: <software@biobrillouin.org> Subject: [Software] Re: [EXTERN] Re: Software manuscript / BLS microscopy
Hi Pierre,
I realized that we might have slightly different aims.
For me the most important part of this project is to have a unified file format that can be read and visualized by a standard software. The file format you are proposing is not sufficient for that in my opinion. For example one of my main motivation was to have an interface where the user can see the reconstructed image, click on a pixel, see the corresponding spectrum to check its quality and maybe try different fitting functions; that would already not be possible with your structure because the software would have no notion on where the spectral data is stored and how to associate it to a specific pixel. I don't see the structure of the file to be too complex as an issue, as long as it is functional: we can always provide an API and/or a GUI that allow people to take their spectra and save them in whatever format we decide without bothering about understanding the actual structure, the same way you can work with HDF5 file without having any understanding on how the data is actually stored on the disk.
My idea of making a webapp as a GUI follows directly from there. Typical case: I sent some data to a collaborator and they can just run the app in their browser and check if the outliers they see in the image are real or a bad spectra. Similarly if we make a common database of Brillouin spectra, people can explore it easily using the webapp.
From what I understood, you are instead more interested in going from raw data to an actual spectrum, which I don't see so much as a priority because each lab has their own code already and the actual procedure would be different for each lab (apart from standard instruments like the FP). I am not saying this should not be part of the software but not as a priority and rather has a layer where people can easily implement their own code (of course we could already implement code for standard instruments).
I think it would be good to cleary define what is our common aim now, so we are sure we are working in the same direction.
Let me know if you agree or I misunderstood what is your idea.
Best, Carlo
On Wed, Feb 19, 2025 at 16:11, Pierre Bouvet <pierre.bouvet@meduniwien.ac.at> wrote:
Hi,
I think you're trying to go too far too fast. The approach I present here <https://github.com/bio-brillouin/HDF5_BLS/blob/GUI_development/guides/Projec...> is intentionally simple, so that people can very quickly get to storing their data in a HDF5 file format together with the parameters they used to acquire them with minimal effort. The closest to what you did is therefore as follows: - data are datasets with no other restriction and they are stored in groups - each group can have a set of attribute proper to the data they are storing - attributes have a nomenclature imposed by a spreadsheet and are in the form of text - the default name of a data is the name of a raw data: “Raw_data”, other arrays can have whatever name they want (Shift_5GHz, Frequency, ...) - arrays and attributes are hierarchical, so they apply to their groups and all groups under it. This is the bare minimum to meet our needs, so we need to stop here in the definition of the format since it’s already enough to have the GUI working correctly, and therefore the first version of the unified software advertised. Of course we will have to refine things later on, but we don’t want to scare people off by presenting them a file description that for one might not match their measurements and that is extremely hard to conceptually understand. To make my point clearer, take your definition of the format for example: there are 3 different amplitude arrays in your description, two different shift arrays and width arrays that are of different dimension, then we have a calibration group on one side but a spectrometer characterization array in another group that is called “experiment_info”, that’s just too complicated to use correctly. On the other hand, placing your raw data “as is” in a group dedicated to this data is conceptually easy and straightforward. Where you are right, is that should we have hundreds of people using it, we might in a near future want to store abscissa, impulse responses, … in a standardized manner. In that case, the question falls down to either adding sub-groups or storing the data together with the measure. Both are fine and don’t really pose a problem for now, essentially because we are not trying to visualize the results but just trying to unify the way to get them. Now regarding Dash, if I understand correctly, it’s just a way to change the frontend you propose? If that’s so, why not, but then I don’t really see the benefits: if you really want to use dash, you can always embed it inside a Qt app. Also Dash being browser based, you will only have one window for the whole interface, which will be a pain to deal with if you want to use the interface to do everything the GUI is expected to do (inspect an H5 file, convert PSD, treat data, edit parameters, inspect a failed treatment, simulate results using setups with slight changes of parameters…). We agree that at one point when people receive an h5 file, it will be useful to have a web interface that can do what yours or Sal’s GUI do (seeing the mapping results together with the spectrum, eventually the time-domain signal) but here again, it’s going too far too soon: let’s first have a simple and reliable GUI that can convert data from any spectrometer to PSDs and treat them with a unified code. This is the real challenge, visualization and nomenclature of results are both important but secondary. Also keep in mind that, the frontend can easily be generated by anyone really, with Copilot or ChatGPT or whatever AI, but you can’t ask them to develop the function that will correctly read your data and convert them to a PSD nor treat the PSD. This is done on the backend and is the priority since the unification essentially happens there.
Best,
Pierre
Pierre Bouvet, PhD Post-doctoral Fellow Medical University Vienna Department of Anatomy and Cell Biology Wahringer Straße 13, 1090 Wien, Austria
On 19/2/25, at 13:21, Carlo Bevilacqua <carlo.bevilacqua@embl.de <mailto:carlo.bevilacqua@embl.de>> wrote:
Hi Pierre, thanks for your reply.
Regarding the file structure, what I am still not very clear about is what you define as Raw_data and data, how the actual spectra are stored and how the association to spatial coordinates and parameters is made. That's why I would really appreciate if you could make a document similar to what I did <https://github.com/prevedel-lab/Brillouin-standard-file/blob/main/docs/Bh5_f...>, where it is clear what each group should (or can) contain, what is the shape of each dataset, which attributes they have, etc... I am not saying that this should be the final structure of the file but I strongly believe that having it written in a structured way helps defining it and seeing potential issues.
Regarding the webapp, it works by separating the frontend, which run in the browser and is responsible of running the GUI, and the backend which is doing the actual computation and that you can structure as you like with multithreading or any optimization you wish. The communication between frontend and backend is handled transparently by the framework, so you don't have to take care of it. When you run Dash locally a local server is created so the data stays on your computer and there is no issue with data transfer/privacy. If we want to move it to a server at a later stage, then you are right about the fact that data needs to be transferred to a server (although there might be solutions that allow you to still run the computation on the local browser, like WebAssembly <https://webassembly.org/>, but I think it is too complex to look into this at this stage). Regarding safety and privacy, the data will be stored on the server only for the time that the user is using the app and then deleted (of course we will need to make a disclaimer on the website about this). Regarding space I don't think people at the beginning will load their 1Tb dataset on the webapp but rather look at some small dataset of few tens of Gb; in that case 1Tb of server space is more than enough (remember that the file will be stored only for the time the user is using the app). If people really start to use the webapp and space becomes a limitation, I would be super happy to look into WebAssembly so that the data can be handled locally from the browser without transferring it to the server.
To summarize I would agree that, at this stage, there might be no advantage of a webapp over a local GUI (and might actually be a bit more work to develop it). But, if this project really flies, the potential of a webapp is huge, especially in the context of the BioBrillouin society where we want to have a database of spectral data and the webapp could be used to explore that without downloading anything on your computer. My main point is that moving now to a webapp would not be too much work, but if we want to do it at a later stage it will basically entail re-writing everything from scratch.
Let me know what are your thoughts about it.
Best, Carlo
On Wed, Feb 19, 2025 at 08:51, Pierre Bouvet <pierre.bouvet@meduniwien.ac.at <mailto:pierre.bouvet@meduniwien.ac.at>> wrote:
Hi Carlo,
You’re right, the format is still a little fuzzy. The main idea is to have a data-based hierarchy for storage: each data is stored in an individual group. From there, abscissa dependent on the data are stored in the same group and the treated data are stored in sub-groups. The names of the groups and sub-groups are fixed (Data_i), as is the name of the raw data (Raw_data) and abscissa (Abscissa_i). Also, the measure and spectrometer-dependent arguments have a defined nomenclature. To differentiate groups between them, we preferably attribute them a name as an attribute that is not used as an identifier, the identifier being either the path to the data/group from file root (Data_0/Data_42/Data_2/Raw_data) or potentially a hash value (not implemented). This I think allows all possible configurations, and using an hierarchical approach we can also pass common attributes and arrays (parameters of the spectrometer or abscissa arrays for example) on parent to reduce memory complexity. Now regarding the use of server-based GUI, first off, I’ve never used them so I’m just making supposition here but if the platform is able to treat data online, it will have to store the spectra somewhere in memory and it will not be local. My primary concerns with this approach is safety, particularly in terms of intellectual property protection, ethical considerations, and potential security vulnerabilities. Additionally, managing storage space will be a headache. Now, this doesn’t mean that we can’t have a server-based data plotter, or a server-based interface that does treatments locally but I don’t really see the benefits of this over a local software that can have multiple windows, which could at one point be multithreaded, and that could wrap c code to speed regressions for example (some of this might apply to Dash, I’m not super familiar with it). Now regarding memory complexity, having all the data we treat go on a server is a bad idea as it will raise the question of cost which will very rapidly become a real problem. Just an example: for a 100x100 map, I need 10Gb of memory (1Mo/point) with my setup (1To of archive storage is approximately 1euro/month) so this would get out of hands super fast assuming people use it. Now maybe there are solutions I don’t see for these problems and someone can take care of them but for me it’s just not worth the effort when having a local GUI solves all of these issues at once. But if you find a solution, then I’ll be happy to migrate to Dash, it won’t be fast to translate every feature but I can totally join you on the platform.
Best,
Pierre
Pierre Bouvet, PhD Post-doctoral Fellow Medical University Vienna Department of Anatomy and Cell Biology Wahringer Straße 13, 1090 Wien, Austria
On 18/2/25, at 20:26, Carlo Bevilacqua <carlo.bevilacqua@embl.de <mailto:carlo.bevilacqua@embl.de>> wrote:
Hi Pierre,
regarding the structure of the file, I agree that we should keep it simple. I am not suggesting to make it more complex, rather to have a document where we define it in a clear and structured way rather than as a general description, to make sure that we are all on the same page. I am saying this because, to be honest, I am not sure I fully understand how you are structuring the HDF5 and I think it is important to agree on this now, rather than finding at a later stage that we had different ideas.
Ideally if the GUI should be part of a single application, we should write it using a unified framework. The reasons why, after considering it for a bit, I lean towards Dash rather than Qt are: it can run in a web browser so it will be easy to eventually move it to a website, thus people can use it without installing it (which will hopefully help in promoting its use) it is based on plotly <https://plotly.com/python/> which is a graphical library with very good plotting capabilites and highly customizable, that would make the data visualization easier/more appealing Let me know what you think about it and if you see any advantage of Qt over a web app which I am not considering. Also, if we agree that Dash might be a better option, would you consider migrating to Dash? It might not be too much work if most of the code you wrote is for data processing rather that for the GUI itself and I could help you with that. Alternatively one workaround is to have a QtWebEngine <https://doc.qt.io/qtforpython-6/overviews/qtwebengine-overview.html> in your Qt app and have the Dash app run inside that, but that would make only the Dash part portable to a server later on.
Best, Carlo
On Tue, Feb 18, 2025 at 10:24, Pierre Bouvet <pierre.bouvet@meduniwien.ac.at <mailto:pierre.bouvet@meduniwien.ac.at>> wrote:
Hi,
Thanks,
More than merge them later, just keep them separate in the process and rather than trying to build "one code to do it all", build one library and GUI that encapsulate codes to do everything. Having a structure is a must but it needs to be kept as simple as possible else we’ll rapidly find situations where we need to change the structure. The middle ground I think is to force the use of hierarchies and impose nomenclatures where problem are expected to appear: each dataset has its own group, each group can encapsulate other groups, each parameter of a group applies to all its sub-groups if the subgroup does not change its value, each array of a group applies to all of its sub-groups if the sub-group does not redefine an array with same name, the names of the groups are held as parameters and their ID are managed by the software. For the Plotly interface, I don’t know how to integrate it to Qt but if you find a way to do it, that’s perfect with me :) My vision of the GUI is something that unifies the format and can then execute scripts on the data stored in this format. I have pushed the application of the GUI to my data up to the point where I can do the whole information extraction process from it (add data, convert to PSD, fit curves). I think this could be super interesting if we implement it for all techniques. I think we could formalize the project in milestones, in particular define the minimal denominator that will allow us to have the paper. The milestone I reached for my spectro encompasses the following points: - Being able to add data to the file easily (by dragging & dropping to the GUI) - Being able to assign properties to these data easily (again by dragging & dropping) - Being able to structure the added data in groups/folders/containers/however we want to call it - Making it easy for new data types to be loaded - Allowing data from same type but different structure to be added (e.g. .dat files) - Execute scripts on the data easily and allowing parameters of these scripts to be defined from the GUI (e.g. select a peak on a curve to fit this peak) - Make it easy to add scripts for treating or extracting PSD from raw data. - Allow the export of a Python code to access the data from the file (we cans see them as “break points” in the treatment pipeline) - Edit of properties inside the GUI In any case I think we could build a spec sheet for the project with what we want to have in it based on what we want to advertise in the paper. We can always add things later on but if we agree on a strict minimum to have the project advertised, then that will set its first milestone on which we’ll be able to build later on.
Best,
Pierre
Pierre Bouvet, PhD Post-doctoral Fellow Medical University Vienna Department of Anatomy and Cell Biology Wahringer Straße 13, 1090 Wien, Austria
> On 17/2/25, at 14:53, Carlo Bevilacqua via Software <software@biobrillouin.org <mailto:software@biobrillouin.org>> wrote: > > Hi Pierre, hi Sal, > thanks for sharing your thoughts about it. > @Pierre I am very sorry that Ren passed away :( > > As far as I understood you are suggesting to work on the individual aspects separately and then merge them together at a later stage? I am fine with that but I still think it is very important to now agree on what should be in the file format we are defining, because that is kind of the core of the project and will affect a lot of the design choices. > > I am happy to start working on the GUI for data visualization. In my idea, it will be something similar to this <https://www.nature.com/articles/s41592-023-02054-z/figures/10> but written in dash <https://dash.plotly.com/>, so it is a web app that for now can run locally (so no transfer of data to an external server is required) but in the future can easily be uploaded to a website that people can just use without installing anything on their computer. > The question is how much of the data processing should be possible to do (or trigger) from the same GUI? I think at least a drop down menu with different fitting functions should be there, so the user can quickly check the results on a spectrum from a specific point in the image. > @Pierre how are you envisioning the GUI you are working on? As far as I understood it is mainly to get the raw data and save it to our HDF5 format with some treatment on it. > One idea could be to have a shared list of features that we are implementing in the GUI as we work on it, to avoid having the same functionality duplicated (or worst inconsistent) between the GUI for generating our file format and the GUI for visualization. > > Let me know what you think about it. > > Best, > Carlo > > > > On Mon, Feb 17, 2025 at 11:04, Pierre Bouvet via Software <software@biobrillouin.org <mailto:software@biobrillouin.org>> wrote: >> Hi everyone, >> >> Sorry for the delayed response, I just went through the loss of Ren (my dog) and wasn’t at all able to answer. >> First of, Sal, I am making progress and I should have everything you have made on your branch integrated to the GUI branch soon, at which point I will push everything to main. >> Regarding the project, I think I align with Sal: keep things as simple as possible. My approach was to divide everything in 3 mostly independent layers: >> - Store data in an organized file that anyone can use, and make it easy to do >> - Convert these data into something that has physical significance: a Power Spectrum Density >> - Extract information from this Power Spectrum Density >> Each layer has its own challenge but they are independent on the challenge of having people using it: personally, if I had someone come to me with a new software to play with my measures, I would most likely only look at it for 1 minute (or less depending who made it) with a lot of apprehension and then based on how simple it looks and how much I understood of it, use it or - what is most likely - discard it. This is why Project.pdf <https://github.com/bio-brillouin/HDF5_BLS/blob/GUI_development/guides/Projec...> is essentially meant to say: we put data arrays in groups and give them attributes written in text, but you can also create groups within groups to organize your data! >> I believe most of the people in the BioBrillouin society will have the same approach and before having something complex that can do a lot, I think it’s best to have something simple that can just unify the format (which in itself is a lot) and that people can use right away with a minimal impact on their own individual pipelines for data processing. >> To be honest, I don’t think people will blindly trust our software at first to treat their data, but they will most likely use it at first to organize their raw spectra, and maybe add their own treated data if they are feeling particularly adventurous. But that is not a problem as long as we start a movement. From there yes, we can complexity and create custom file architectures but that is already too complex I think for this first project. >> If we can all just import our data to the wrapper and specify their attributes, this will already be a success. Then for the paper, if we can all add a custom code to treat these data to obtain a PSD, I think this will be enough. As I said, the current API already allows you to add your data in a variety of format, so it’s just a question of developing the PSD conversion before having something we can publish (and then tell people to use). >> >> A few extra points: >> - Working with my setup, I realized if the user could choose between different algorithms to treat their own data, it would make the overall project much more usable (if an algorithm bugs for whatever reason, you can use another one) so I created 2 bottle necks in the form of functions (for PSD conversion and treatment) that would inspect modules dedicated to either PSD conversion or treatment, and list existing functions. It’s in between classical and modular programming but it makes the development of new PSD conversion code and treatment way way easier >> - The GUI is developed using oriented-object programming. Therefore I have already made some low-level choices that kind of impact all the GUI. I’m not saying they are the best choices, I’m just saying that they work, so if you want to work on the GUI, I would either recommend getting familiar with these choices, or making sure that all the functionalities are preserved, particularly the ones that are invisible (logging of treatment steps, treatment errors…) >> >> I’ll try merging the branches on Git asap and will definitely send you all an email when it’s done :) >> >> Best, >> >> Pierre >> >> Pierre Bouvet, PhD >> Post-doctoral Fellow >> Medical University Vienna >> Department of Anatomy and Cell Biology >> Wahringer Straße 13, 1090 Wien, Austria >> >> >> >> >> >> >>> On 14/2/25, at 19:36, Sal La Cavera Iii via Software <software@biobrillouin.org <mailto:software@biobrillouin.org>> wrote: >>> >>> Hi all, >>> >>> I agree with the things enumerated and points made by Kareem/Carlo! I guess I would advocate for starting from a position of simplicity. We probably don't want to get weighed down by trying to include a bunch of bells and whistles from the start as these can be easily added once there is a minimally viable stable product. >>> >>> As long as data can be loaded to local memory, then treated in various (initially simple) ways through the GUI (and maybe maintain non-GUI compatibility for command-line warriors like myself), then the bh5 formatting stuff can be sorted on the back end? I definitely agree with Carlo's structure set out in the file format document; but all of that data will be floating around the memory in some shape or form and just needs to be wrapped up and packaged (according to Carlo's structure e.g.) when the user is happy and presses the "generate h5 filestore" etc. (?) >>> >>> Definitely agree with the recommendation to create the alpha using mainly requirements that our 3 labs would find useful (import filetypes, treatments, etc), and then we can add on more universal functionality second / get some beta testers in from other labs etc. >>> >>> I'm able to support on whatever jobs need doing and am free to meet in the beginning of March like you mentioned Kareem. >>> >>> Hope you guys have a nice weekend, >>> >>> Cheers, >>> >>> Sal >>> >>> --------------------------------------------------------------- >>> Salvatore La Cavera III >>> Royal Academy of Engineering Research Fellow >>> Nottingham Research Fellow >>> Optics and Photonics Group >>> University of Nottingham >>> Email: salvatore.lacaveraiii@nottingham.ac.uk <mailto:salvatore.lacaveraiii@nottingham.ac.uk> >>> ORCID iD: 0000-0003-0210-3102 >>> <Outlook-tygjxucs.png> <https://outlook.office.com/bookwithme/user/6a3f960a8e89429cb6fc693c01d10119@...> >>> Book a Coffee and Research chat with me! >>> From: Carlo Bevilacqua via Software <software@biobrillouin.org <mailto:software@biobrillouin.org>> >>> Sent: 12 February 2025 13:31 >>> To: Kareem Elsayad <kareem.elsayad@meduniwien.ac.at <mailto:kareem.elsayad@meduniwien.ac.at>> >>> Cc: sebastian.hambura@embl.de <mailto:sebastian.hambura@embl.de> <sebastian.hambura@embl.de <mailto:sebastian.hambura@embl.de>>; software@biobrillouin.org <mailto:software@biobrillouin.org> <software@biobrillouin.org <mailto:software@biobrillouin.org>> >>> Subject: [Software] Re: Software manuscript / BLS microscopy >>> >>> You don't often get email from software@biobrillouin.org <mailto:software@biobrillouin.org>. Learn why this is important <https://aka.ms/LearnAboutSenderIdentification> >>> Hi Kareem, >>> thanks for restarting this and sorry for my silence, I just came back from US and was planning to start working on this again. >>> Could you also add Sebastian (in CC) to the mailing list? >>> >>> As you outlined, I would split the project into two parts: 1) getting from the raw data to some standard "processed' spectra and 2) do data analysis/visualization on that. For the second part the way I envision it is: >>> the most updated definition of the file format from Pierre is this one <https://github.com/bio-brillouin/HDF5_BLS/blob/GUI_development/guides/Projec...>, correct? In addition to this document I think it would be good to have a more structured description of the file (like this <https://github.com/prevedel-lab/Brillouin-standard-file/blob/main/docs/Bh5_f...>), where each field is clearly defined in terms of data type and dimensions. Sebastian was also suggesting that the document should contain the reasoning behind each specific choice in the specs and also things that we considered but decided had some issues (so in future we can look back at it). I still believe that the file format should contain the "processed" spectra (i.e. after FT and baseline subtraction for impulsive, or after taking a line profile and possibly linearization with VIPA,...) so we can apply standard data processing or visualization which is independent on the actual underlaying technique (e.g. VIPA, FP, stimulated, time domain, ...) >>> agree on an API to read the data from our file format (most likely a Python class). For that we should: 1) decide on which information is important to extract (spectral information, spatial coordinates, hyper-parameters, metadata,...) 2) implement an interface to read the data (e.g. readSpectrumAtIndex(...), readImage(...), ...) >>> build a GUI that use the previously defined API to show and process the data. >>> I would say that, once we have a very solid description of the file format as in step 1, step 2 will come naturally and we can divide the actual implementation between us. Step 3 can also easily be implemented and divided between us once we have an API (and I am happy to work on the GUI myself). >>> >>> The first half of the project is the trickiest and I know Pierre has already done a lot of work in that direction. We should definitely agree on which extent we can define a standard to store the raw data, given the variability between labs, (and probably we should do it for common techniques like FP or VIPA) and how to implement the treatments, leaving to possibility to load some custom code in the pipeline to do the conversion. >>> >>> Let me know what you all think about this. >>> If you agree I would start by making a document which clearly defines the file format in a structured way (as in my step 1 before). @Pierre could you write a new document or modify the document I originally made <https://github.com/prevedel-lab/Brillouin-standard-file/blob/main/docs/Bh5_f...> to reflect the latest structure you implemented for the file format? The metadata can still be defined in a separated excel sheet, as long as the data type and format is well defined there. >>> >>> Best regards, >>> Carlo >>> >>> >>> On Wed, Feb 12, 2025 at 02:19, Kareem Elsayad via Software <software@biobrillouin.org <mailto:software@biobrillouin.org>> wrote: >>>> Hi Robert, Carlo, Sal, Pierre, >>>> >>>> >>>> >>>> >>>> >>>> Think it would be good to follow up on software project. Pierre has made some progress here and would be good to try and define tasks a little bit clearer to make progress… >>>> >>>> >>>> >>>> >>>> >>>> There is always the potential issue of having “too many cooks in the kitchen” (that have different recipes for same thing) to move forward efficiently, something that I noticed can get quite confusing/frustrating when writing software together with people. So would be good to clearly assign tasks. I talked to Pierre today and he would be happy to integrate things in framework we have to try tie things together. What would foremost be needed would be ways of treating data, meaning code that takes a raw spectral image and meta-data and converts it into “standard” format (spectral representation) that can then be fitted. Then also “plugins” that serve a specific purpose in the analysis/rendering that can be included in framework. >>>> >>>> >>>> >>>> >>>> >>>> The way I see it (and please comment if you see differently), there are ~4 steps here: >>>> >>>> >>>> >>>> >>>> >>>> Take raw data (in .tif,, .dat, txt, etc. format) and meta data (in .cvs, xlsx, .dat, .txt, etc.) and render a standard spectral presentation. Also take provided instrument response in one of these formats and extract key parameters from this >>>> Fit the data with drop-down menu list of functions, that will include different functional dependences and functions corrected for instrument response. >>>> Generate/display a visual representation of results (frequency shift(s) and linewidth(s)), that is ideally interactive to some extent (and maybe has some funky features like looking at spectra at different points. These can be spatial maps and/or evolution with some other parameter (time, temperature, angle, etc.). Also be able to display maps of relative peak intensities in case of multiple peak fits, and whatever else useful you can think of. >>>> Extract “mechanical” parameters given assigned refractive indices and densities >>>> >>>> >>>> >>>> I think the idea of fitting modified functions (e.g. corrected based on instrument response) vs. deconvolving spectra makes more sense (as can account for more complex corrections due to non-optical anomalies in future –ultimately even functional variations in vicinity of e.g. phase transitions). It is also less error prone, as systematically doing decon with non-ideal registration data can really throw you off the cliff, so to speak. >>>> >>>> >>>> >>>> >>>> >>>> My understanding is that we kind of agreed on initial meta-data reporting format. Getting from 1 to 2 will no doubt be most challenging as it is very instrument specific. So instructions will need to be written for different BLS implementations. >>>> >>>> >>>> >>>> >>>> >>>> This is a huge project if we want it to be all inclusive.. so I would suggest to focus on making it work for just a couple of modalities first would be good (e.g. crossed VIPA, time-resolved, anisotropy, and maybe some time or temperature course of one of these). Extensions should then be more easy to navigate. At one point think would be good to involve SBS specific considerations also. >>>> >>>> >>>> >>>> >>>> >>>> Think would be good to discuss a while per email to gather thoughts and opinions (and already start to share codes), and then plan a meeting beginning of March -- how does first week of March look for everyone? >>>> >>>> >>>> >>>> >>>> >>>> I created this mailing list (software@biobrillouin.org <mailto:software@biobrillouin.org>) we can use for discussion. You should all be able to post to (and it makes it easier if we bring anyone else in along the way). >>>> >>>> >>>> At moment on this mailing list is Robert, Carlo, Sal, Pierre and myself. Let me know if I should add anyone. >>>> >>>> >>>> >>>> >>>> >>>> All the best, >>>> >>>> >>>> Kareem >>>> >>>> >>>> >>>> >>>> >>>> >>>> >>>> >>> >>> This message and any attachment are intended solely for the addressee and may contain confidential information. If you have received this message in error, please contact the sender and delete the email and attachment. Any views or opinions expressed by the author of this email do not necessarily reflect the views of the University of Nottingham. Email communications with the University of Nottingham may be monitored where permitted by law. _______________________________________________ >>> Software mailing list -- software@biobrillouin.org <mailto:software@biobrillouin.org> >>> To unsubscribe send an email to software-leave@biobrillouin.org <mailto:software-leave@biobrillouin.org> >> > > _______________________________________________ > Software mailing list -- software@biobrillouin.org <mailto:software@biobrillouin.org> > To unsubscribe send an email to software-leave@biobrillouin.org <mailto:software-leave@biobrillouin.org>
_______________________________________________ Software mailing list -- software@biobrillouin.org <mailto:software@biobrillouin.org> To unsubscribe send an email to software-leave@biobrillouin.org <mailto:software-leave@biobrillouin.org>_______________________________________________ Software mailing list -- software@biobrillouin.org <mailto:software@biobrillouin.org> To unsubscribe send an email to software-leave@biobrillouin.org <mailto:software-leave@biobrillouin.org>
Hi Kareem, thanks for the suggestion, I agree that it is a good (and easy) way to divide the tasks! Just to be clear, it is not that I don't see the need/advantage of providing some standard treatment going from raw data to standard spectra, it is just that was not my priority when proposing the idea of a unified file format. Regarding the file format, splitting the one containing the raw data and the treatments from the one containing the spectra and the image in a standard format might be a good solution and we can always merge them at a later stage. As for the file containing the "standard" spectra, it would be very helpful if you can give some feedback on the structure I originally proposed (https://github.com/prevedel-lab/Brillouin-standard-file/blob/main/docs/Bh5_f...). Keep in mind that the idea is to be able to associate spectrum/spectra to each pixel in the image, in a way that is independent of the scanning strategy and underlaying technique. I tried to find a solution that works for the techniques I am aware of, considering the peculiarities (e.g. for most VIPA setups there is no absolute frequency axis but only relative to water). If am happy to discuss why I made some specific choices and if you see a better way to achieve the same or see things differently. Both the 3rd and the 4th of March work for me. Best, Carlo On Thu, Feb 20, 2025 at 02:50, Kareem Elsayad via Software wrote: Dear All, (and I guess especially Carlo & Pierre 😊) I understand both your (main) points concerning what this all should be, and I think this is actually perfect for dividing tasks. The format of the hf or bh5 file being where things meet and what needs to be agreed on. The thing with raw data is ofcourse that it is variable between instruments and labs, and the conversion to “standard spectra” that can then be fitted etc. is going to be unique (maybe even between experiments in same project). That said, asking people to create some complex file from their data that works with a developed software is also unlikely to get a following. So (the way I see it) there are basically two parts. Getting from raw data to h5 (or bh5) format which contains the spectra in standard format. And then the whole analysis part and visualization (GUI, pretty features, etc.). While the latter may get the spotlight, it obviously relies heavily on the former being done right. Given that there are numerous “standard” BLS setup implementations the development of software for getting from raw data to h5 I think makes sense, since the h5 will no doubt be cryptic, and creating a working h5 is not something everyone will want to program by themselves (it is not an insignificant step given we are also trying to ultimately cater to biologists). As such a software that generates the h5 files, with drag and drop features and entering system parameters, for different setups makes sense and will save many labs a headache if they don’t have a good programmer on hand. So I would suggest that Pierre & Sal lead the work on developing this, while Carlo & Sebastian lead the work on developing the analysis/interface-presentation part. This way things are nicely divided and we just need to agree on the h5 file that is transferred between the two. From the side of Pierre & Sal there could maybe also be a second h5 generated that contains all the raw data and details on how it was converted to the transferred h5 file (for complete transparency this could then also be reported in papers if people wish). These could exist as two separate programs with respective GUIs but also eventually combined to a single one. How does this sound to everyone? To clear up details and try assign tasks going forward how about a Zoom first week of March (I would be free Monday 3rd and Tue 4th after 1pm)? All the best, Kareem From: Carlo Bevilacqua via Software Reply to: Carlo Bevilacqua Date: Wednesday, 19. February 2025 at 20:43 To: Pierre Bouvet Cc: Subject: [Software] Re: [EXTERN] Re: Software manuscript / BLS microscopy Hi Pierre, I realized that we might have slightly different aims. For me the most important part of this project is to have a unified file format that can be read and visualized by a standard software. The file format you are proposing is not sufficient for that in my opinion. For example one of my main motivation was to have an interface where the user can see the reconstructed image, click on a pixel, see the corresponding spectrum to check its quality and maybe try different fitting functions; that would already not be possible with your structure because the software would have no notion on where the spectral data is stored and how to associate it to a specific pixel. I don't see the structure of the file to be too complex as an issue, as long as it is functional: we can always provide an API and/or a GUI that allow people to take their spectra and save them in whatever format we decide without bothering about understanding the actual structure, the same way you can work with HDF5 file without having any understanding on how the data is actually stored on the disk. My idea of making a webapp as a GUI follows directly from there. Typical case: I sent some data to a collaborator and they can just run the app in their browser and check if the outliers they see in the image are real or a bad spectra. Similarly if we make a common database of Brillouin spectra, people can explore it easily using the webapp. From what I understood, you are instead more interested in going from raw data to an actual spectrum, which I don't see so much as a priority because each lab has their own code already and the actual procedure would be different for each lab (apart from standard instruments like the FP). I am not saying this should not be part of the software but not as a priority and rather has a layer where people can easily implement their own code (of course we could already implement code for standard instruments). I think it would be good to cleary define what is our common aim now, so we are sure we are working in the same direction. Let me know if you agree or I misunderstood what is your idea. Best, Carlo On Wed, Feb 19, 2025 at 16:11, Pierre Bouvet wrote: Hi, I think you're trying to go too far too fast. The approach I present here (https://github.com/bio-brillouin/HDF5_BLS/blob/GUI_development/guides/Projec...) is intentionally simple, so that people can very quickly get to storing their data in a HDF5 file format together with the parameters they used to acquire them with minimal effort. The closest to what you did is therefore as follows: - data are datasets with no other restriction and they are stored in groups - each group can have a set of attribute proper to the data they are storing - attributes have a nomenclature imposed by a spreadsheet and are in the form of text - the default name of a data is the name of a raw data: “Raw_data”, other arrays can have whatever name they want (Shift_5GHz, Frequency, ...) - arrays and attributes are hierarchical, so they apply to their groups and all groups under it. This is the bare minimum to meet our needs, so we need to stop here in the definition of the format since it’s already enough to have the GUI working correctly, and therefore the first version of the unified software advertised. Of course we will have to refine things later on, but we don’t want to scare people off by presenting them a file description that for one might not match their measurements and that is extremely hard to conceptually understand. To make my point clearer, take your definition of the format for example: there are 3 different amplitude arrays in your description, two different shift arrays and width arrays that are of different dimension, then we have a calibration group on one side but a spectrometer characterization array in another group that is called “experiment_info”, that’s just too complicated to use correctly. On the other hand, placing your raw data “as is” in a group dedicated to this data is conceptually easy and straightforward. Where you are right, is that should we have hundreds of people using it, we might in a near future want to store abscissa, impulse responses, … in a standardized manner. In that case, the question falls down to either adding sub-groups or storing the data together with the measure. Both are fine and don’t really pose a problem for now, essentially because we are not trying to visualize the results but just trying to unify the way to get them. Now regarding Dash, if I understand correctly, it’s just a way to change the frontend you propose? If that’s so, why not, but then I don’t really see the benefits: if you really want to use dash, you can always embed it inside a Qt app. Also Dash being browser based, you will only have one window for the whole interface, which will be a pain to deal with if you want to use the interface to do everything the GUI is expected to do (inspect an H5 file, convert PSD, treat data, edit parameters, inspect a failed treatment, simulate results using setups with slight changes of parameters…). We agree that at one point when people receive an h5 file, it will be useful to have a web interface that can do what yours or Sal’s GUI do (seeing the mapping results together with the spectrum, eventually the time-domain signal) but here again, it’s going too far too soon: let’s first have a simple and reliable GUI that can convert data from any spectrometer to PSDs and treat them with a unified code. This is the real challenge, visualization and nomenclature of results are both important but secondary. Also keep in mind that, the frontend can easily be generated by anyone really, with Copilot or ChatGPT or whatever AI, but you can’t ask them to develop the function that will correctly read your data and convert them to a PSD nor treat the PSD. This is done on the backend and is the priority since the unification essentially happens there. Best, Pierre Pierre Bouvet, PhD Post-doctoral Fellow Medical University Vienna Department of Anatomy and Cell Biology Wahringer Straße 13, 1090 Wien, Austria On 19/2/25, at 13:21, Carlo Bevilacqua wrote: Hi Pierre, thanks for your reply. Regarding the file structure, what I am still not very clear about is what you define as Raw_data and data, how the actual spectra are stored and how the association to spatial coordinates and parameters is made. That's why I would really appreciate if you could make a document similar to what I did (https://github.com/prevedel-lab/Brillouin-standard-file/blob/main/docs/Bh5_f...), where it is clear what each group should (or can) contain, what is the shape of each dataset, which attributes they have, etc... I am not saying that this should be the final structure of the file but I strongly believe that having it written in a structured way helps defining it and seeing potential issues. Regarding the webapp, it works by separating the frontend, which run in the browser and is responsible of running the GUI, and the backend which is doing the actual computation and that you can structure as you like with multithreading or any optimization you wish. The communication between frontend and backend is handled transparently by the framework, so you don't have to take care of it. When you run Dash locally a local server is created so the data stays on your computer and there is no issue with data transfer/privacy. If we want to move it to a server at a later stage, then you are right about the fact that data needs to be transferred to a server (although there might be solutions that allow you to still run the computation on the local browser, like WebAssembly (https://webassembly.org/), but I think it is too complex to look into this at this stage). Regarding safety and privacy, the data will be stored on the server only for the time that the user is using the app and then deleted (of course we will need to make a disclaimer on the website about this). Regarding space I don't think people at the beginning will load their 1Tb dataset on the webapp but rather look at some small dataset of few tens of Gb; in that case 1Tb of server space is more than enough (remember that the file will be stored only for the time the user is using the app). If people really start to use the webapp and space becomes a limitation, I would be super happy to look into WebAssembly so that the data can be handled locally from the browser without transferring it to the server. To summarize I would agree that, at this stage, there might be no advantage of a webapp over a local GUI (and might actually be a bit more work to develop it). But, if this project really flies, the potential of a webapp is huge, especially in the context of the BioBrillouin society where we want to have a database of spectral data and the webapp could be used to explore that without downloading anything on your computer. My main point is that moving now to a webapp would not be too much work, but if we want to do it at a later stage it will basically entail re-writing everything from scratch. Let me know what are your thoughts about it. Best, Carlo On Wed, Feb 19, 2025 at 08:51, Pierre Bouvet wrote: Hi Carlo, You’re right, the format is still a little fuzzy. The main idea is to have a data-based hierarchy for storage: each data is stored in an individual group. From there, abscissa dependent on the data are stored in the same group and the treated data are stored in sub-groups. The names of the groups and sub-groups are fixed (Data_i), as is the name of the raw data (Raw_data) and abscissa (Abscissa_i). Also, the measure and spectrometer-dependent arguments have a defined nomenclature. To differentiate groups between them, we preferably attribute them a name as an attribute that is not used as an identifier, the identifier being either the path to the data/group from file root (Data_0/Data_42/Data_2/Raw_data) or potentially a hash value (not implemented). This I think allows all possible configurations, and using an hierarchical approach we can also pass common attributes and arrays (parameters of the spectrometer or abscissa arrays for example) on parent to reduce memory complexity. Now regarding the use of server-based GUI, first off, I’ve never used them so I’m just making supposition here but if the platform is able to treat data online, it will have to store the spectra somewhere in memory and it will not be local. My primary concerns with this approach is safety, particularly in terms of intellectual property protection, ethical considerations, and potential security vulnerabilities. Additionally, managing storage space will be a headache. Now, this doesn’t mean that we can’t have a server-based data plotter, or a server-based interface that does treatments locally but I don’t really see the benefits of this over a local software that can have multiple windows, which could at one point be multithreaded, and that could wrap c code to speed regressions for example (some of this might apply to Dash, I’m not super familiar with it). Now regarding memory complexity, having all the data we treat go on a server is a bad idea as it will raise the question of cost which will very rapidly become a real problem. Just an example: for a 100x100 map, I need 10Gb of memory (1Mo/point) with my setup (1To of archive storage is approximately 1euro/month) so this would get out of hands super fast assuming people use it. Now maybe there are solutions I don’t see for these problems and someone can take care of them but for me it’s just not worth the effort when having a local GUI solves all of these issues at once. But if you find a solution, then I’ll be happy to migrate to Dash, it won’t be fast to translate every feature but I can totally join you on the platform. Best, Pierre Pierre Bouvet, PhD Post-doctoral Fellow Medical University Vienna Department of Anatomy and Cell Biology Wahringer Straße 13, 1090 Wien, Austria On 18/2/25, at 20:26, Carlo Bevilacqua wrote: Hi Pierre, regarding the structure of the file, I agree that we should keep it simple. I am not suggesting to make it more complex, rather to have a document where we define it in a clear and structured way rather than as a general description, to make sure that we are all on the same page. I am saying this because, to be honest, I am not sure I fully understand how you are structuring the HDF5 and I think it is important to agree on this now, rather than finding at a later stage that we had different ideas. Ideally if the GUI should be part of a single application, we should write it using a unified framework. The reasons why, after considering it for a bit, I lean towards Dash rather than Qt are: * it can run in a web browser so it will be easy to eventually move it to a website, thus people can use it without installing it (which will hopefully help in promoting its use) * it is based on plotly (https://plotly.com/python/) which is a graphical library with very good plotting capabilites and highly customizable, that would make the data visualization easier/more appealing Let me know what you think about it and if you see any advantage of Qt over a web app which I am not considering. Also, if we agree that Dash might be a better option, would you consider migrating to Dash? It might not be too much work if most of the code you wrote is for data processing rather that for the GUI itself and I could help you with that. Alternatively one workaround is to have a QtWebEngine (https://doc.qt.io/qtforpython-6/overviews/qtwebengine-overview.html) in your Qt app and have the Dash app run inside that, but that would make only the Dash part portable to a server later on. Best, Carlo On Tue, Feb 18, 2025 at 10:24, Pierre Bouvet wrote: Hi, Thanks, More than merge them later, just keep them separate in the process and rather than trying to build "one code to do it all", build one library and GUI that encapsulate codes to do everything. Having a structure is a must but it needs to be kept as simple as possible else we’ll rapidly find situations where we need to change the structure. The middle ground I think is to force the use of hierarchies and impose nomenclatures where problem are expected to appear: each dataset has its own group, each group can encapsulate other groups, each parameter of a group applies to all its sub-groups if the subgroup does not change its value, each array of a group applies to all of its sub-groups if the sub-group does not redefine an array with same name, the names of the groups are held as parameters and their ID are managed by the software. For the Plotly interface, I don’t know how to integrate it to Qt but if you find a way to do it, that’s perfect with me :) My vision of the GUI is something that unifies the format and can then execute scripts on the data stored in this format. I have pushed the application of the GUI to my data up to the point where I can do the whole information extraction process from it (add data, convert to PSD, fit curves). I think this could be super interesting if we implement it for all techniques. I think we could formalize the project in milestones, in particular define the minimal denominator that will allow us to have the paper. The milestone I reached for my spectro encompasses the following points: - Being able to add data to the file easily (by dragging & dropping to the GUI) - Being able to assign properties to these data easily (again by dragging & dropping) - Being able to structure the added data in groups/folders/containers/however we want to call it - Making it easy for new data types to be loaded - Allowing data from same type but different structure to be added (e.g. .dat files) - Execute scripts on the data easily and allowing parameters of these scripts to be defined from the GUI (e.g. select a peak on a curve to fit this peak) - Make it easy to add scripts for treating or extracting PSD from raw data. - Allow the export of a Python code to access the data from the file (we cans see them as “break points” in the treatment pipeline) - Edit of properties inside the GUI In any case I think we could build a spec sheet for the project with what we want to have in it based on what we want to advertise in the paper. We can always add things later on but if we agree on a strict minimum to have the project advertised, then that will set its first milestone on which we’ll be able to build later on. Best, Pierre Pierre Bouvet, PhD Post-doctoral Fellow Medical University Vienna Department of Anatomy and Cell Biology Wahringer Straße 13, 1090 Wien, Austria On 17/2/25, at 14:53, Carlo Bevilacqua via Software wrote: Hi Pierre, hi Sal, thanks for sharing your thoughts about it. @Pierre I am very sorry that Ren passed away :( As far as I understood you are suggesting to work on the individual aspects separately and then merge them together at a later stage? I am fine with that but I still think it is very important to now agree on what should be in the file format we are defining, because that is kind of the core of the project and will affect a lot of the design choices. I am happy to start working on the GUI for data visualization. In my idea, it will be something similar to this (https://www.nature.com/articles/s41592-023-02054-z/figures/10) but written in dash (https://dash.plotly.com/), so it is a web app that for now can run locally (so no transfer of data to an external server is required) but in the future can easily be uploaded to a website that people can just use without installing anything on their computer. The question is how much of the data processing should be possible to do (or trigger) from the same GUI? I think at least a drop down menu with different fitting functions should be there, so the user can quickly check the results on a spectrum from a specific point in the image. @Pierre how are you envisioning the GUI you are working on? As far as I understood it is mainly to get the raw data and save it to our HDF5 format with some treatment on it. One idea could be to have a shared list of features that we are implementing in the GUI as we work on it, to avoid having the same functionality duplicated (or worst inconsistent) between the GUI for generating our file format and the GUI for visualization. Let me know what you think about it. Best, Carlo On Mon, Feb 17, 2025 at 11:04, Pierre Bouvet via Software wrote: Hi everyone, Sorry for the delayed response, I just went through the loss of Ren (my dog) and wasn’t at all able to answer. First of, Sal, I am making progress and I should have everything you have made on your branch integrated to the GUI branch soon, at which point I will push everything to main. Regarding the project, I think I align with Sal: keep things as simple as possible. My approach was to divide everything in 3 mostly independent layers: - Store data in an organized file that anyone can use, and make it easy to do - Convert these data into something that has physical significance: a Power Spectrum Density - Extract information from this Power Spectrum Density Each layer has its own challenge but they are independent on the challenge of having people using it: personally, if I had someone come to me with a new software to play with my measures, I would most likely only look at it for 1 minute (or less depending who made it) with a lot of apprehension and then based on how simple it looks and how much I understood of it, use it or - what is most likely - discard it. This is why Project.pdf (https://github.com/bio-brillouin/HDF5_BLS/blob/GUI_development/guides/Projec...) is essentially meant to say: we put data arrays in groups and give them attributes written in text, but you can also create groups within groups to organize your data! I believe most of the people in the BioBrillouin society will have the same approach and before having something complex that can do a lot, I think it’s best to have something simple that can just unify the format (which in itself is a lot) and that people can use right away with a minimal impact on their own individual pipelines for data processing. To be honest, I don’t think people will blindly trust our software at first to treat their data, but they will most likely use it at first to organize their raw spectra, and maybe add their own treated data if they are feeling particularly adventurous. But that is not a problem as long as we start a movement. From there yes, we can complexity and create custom file architectures but that is already too complex I think for this first project. If we can all just import our data to the wrapper and specify their attributes, this will already be a success. Then for the paper, if we can all add a custom code to treat these data to obtain a PSD, I think this will be enough. As I said, the current API already allows you to add your data in a variety of format, so it’s just a question of developing the PSD conversion before having something we can publish (and then tell people to use). A few extra points: - Working with my setup, I realized if the user could choose between different algorithms to treat their own data, it would make the overall project much more usable (if an algorithm bugs for whatever reason, you can use another one) so I created 2 bottle necks in the form of functions (for PSD conversion and treatment) that would inspect modules dedicated to either PSD conversion or treatment, and list existing functions. It’s in between classical and modular programming but it makes the development of new PSD conversion code and treatment way way easier - The GUI is developed using oriented-object programming. Therefore I have already made some low-level choices that kind of impact all the GUI. I’m not saying they are the best choices, I’m just saying that they work, so if you want to work on the GUI, I would either recommend getting familiar with these choices, or making sure that all the functionalities are preserved, particularly the ones that are invisible (logging of treatment steps, treatment errors…) I’ll try merging the branches on Git asap and will definitely send you all an email when it’s done :) Best, Pierre Pierre Bouvet, PhD Post-doctoral Fellow Medical University Vienna Department of Anatomy and Cell Biology Wahringer Straße 13, 1090 Wien, Austria On 14/2/25, at 19:36, Sal La Cavera Iii via Software wrote: Hi all, I agree with the things enumerated and points made by Kareem/Carlo! I guess I would advocate for starting from a position of simplicity. We probably don't want to get weighed down by trying to include a bunch of bells and whistles from the start as these can be easily added once there is a minimally viable stable product. As long as data can be loaded to local memory, then treated in various (initially simple) ways through the GUI (and maybe maintain non-GUI compatibility for command-line warriors like myself), then the bh5 formatting stuff can be sorted on the back end? I definitely agree with Carlo's structure set out in the file format document; but all of that data will be floating around the memory in some shape or form and just needs to be wrapped up and packaged (according to Carlo's structure e.g.) when the user is happy and presses the "generate h5 filestore" etc. (?) Definitely agree with the recommendation to create the alpha using mainly requirements that our 3 labs would find useful (import filetypes, treatments, etc), and then we can add on more universal functionality second / get some beta testers in from other labs etc. I'm able to support on whatever jobs need doing and am free to meet in the beginning of March like you mentioned Kareem. Hope you guys have a nice weekend, Cheers, Sal --------------------------------------------------------------- Salvatore La Cavera III Royal Academy of Engineering Research Fellow Nottingham Research Fellow Optics and Photonics Group University of Nottingham Email: salvatore.lacaveraiii@nottingham.ac.uk (mailto:salvatore.lacaveraiii@nottingham.ac.uk) ORCID iD: 0000-0003-0210-3102 (https://outlook.office.com/bookwithme/user/6a3f960a8e89429cb6fc693c01d10119@...) Book a Coffee and Research chat with me! ------------------------------------ From: Carlo Bevilacqua via Software Sent: 12 February 2025 13:31 To: Kareem Elsayad Cc: sebastian.hambura@embl.de (mailto:sebastian.hambura@embl.de) ; software@biobrillouin.org (mailto:software@biobrillouin.org) Subject: [Software] Re: Software manuscript / BLS microscopy You don't often get email from software@biobrillouin.org (mailto:software@biobrillouin.org). Learn why this is important (https://aka.ms/LearnAboutSenderIdentification) Hi Kareem, thanks for restarting this and sorry for my silence, I just came back from US and was planning to start working on this again. Could you also add Sebastian (in CC) to the mailing list? As you outlined, I would split the project into two parts: 1) getting from the raw data to some standard "processed' spectra and 2) do data analysis/visualization on that. For the second part the way I envision it is: * the most updated definition of the file format from Pierre is this one (https://github.com/bio-brillouin/HDF5_BLS/blob/GUI_development/guides/Projec...), correct? In addition to this document I think it would be good to have a more structured description of the file (like this (https://github.com/prevedel-lab/Brillouin-standard-file/blob/main/docs/Bh5_f...)), where each field is clearly defined in terms of data type and dimensions. Sebastian was also suggesting that the document should contain the reasoning behind each specific choice in the specs and also things that we considered but decided had some issues (so in future we can look back at it). I still believe that the file format should contain the "processed" spectra (i.e. after FT and baseline subtraction for impulsive, or after taking a line profile and possibly linearization with VIPA,...) so we can apply standard data processing or visualization which is independent on the actual underlaying technique (e.g. VIPA, FP, stimulated, time domain, ...) * agree on an API to read the data from our file format (most likely a Python class). For that we should: 1) decide on which information is important to extract (spectral information, spatial coordinates, hyper-parameters, metadata,...) 2) implement an interface to read the data (e.g. readSpectrumAtIndex(...), readImage(...), ...) * build a GUI that use the previously defined API to show and process the data. I would say that, once we have a very solid description of the file format as in step 1, step 2 will come naturally and we can divide the actual implementation between us. Step 3 can also easily be implemented and divided between us once we have an API (and I am happy to work on the GUI myself). The first half of the project is the trickiest and I know Pierre has already done a lot of work in that direction. We should definitely agree on which extent we can define a standard to store the raw data, given the variability between labs, (and probably we should do it for common techniques like FP or VIPA) and how to implement the treatments, leaving to possibility to load some custom code in the pipeline to do the conversion. Let me know what you all think about this. If you agree I would start by making a document which clearly defines the file format in a structured way (as in my step 1 before). @Pierre could you write a new document or modify the document I originally made (https://github.com/prevedel-lab/Brillouin-standard-file/blob/main/docs/Bh5_f...) to reflect the latest structure you implemented for the file format? The metadata can still be defined in a separated excel sheet, as long as the data type and format is well defined there. Best regards, Carlo On Wed, Feb 12, 2025 at 02:19, Kareem Elsayad via Software wrote: Hi Robert, Carlo, Sal, Pierre, Think it would be good to follow up on software project. Pierre has made some progress here and would be good to try and define tasks a little bit clearer to make progress… There is always the potential issue of having “too many cooks in the kitchen” (that have different recipes for same thing) to move forward efficiently, something that I noticed can get quite confusing/frustrating when writing software together with people. So would be good to clearly assign tasks. I talked to Pierre today and he would be happy to integrate things in framework we have to try tie things together. What would foremost be needed would be ways of treating data, meaning code that takes a raw spectral image and meta-data and converts it into “standard” format (spectral representation) that can then be fitted. Then also “plugins” that serve a specific purpose in the analysis/rendering that can be included in framework. The way I see it (and please comment if you see differently), there are ~4 steps here: * Take raw data (in .tif,, .dat, txt, etc. format) and meta data (in .cvs, xlsx, .dat, .txt, etc.) and render a standard spectral presentation. Also take provided instrument response in one of these formats and extract key parameters from this * Fit the data with drop-down menu list of functions, that will include different functional dependences and functions corrected for instrument response. * Generate/display a visual representation of results (frequency shift(s) and linewidth(s)), that is ideally interactive to some extent (and maybe has some funky features like looking at spectra at different points. These can be spatial maps and/or evolution with some other parameter (time, temperature, angle, etc.). Also be able to display maps of relative peak intensities in case of multiple peak fits, and whatever else useful you can think of. * Extract “mechanical” parameters given assigned refractive indices and densities I think the idea of fitting modified functions (e.g. corrected based on instrument response) vs. deconvolving spectra makes more sense (as can account for more complex corrections due to non-optical anomalies in future –ultimately even functional variations in vicinity of e.g. phase transitions). It is also less error prone, as systematically doing decon with non-ideal registration data can really throw you off the cliff, so to speak. My understanding is that we kind of agreed on initial meta-data reporting format. Getting from 1 to 2 will no doubt be most challenging as it is very instrument specific. So instructions will need to be written for different BLS implementations. This is a huge project if we want it to be all inclusive.. so I would suggest to focus on making it work for just a couple of modalities first would be good (e.g. crossed VIPA, time-resolved, anisotropy, and maybe some time or temperature course of one of these). Extensions should then be more easy to navigate. At one point think would be good to involve SBS specific considerations also. Think would be good to discuss a while per email to gather thoughts and opinions (and already start to share codes), and then plan a meeting beginning of March -- how does first week of March look for everyone? I created this mailing list (software@biobrillouin.org (mailto:software@biobrillouin.org)) we can use for discussion. You should all be able to post to (and it makes it easier if we bring anyone else in along the way). At moment on this mailing list is Robert, Carlo, Sal, Pierre and myself. Let me know if I should add anyone. All the best, Kareem This message and any attachment are intended solely for the addressee and may contain confidential information. If you have received this message in error, please contact the sender and delete the email and attachment. Any views or opinions expressed by the author of this email do not necessarily reflect the views of the University of Nottingham. Email communications with the University of Nottingham may be monitored where permitted by law. _______________________________________________ Software mailing list -- software@biobrillouin.org (mailto:software@biobrillouin.org) To unsubscribe send an email to software-leave@biobrillouin.org (mailto:software-leave@biobrillouin.org) _______________________________________________ Software mailing list -- software@biobrillouin.org (mailto:software@biobrillouin.org) To unsubscribe send an email to software-leave@biobrillouin.org (mailto:software-leave@biobrillouin.org) _______________________________________________ Software mailing list -- software@biobrillouin.org (mailto:software@biobrillouin.org) To unsubscribe send an email to software-leave@biobrillouin.org (mailto:software-leave@biobrillouin.org)

Dear all, great to see all this discussion in this thread, and thanks to especially Pierre and Carlo for driving this forward. I’ve been following the various emails and arguments closely but simply didn’t have any time to chip in due to some important committments in the past days. I understand that there was a bit of a disagreement about what the focus of this effort should be, so maybe it just helps to highlight my lab's view on this (which I just discussed in depth with Carlo and Sebastian): Our original motivation was to come up with and define a common file-format, as we regard this to be key to unify the processing and visualization of Brillouin data by the community. In this respect, we would be happy to focus our efforts on defining this format and taking care of implementing the necessary processing/visualization software and interface that allows anyone to look at the data in the same way. We also regard this to be crucial if we want to standardize the reporting of Brillouin data from diverse setups/users/applications. Therefore, at this stage it would be extremely important to agree on the structure of the file format. Carlo has proposed a very well thought-through structure for this, and it would be great to get your concrete feedback on this, as I understand this hasn’t really happened yet. To aid in this, e.g. Pierre and/or Sal could try to convert or save your standard data into this structure, and report on any difficulties or ambiguities that he encounters. Based on this I agree it’s best to meet and discuss and iron this out as a next step, however it either has to be next week (ideally Fri?), or after March 12 as I am travelling back-to-back in the meantime. Of course feel free to also meet without me for more technical discussions if this speeds up things. Either way we could then also discuss the file format etc. for the ‘raw’ data that Pierre proposed (and which is indeed very valuable as well). Let me know your thoughts, and let’s keep up the great momentum and excitement on this work! Best, Robert -- Dr. Robert Prevedel Group Leader Cell Biology and Biophysics Unit European Molecular Biology Laboratory Meyerhofstr. 1 69117 Heidelberg, Germany Phone: +49 6221 387-8722 Email: robert.prevedel@embl.de http://www.prevedel.embl.de
On 20.02.2025, at 10:29, Carlo Bevilacqua via Software <software@biobrillouin.org> wrote:
Hi Kareem,
thanks for the suggestion, I agree that it is a good (and easy) way to divide the tasks! Just to be clear, it is not that I don't see the need/advantage of providing some standard treatment going from raw data to standard spectra, it is just that was not my priority when proposing the idea of a unified file format.
Regarding the file format, splitting the one containing the raw data and the treatments from the one containing the spectra and the image in a standard format might be a good solution and we can always merge them at a later stage.
As for the file containing the "standard" spectra, it would be very helpful if you can give some feedback on the structure I originally proposed <https://github.com/prevedel-lab/Brillouin-standard-file/blob/main/docs/Bh5_f...>. Keep in mind that the idea is to be able to associate spectrum/spectra to each pixel in the image, in a way that is independent of the scanning strategy and underlaying technique. I tried to find a solution that works for the techniques I am aware of, considering the peculiarities (e.g. for most VIPA setups there is no absolute frequency axis but only relative to water). If am happy to discuss why I made some specific choices and if you see a better way to achieve the same or see things differently.
Both the 3rd and the 4th of March work for me.
Best, Carlo
On Thu, Feb 20, 2025 at 02:50, Kareem Elsayad via Software <software@biobrillouin.org> wrote: Dear All, (and I guess especially Carlo & Pierre 😊)
I understand both your (main) points concerning what this all should be, and I think this is actually perfect for dividing tasks. The format of the hf or bh5 file being where things meet and what needs to be agreed on.
The thing with raw data is ofcourse that it is variable between instruments and labs, and the conversion to “standard spectra” that can then be fitted etc. is going to be unique (maybe even between experiments in same project). That said, asking people to create some complex file from their data that works with a developed software is also unlikely to get a following.
So (the way I see it) there are basically two parts. Getting from raw data to h5 (or bh5) format which contains the spectra in standard format. And then the whole analysis part and visualization (GUI, pretty features, etc.).
While the latter may get the spotlight, it obviously relies heavily on the former being done right. Given that there are numerous “standard” BLS setup implementations the development of software for getting from raw data to h5 I think makes sense, since the h5 will no doubt be cryptic, and creating a working h5 is not something everyone will want to program by themselves (it is not an insignificant step given we are also trying to ultimately cater to biologists). As such a software that generates the h5 files, with drag and drop features and entering system parameters, for different setups makes sense and will save many labs a headache if they don’t have a good programmer on hand.
So I would suggest that Pierre & Sal lead the work on developing this, while Carlo & Sebastian lead the work on developing the analysis/interface-presentation part. This way things are nicely divided and we just need to agree on the h5 file that is transferred between the two. From the side of Pierre & Sal there could maybe also be a second h5 generated that contains all the raw data and details on how it was converted to the transferred h5 file (for complete transparency this could then also be reported in papers if people wish). These could exist as two separate programs with respective GUIs but also eventually combined to a single one.
How does this sound to everyone?
To clear up details and try assign tasks going forward how about a Zoom first week of March (I would be free Monday 3rd and Tue 4th after 1pm)?
All the best,
Kareem
From: Carlo Bevilacqua via Software <software@biobrillouin.org <mailto:software@biobrillouin.org>> Reply to: Carlo Bevilacqua <carlo.bevilacqua@embl.de <mailto:carlo.bevilacqua@embl.de>> Date: Wednesday, 19. February 2025 at 20:43 To: Pierre Bouvet <pierre.bouvet@meduniwien.ac.at <mailto:pierre.bouvet@meduniwien.ac.at>> Cc: <software@biobrillouin.org <mailto:software@biobrillouin.org>> Subject: [Software] Re: [EXTERN] Re: Software manuscript / BLS microscopy
Hi Pierre,
I realized that we might have slightly different aims.
For me the most important part of this project is to have a unified file format that can be read and visualized by a standard software. The file format you are proposing is not sufficient for that in my opinion. For example one of my main motivation was to have an interface where the user can see the reconstructed image, click on a pixel, see the corresponding spectrum to check its quality and maybe try different fitting functions; that would already not be possible with your structure because the software would have no notion on where the spectral data is stored and how to associate it to a specific pixel.
I don't see the structure of the file to be too complex as an issue, as long as it is functional: we can always provide an API and/or a GUI that allow people to take their spectra and save them in whatever format we decide without bothering about understanding the actual structure, the same way you can work with HDF5 file without having any understanding on how the data is actually stored on the disk.
My idea of making a webapp as a GUI follows directly from there. Typical case: I sent some data to a collaborator and they can just run the app in their browser and check if the outliers they see in the image are real or a bad spectra. Similarly if we make a common database of Brillouin spectra, people can explore it easily using the webapp.
From what I understood, you are instead more interested in going from raw data to an actual spectrum, which I don't see so much as a priority because each lab has their own code already and the actual procedure would be different for each lab (apart from standard instruments like the FP). I am not saying this should not be part of the software but not as a priority and rather has a layer where people can easily implement their own code (of course we could already implement code for standard instruments).
I think it would be good to cleary define what is our common aim now, so we are sure we are working in the same direction.
Let me know if you agree or I misunderstood what is your idea.
Best,
Carlo
On Wed, Feb 19, 2025 at 16:11, Pierre Bouvet <pierre.bouvet@meduniwien.ac.at <mailto:pierre.bouvet@meduniwien.ac.at>> wrote:
Hi,
I think you're trying to go too far too fast. The approach I present here <https://github.com/bio-brillouin/HDF5_BLS/blob/GUI_development/guides/Projec...> is intentionally simple, so that people can very quickly get to storing their data in a HDF5 file format together with the parameters they used to acquire them with minimal effort. The closest to what you did is therefore as follows:
- data are datasets with no other restriction and they are stored in groups
- each group can have a set of attribute proper to the data they are storing
- attributes have a nomenclature imposed by a spreadsheet and are in the form of text
- the default name of a data is the name of a raw data: “Raw_data”, other arrays can have whatever name they want (Shift_5GHz, Frequency, ...)
- arrays and attributes are hierarchical, so they apply to their groups and all groups under it.
This is the bare minimum to meet our needs, so we need to stop here in the definition of the format since it’s already enough to have the GUI working correctly, and therefore the first version of the unified software advertised. Of course we will have to refine things later on, but we don’t want to scare people off by presenting them a file description that for one might not match their measurements and that is extremely hard to conceptually understand. To make my point clearer, take your definition of the format for example: there are 3 different amplitude arrays in your description, two different shift arrays and width arrays that are of different dimension, then we have a calibration group on one side but a spectrometer characterization array in another group that is called “experiment_info”, that’s just too complicated to use correctly. On the other hand, placing your raw data “as is” in a group dedicated to this data is conceptually easy and straightforward.
Where you are right, is that should we have hundreds of people using it, we might in a near future want to store abscissa, impulse responses, … in a standardized manner. In that case, the question falls down to either adding sub-groups or storing the data together with the measure. Both are fine and don’t really pose a problem for now, essentially because we are not trying to visualize the results but just trying to unify the way to get them.
Now regarding Dash, if I understand correctly, it’s just a way to change the frontend you propose? If that’s so, why not, but then I don’t really see the benefits: if you really want to use dash, you can always embed it inside a Qt app. Also Dash being browser based, you will only have one window for the whole interface, which will be a pain to deal with if you want to use the interface to do everything the GUI is expected to do (inspect an H5 file, convert PSD, treat data, edit parameters, inspect a failed treatment, simulate results using setups with slight changes of parameters…). We agree that at one point when people receive an h5 file, it will be useful to have a web interface that can do what yours or Sal’s GUI do (seeing the mapping results together with the spectrum, eventually the time-domain signal) but here again, it’s going too far too soon: let’s first have a simple and reliable GUI that can convert data from any spectrometer to PSDs and treat them with a unified code. This is the real challenge, visualization and nomenclature of results are both important but secondary. Also keep in mind that, the frontend can easily be generated by anyone really, with Copilot or ChatGPT or whatever AI, but you can’t ask them to develop the function that will correctly read your data and convert them to a PSD nor treat the PSD. This is done on the backend and is the priority since the unification essentially happens there.
Best,
Pierre
Pierre Bouvet, PhD
Post-doctoral Fellow
Medical University Vienna
Department of Anatomy and Cell Biology
Wahringer Straße 13, 1090 Wien, Austria
On 19/2/25, at 13:21, Carlo Bevilacqua <carlo.bevilacqua@embl.de <mailto:carlo.bevilacqua@embl.de>> wrote:
Hi Pierre,
thanks for your reply.
Regarding the file structure, what I am still not very clear about is what you define as Raw_data and data, how the actual spectra are stored and how the association to spatial coordinates and parameters is made. That's why I would really appreciate if you could make a document similar to what I did <https://github.com/prevedel-lab/Brillouin-standard-file/blob/main/docs/Bh5_f...>, where it is clear what each group should (or can) contain, what is the shape of each dataset, which attributes they have, etc...
I am not saying that this should be the final structure of the file but I strongly believe that having it written in a structured way helps defining it and seeing potential issues.
Regarding the webapp, it works by separating the frontend, which run in the browser and is responsible of running the GUI, and the backend which is doing the actual computation and that you can structure as you like with multithreading or any optimization you wish. The communication between frontend and backend is handled transparently by the framework, so you don't have to take care of it.
When you run Dash locally a local server is created so the data stays on your computer and there is no issue with data transfer/privacy.
If we want to move it to a server at a later stage, then you are right about the fact that data needs to be transferred to a server (although there might be solutions that allow you to still run the computation on the local browser, like WebAssembly <https://webassembly.org/>, but I think it is too complex to look into this at this stage). Regarding safety and privacy, the data will be stored on the server only for the time that the user is using the app and then deleted (of course we will need to make a disclaimer on the website about this). Regarding space I don't think people at the beginning will load their 1Tb dataset on the webapp but rather look at some small dataset of few tens of Gb; in that case 1Tb of server space is more than enough (remember that the file will be stored only for the time the user is using the app). If people really start to use the webapp and space becomes a limitation, I would be super happy to look into WebAssembly so that the data can be handled locally from the browser without transferring it to the server.
To summarize I would agree that, at this stage, there might be no advantage of a webapp over a local GUI (and might actually be a bit more work to develop it). But, if this project really flies, the potential of a webapp is huge, especially in the context of the BioBrillouin society where we want to have a database of spectral data and the webapp could be used to explore that without downloading anything on your computer. My main point is that moving now to a webapp would not be too much work, but if we want to do it at a later stage it will basically entail re-writing everything from scratch.
Let me know what are your thoughts about it.
Best,
Carlo
On Wed, Feb 19, 2025 at 08:51, Pierre Bouvet <pierre.bouvet@meduniwien.ac.at <mailto:pierre.bouvet@meduniwien.ac.at>> wrote:
Hi Carlo,
You’re right, the format is still a little fuzzy. The main idea is to have a data-based hierarchy for storage: each data is stored in an individual group. From there, abscissa dependent on the data are stored in the same group and the treated data are stored in sub-groups. The names of the groups and sub-groups are fixed (Data_i), as is the name of the raw data (Raw_data) and abscissa (Abscissa_i). Also, the measure and spectrometer-dependent arguments have a defined nomenclature. To differentiate groups between them, we preferably attribute them a name as an attribute that is not used as an identifier, the identifier being either the path to the data/group from file root (Data_0/Data_42/Data_2/Raw_data) or potentially a hash value (not implemented). This I think allows all possible configurations, and using an hierarchical approach we can also pass common attributes and arrays (parameters of the spectrometer or abscissa arrays for example) on parent to reduce memory complexity.
Now regarding the use of server-based GUI, first off, I’ve never used them so I’m just making supposition here but if the platform is able to treat data online, it will have to store the spectra somewhere in memory and it will not be local. My primary concerns with this approach is safety, particularly in terms of intellectual property protection, ethical considerations, and potential security vulnerabilities. Additionally, managing storage space will be a headache.
Now, this doesn’t mean that we can’t have a server-based data plotter, or a server-based interface that does treatments locally but I don’t really see the benefits of this over a local software that can have multiple windows, which could at one point be multithreaded, and that could wrap c code to speed regressions for example (some of this might apply to Dash, I’m not super familiar with it). Now regarding memory complexity, having all the data we treat go on a server is a bad idea as it will raise the question of cost which will very rapidly become a real problem. Just an example: for a 100x100 map, I need 10Gb of memory (1Mo/point) with my setup (1To of archive storage is approximately 1euro/month) so this would get out of hands super fast assuming people use it.
Now maybe there are solutions I don’t see for these problems and someone can take care of them but for me it’s just not worth the effort when having a local GUI solves all of these issues at once. But if you find a solution, then I’ll be happy to migrate to Dash, it won’t be fast to translate every feature but I can totally join you on the platform.
Best,
Pierre
Pierre Bouvet, PhD
Post-doctoral Fellow
Medical University Vienna
Department of Anatomy and Cell Biology
Wahringer Straße 13, 1090 Wien, Austria
On 18/2/25, at 20:26, Carlo Bevilacqua <carlo.bevilacqua@embl.de <mailto:carlo.bevilacqua@embl.de>> wrote:
Hi Pierre,
regarding the structure of the file, I agree that we should keep it simple. I am not suggesting to make it more complex, rather to have a document where we define it in a clear and structured way rather than as a general description, to make sure that we are all on the same page.
I am saying this because, to be honest, I am not sure I fully understand how you are structuring the HDF5 and I think it is important to agree on this now, rather than finding at a later stage that we had different ideas.
Ideally if the GUI should be part of a single application, we should write it using a unified framework.
The reasons why, after considering it for a bit, I lean towards Dash rather than Qt are:
it can run in a web browser so it will be easy to eventually move it to a website, thus people can use it without installing it (which will hopefully help in promoting its use) it is based on plotly <https://plotly.com/python/> which is a graphical library with very good plotting capabilites and highly customizable, that would make the data visualization easier/more appealing Let me know what you think about it and if you see any advantage of Qt over a web app which I am not considering. Also, if we agree that Dash might be a better option, would you consider migrating to Dash? It might not be too much work if most of the code you wrote is for data processing rather that for the GUI itself and I could help you with that. Alternatively one workaround is to have a QtWebEngine <https://doc.qt.io/qtforpython-6/overviews/qtwebengine-overview.html> in your Qt app and have the Dash app run inside that, but that would make only the Dash part portable to a server later on.
Best,
Carlo
On Tue, Feb 18, 2025 at 10:24, Pierre Bouvet <pierre.bouvet@meduniwien.ac.at <mailto:pierre.bouvet@meduniwien.ac.at>> wrote:
Hi,
Thanks,
More than merge them later, just keep them separate in the process and rather than trying to build "one code to do it all", build one library and GUI that encapsulate codes to do everything.
Having a structure is a must but it needs to be kept as simple as possible else we’ll rapidly find situations where we need to change the structure. The middle ground I think is to force the use of hierarchies and impose nomenclatures where problem are expected to appear: each dataset has its own group, each group can encapsulate other groups, each parameter of a group applies to all its sub-groups if the subgroup does not change its value, each array of a group applies to all of its sub-groups if the sub-group does not redefine an array with same name, the names of the groups are held as parameters and their ID are managed by the software.
For the Plotly interface, I don’t know how to integrate it to Qt but if you find a way to do it, that’s perfect with me :)
My vision of the GUI is something that unifies the format and can then execute scripts on the data stored in this format. I have pushed the application of the GUI to my data up to the point where I can do the whole information extraction process from it (add data, convert to PSD, fit curves). I think this could be super interesting if we implement it for all techniques.
I think we could formalize the project in milestones, in particular define the minimal denominator that will allow us to have the paper. The milestone I reached for my spectro encompasses the following points:
- Being able to add data to the file easily (by dragging & dropping to the GUI)
- Being able to assign properties to these data easily (again by dragging & dropping)
- Being able to structure the added data in groups/folders/containers/however we want to call it
- Making it easy for new data types to be loaded
- Allowing data from same type but different structure to be added (e.g. .dat files)
- Execute scripts on the data easily and allowing parameters of these scripts to be defined from the GUI (e.g. select a peak on a curve to fit this peak)
- Make it easy to add scripts for treating or extracting PSD from raw data.
- Allow the export of a Python code to access the data from the file (we cans see them as “break points” in the treatment pipeline)
- Edit of properties inside the GUI
In any case I think we could build a spec sheet for the project with what we want to have in it based on what we want to advertise in the paper. We can always add things later on but if we agree on a strict minimum to have the project advertised, then that will set its first milestone on which we’ll be able to build later on.
Best,
Pierre
Pierre Bouvet, PhD
Post-doctoral Fellow
Medical University Vienna
Department of Anatomy and Cell Biology
Wahringer Straße 13, 1090 Wien, Austria
On 17/2/25, at 14:53, Carlo Bevilacqua via Software <software@biobrillouin.org <mailto:software@biobrillouin.org>> wrote:
Hi Pierre, hi Sal,
thanks for sharing your thoughts about it.
@Pierre I am very sorry that Ren passed away :(
As far as I understood you are suggesting to work on the individual aspects separately and then merge them together at a later stage? I am fine with that but I still think it is very important to now agree on what should be in the file format we are defining, because that is kind of the core of the project and will affect a lot of the design choices.
I am happy to start working on the GUI for data visualization. In my idea, it will be something similar to this <https://www.nature.com/articles/s41592-023-02054-z/figures/10> but written in dash <https://dash.plotly.com/>, so it is a web app that for now can run locally (so no transfer of data to an external server is required) but in the future can easily be uploaded to a website that people can just use without installing anything on their computer.
The question is how much of the data processing should be possible to do (or trigger) from the same GUI? I think at least a drop down menu with different fitting functions should be there, so the user can quickly check the results on a spectrum from a specific point in the image.
@Pierre how are you envisioning the GUI you are working on? As far as I understood it is mainly to get the raw data and save it to our HDF5 format with some treatment on it.
One idea could be to have a shared list of features that we are implementing in the GUI as we work on it, to avoid having the same functionality duplicated (or worst inconsistent) between the GUI for generating our file format and the GUI for visualization.
Let me know what you think about it.
Best,
Carlo
On Mon, Feb 17, 2025 at 11:04, Pierre Bouvet via Software <software@biobrillouin.org <mailto:software@biobrillouin.org>> wrote:
Hi everyone,
Sorry for the delayed response, I just went through the loss of Ren (my dog) and wasn’t at all able to answer.
First of, Sal, I am making progress and I should have everything you have made on your branch integrated to the GUI branch soon, at which point I will push everything to main.
Regarding the project, I think I align with Sal: keep things as simple as possible. My approach was to divide everything in 3 mostly independent layers:
- Store data in an organized file that anyone can use, and make it easy to do
- Convert these data into something that has physical significance: a Power Spectrum Density
- Extract information from this Power Spectrum Density
Each layer has its own challenge but they are independent on the challenge of having people using it: personally, if I had someone come to me with a new software to play with my measures, I would most likely only look at it for 1 minute (or less depending who made it) with a lot of apprehension and then based on how simple it looks and how much I understood of it, use it or - what is most likely - discard it. This is why Project.pdf <https://github.com/bio-brillouin/HDF5_BLS/blob/GUI_development/guides/Projec...> is essentially meant to say: we put data arrays in groups and give them attributes written in text, but you can also create groups within groups to organize your data!
I believe most of the people in the BioBrillouin society will have the same approach and before having something complex that can do a lot, I think it’s best to have something simple that can just unify the format (which in itself is a lot) and that people can use right away with a minimal impact on their own individual pipelines for data processing.
To be honest, I don’t think people will blindly trust our software at first to treat their data, but they will most likely use it at first to organize their raw spectra, and maybe add their own treated data if they are feeling particularly adventurous. But that is not a problem as long as we start a movement. From there yes, we can complexity and create custom file architectures but that is already too complex I think for this first project.
If we can all just import our data to the wrapper and specify their attributes, this will already be a success. Then for the paper, if we can all add a custom code to treat these data to obtain a PSD, I think this will be enough. As I said, the current API already allows you to add your data in a variety of format, so it’s just a question of developing the PSD conversion before having something we can publish (and then tell people to use).
A few extra points:
- Working with my setup, I realized if the user could choose between different algorithms to treat their own data, it would make the overall project much more usable (if an algorithm bugs for whatever reason, you can use another one) so I created 2 bottle necks in the form of functions (for PSD conversion and treatment) that would inspect modules dedicated to either PSD conversion or treatment, and list existing functions. It’s in between classical and modular programming but it makes the development of new PSD conversion code and treatment way way easier
- The GUI is developed using oriented-object programming. Therefore I have already made some low-level choices that kind of impact all the GUI. I’m not saying they are the best choices, I’m just saying that they work, so if you want to work on the GUI, I would either recommend getting familiar with these choices, or making sure that all the functionalities are preserved, particularly the ones that are invisible (logging of treatment steps, treatment errors…)
I’ll try merging the branches on Git asap and will definitely send you all an email when it’s done :)
Best,
Pierre
Pierre Bouvet, PhD
Post-doctoral Fellow
Medical University Vienna
Department of Anatomy and Cell Biology
Wahringer Straße 13, 1090 Wien, Austria
On 14/2/25, at 19:36, Sal La Cavera Iii via Software <software@biobrillouin.org <mailto:software@biobrillouin.org>> wrote:
Hi all,
I agree with the things enumerated and points made by Kareem/Carlo! I guess I would advocate for starting from a position of simplicity. We probably don't want to get weighed down by trying to include a bunch of bells and whistles from the start as these can be easily added once there is a minimally viable stable product.
As long as data can be loaded to local memory, then treated in various (initially simple) ways through the GUI (and maybe maintain non-GUI compatibility for command-line warriors like myself), then the bh5 formatting stuff can be sorted on the back end? I definitely agree with Carlo's structure set out in the file format document; but all of that data will be floating around the memory in some shape or form and just needs to be wrapped up and packaged (according to Carlo's structure e.g.) when the user is happy and presses the "generate h5 filestore" etc. (?)
Definitely agree with the recommendation to create the alpha using mainly requirements that our 3 labs would find useful (import filetypes, treatments, etc), and then we can add on more universal functionality second / get some beta testers in from other labs etc.
I'm able to support on whatever jobs need doing and am free to meet in the beginning of March like you mentioned Kareem.
Hope you guys have a nice weekend,
Cheers,
Sal
---------------------------------------------------------------
Salvatore La Cavera III
Royal Academy of Engineering Research Fellow
Nottingham Research Fellow
Optics and Photonics Group
University of Nottingham Email: salvatore.lacaveraiii@nottingham.ac.uk <mailto:salvatore.lacaveraiii@nottingham.ac.uk> ORCID iD: 0000-0003-0210-3102
<Outlook-tygjxucs.png> <https://outlook.office.com/bookwithme/user/6a3f960a8e89429cb6fc693c01d10119@...>
Book a Coffee and Research chat with me!
From: Carlo Bevilacqua via Software <software@biobrillouin.org <mailto:software@biobrillouin.org>> Sent: 12 February 2025 13:31 To: Kareem Elsayad <kareem.elsayad@meduniwien.ac.at <mailto:kareem.elsayad@meduniwien.ac.at>> Cc: sebastian.hambura@embl.de <mailto:sebastian.hambura@embl.de> <sebastian.hambura@embl.de <mailto:sebastian.hambura@embl.de>>; software@biobrillouin.org <mailto:software@biobrillouin.org> <software@biobrillouin.org <mailto:software@biobrillouin.org>> Subject: [Software] Re: Software manuscript / BLS microscopy
You don't often get email from software@biobrillouin.org <mailto:software@biobrillouin.org>. Learn why this is important <https://aka.ms/LearnAboutSenderIdentification>
Hi Kareem,
thanks for restarting this and sorry for my silence, I just came back from US and was planning to start working on this again.
Could you also add Sebastian (in CC) to the mailing list?
As you outlined, I would split the project into two parts: 1) getting from the raw data to some standard "processed' spectra and 2) do data analysis/visualization on that. For the second part the way I envision it is:
the most updated definition of the file format from Pierre is this one <https://github.com/bio-brillouin/HDF5_BLS/blob/GUI_development/guides/Projec...>, correct? In addition to this document I think it would be good to have a more structured description of the file (like this <https://github.com/prevedel-lab/Brillouin-standard-file/blob/main/docs/Bh5_f...>), where each field is clearly defined in terms of data type and dimensions. Sebastian was also suggesting that the document should contain the reasoning behind each specific choice in the specs and also things that we considered but decided had some issues (so in future we can look back at it). I still believe that the file format should contain the "processed" spectra (i.e. after FT and baseline subtraction for impulsive, or after taking a line profile and possibly linearization with VIPA,...) so we can apply standard data processing or visualization which is independent on the actual underlaying technique (e.g. VIPA, FP, stimulated, time domain, ...) agree on an API to read the data from our file format (most likely a Python class). For that we should: 1) decide on which information is important to extract (spectral information, spatial coordinates, hyper-parameters, metadata,...) 2) implement an interface to read the data (e.g. readSpectrumAtIndex(...), readImage(...), ...) build a GUI that use the previously defined API to show and process the data. I would say that, once we have a very solid description of the file format as in step 1, step 2 will come naturally and we can divide the actual implementation between us. Step 3 can also easily be implemented and divided between us once we have an API (and I am happy to work on the GUI myself).
The first half of the project is the trickiest and I know Pierre has already done a lot of work in that direction. We should definitely agree on which extent we can define a standard to store the raw data, given the variability between labs, (and probably we should do it for common techniques like FP or VIPA) and how to implement the treatments, leaving to possibility to load some custom code in the pipeline to do the conversion.
Let me know what you all think about this.
If you agree I would start by making a document which clearly defines the file format in a structured way (as in my step 1 before). @Pierre could you write a new document or modify the document I originally made <https://github.com/prevedel-lab/Brillouin-standard-file/blob/main/docs/Bh5_f...> to reflect the latest structure you implemented for the file format? The metadata can still be defined in a separated excel sheet, as long as the data type and format is well defined there.
Best regards,
Carlo
On Wed, Feb 12, 2025 at 02:19, Kareem Elsayad via Software <software@biobrillouin.org <mailto:software@biobrillouin.org>> wrote:
Hi Robert, Carlo, Sal, Pierre,
Think it would be good to follow up on software project. Pierre has made some progress here and would be good to try and define tasks a little bit clearer to make progress…
There is always the potential issue of having “too many cooks in the kitchen” (that have different recipes for same thing) to move forward efficiently, something that I noticed can get quite confusing/frustrating when writing software together with people. So would be good to clearly assign tasks. I talked to Pierre today and he would be happy to integrate things in framework we have to try tie things together. What would foremost be needed would be ways of treating data, meaning code that takes a raw spectral image and meta-data and converts it into “standard” format (spectral representation) that can then be fitted. Then also “plugins” that serve a specific purpose in the analysis/rendering that can be included in framework.
The way I see it (and please comment if you see differently), there are ~4 steps here:
Take raw data (in .tif,, .dat, txt, etc. format) and meta data (in .cvs, xlsx, .dat, .txt, etc.) and render a standard spectral presentation. Also take provided instrument response in one of these formats and extract key parameters from this Fit the data with drop-down menu list of functions, that will include different functional dependences and functions corrected for instrument response. Generate/display a visual representation of results (frequency shift(s) and linewidth(s)), that is ideally interactive to some extent (and maybe has some funky features like looking at spectra at different points. These can be spatial maps and/or evolution with some other parameter (time, temperature, angle, etc.). Also be able to display maps of relative peak intensities in case of multiple peak fits, and whatever else useful you can think of. Extract “mechanical” parameters given assigned refractive indices and densities
I think the idea of fitting modified functions (e.g. corrected based on instrument response) vs. deconvolving spectra makes more sense (as can account for more complex corrections due to non-optical anomalies in future –ultimately even functional variations in vicinity of e.g. phase transitions). It is also less error prone, as systematically doing decon with non-ideal registration data can really throw you off the cliff, so to speak.
My understanding is that we kind of agreed on initial meta-data reporting format. Getting from 1 to 2 will no doubt be most challenging as it is very instrument specific. So instructions will need to be written for different BLS implementations.
This is a huge project if we want it to be all inclusive.. so I would suggest to focus on making it work for just a couple of modalities first would be good (e.g. crossed VIPA, time-resolved, anisotropy, and maybe some time or temperature course of one of these). Extensions should then be more easy to navigate. At one point think would be good to involve SBS specific considerations also.
Think would be good to discuss a while per email to gather thoughts and opinions (and already start to share codes), and then plan a meeting beginning of March -- how does first week of March look for everyone?
I created this mailing list (software@biobrillouin.org <mailto:software@biobrillouin.org>) we can use for discussion. You should all be able to post to (and it makes it easier if we bring anyone else in along the way).
At moment on this mailing list is Robert, Carlo, Sal, Pierre and myself. Let me know if I should add anyone.
All the best,
Kareem
This message and any attachment are intended solely for the addressee and may contain confidential information. If you have received this message in error, please contact the sender and delete the email and attachment. Any views or opinions expressed by the author of this email do not necessarily reflect the views of the University of Nottingham. Email communications with the University of Nottingham may be monitored where permitted by law. _______________________________________________ Software mailing list -- software@biobrillouin.org <mailto:software@biobrillouin.org> To unsubscribe send an email to software-leave@biobrillouin.org <mailto:software-leave@biobrillouin.org>
_______________________________________________ Software mailing list -- software@biobrillouin.org <mailto:software@biobrillouin.org> To unsubscribe send an email to software-leave@biobrillouin.org <mailto:software-leave@biobrillouin.org>
_______________________________________________ Software mailing list -- software@biobrillouin.org <mailto:software@biobrillouin.org> To unsubscribe send an email to software-leave@biobrillouin.org <mailto:software-leave@biobrillouin.org>
_______________________________________________ Software mailing list -- software@biobrillouin.org To unsubscribe send an email to software-leave@biobrillouin.org
Hi, My goal with this project is to unify the treatment of BLS spectra, to then allow us to address fundamental biophysical questions with BLS as a community in the mid-long term. Therefore my principal concern for this format is simplicity: measure are datasets called “Raw_data”, if they need one or more abscissa to be understood, this/these abscissa are called “Abscissa_i” and they are placed in groups called “Data_i” where we can store their attributes in the group’s attributes. From there, I can put groups in groups to store an experiment with different ... (e.g. : samples, time points, positions, techniques, wavelengths, patients, …). This structure is trivial but lacks usability so I added an attribute called “Name” to all groups that the user can define as he wants without impacting the structure. Now here are a few critics on Carlo’s approach. I didn’t want to share them because I hate criticizing anyone’s work, and I do think that what Carlo presented is great, but I don’t want you to think that I just trashed what he did, to the contrary, it’s because I see limitations in his approach that I tried developing another, simpler one. So here are the points I have problems with in Carlo’s approach: The preferred type of the information on an experiment should be text as we’ll likely see new devices (like your super nice FT approach) appear in the next months/years that will require new parameters to be defined to describe them. I think we should really try not to use anything else than strings in the attributes. The experiment information should not be defined by the HDF5 file structure but rather by a spreadsheet because everyone knows how to use Excel, and it’s way easier to edit an Excel file than an HDF5 file. Experiment information should apply to measures and not to files, because they might vary from experiment to experiment, I think their preferred allocation is thus the attributes of the groups storing individual measures (in my approach) The characterization of the instrument might also be experiment-dependent (if for some reason you change the tilt of a VIPA during the experiment for example), therefore having a dedicated group for it might not work for some experiments The groups are named “tn” and the structure does not present the nomenclature of sub-groups, this is a big problem if we want to store in the same format say different samples measured at different times (the logic patch would be to have sub-groups follow the same structure so tn/tm/tl/… but it should be mentioned in the definition of the structure) The dataset “index” in Analyzed_data is difficult to understand, what is it used for? I think it’s not useful, I would delete it. The "spatial position" in Analyzed_data supposes that we are doing mappings. This is too restrictive for no reason, it’s better to generalize the abscissa and allow the user to specify a non-limiting parameter (the “Name” attribute for example) with whatever value he wants (position, temperature, concentration of whatever, …). A concrete example of a limit here: angle measurements, I want my data to be dependent on the angle, not the position. Having different datasets in the same “Analyzed_data” group corresponding to the result of different treatments raises the question of where the process followed to treat the data is stored. A better approach would be to create n groups “Analyzed_data_n” with only one dataset of treated values, allowing for the process to be stored in the attributes of the group Analyzed_data_n I don’t understand why store an array of amplitude in “Analyzed_data”, is it for the SNR? Then maybe we could name this array “SNR”? The array “Fit_error_n” is super important but ill defined. I’d rather choose a statistical quantity like the variance, standard deviation (what I think is best), least-square error… and have it apply to both the Shift and Linewidth array as so: “Shift_std” and “Linewidth_std" I don’t understand “Calibration_index”: where are the calibration curves? Are they in “experiment_info”? If so, we expect people to already process their calibration curves to create an array before adding them to the hdf5 file? I’m not very familiar with all devices, so I might not see the limitations here but do we ever have more than one calibration curve per measure? Could we not add it to the group as a “Calibration” dataset? Or just have one group with the calibration curve? Timestamp is typically an attribute, it shouldn’t be present inside the group as an element. In tn/Spectra_n , “Amplitude” is the PSD so I would call it PSD because there are other “Amplitude” datasets so it’s confusing. If it’s not the PSD, I would call it “Raw_data”. I don’t understand what “Parameters” is meant to do in tn/Spectra_n, plus it’s not a dataset so I would put it in attributes or most likely not use it as I don’t understand what it does. Frequency is a dataset, not a float (I think). We also need to have a place where to store the process to obtain it. In VIPA spectrometers for instance this is likely a big (the main even I think) source of error. I would put this process in attributes (as a text). I don’t think “Unit” is useful, if we have a frequency axis, then we should define it directly in GHz, and if it’s a pixel axis, then for one we should not call it “Frequency” and then it’s better not to put anything since by default we will consider the abscissa (in absence of Frequency) as a simple range of the size of the “Amplitude” dataset. /tn/Images: it’s a good idea, but I believe this is redundant with “Analyzed_data” (?) If it’s not then I don’t understand how we get the datasets inside it. “Calibration_spectra” is a separate group, wouldn’t it be better to have it in “Experiment_info” in the presented structure? Also might scare off people that might not want to store a calibration file every time they create a HDF5 file (I might or might not be one of them) Like I said before, I don’t want this to be taken as more than what lead me to defining a new approach to the format. I want to state once again that Carlo's structure is complete, only it’s useful for specific instruments and applications, and difficultly applicable to other techniques and scenarios (and more lazy people like myself). Following Carlo’s mail, I’ve also completed the PDF I made to describe the structure I use in the HDF5_BLS library, I’m joining it to this email and pushing its code to <https://github.com/bio-brillouin/HDF5_BLS/tree/GUI_development/guides/Project>GitHub <https://github.com/bio-brillouin/HDF5_BLS/blob/GUI_development/guides/Projec...>, feel free to edit it and criticize it at length (I feel like I deserve it after this email I really tried not to write). Best, Pierre Pierre Bouvet, PhD Post-doctoral Fellow Medical University Vienna Department of Anatomy and Cell Biology Wahringer Straße 13, 1090 Wien, Austria 
On 20/2/25, at 16:12, Robert Prevedel via Software <software@biobrillouin.org> wrote:
Dear all,
great to see all this discussion in this thread, and thanks to especially Pierre and Carlo for driving this forward. I’ve been following the various emails and arguments closely but simply didn’t have any time to chip in due to some important committments in the past days.
I understand that there was a bit of a disagreement about what the focus of this effort should be, so maybe it just helps to highlight my lab's view on this (which I just discussed in depth with Carlo and Sebastian):
Our original motivation was to come up with and define a common file-format, as we regard this to be key to unify the processing and visualization of Brillouin data by the community. In this respect, we would be happy to focus our efforts on defining this format and taking care of implementing the necessary processing/visualization software and interface that allows anyone to look at the data in the same way. We also regard this to be crucial if we want to standardize the reporting of Brillouin data from diverse setups/users/applications.
Therefore, at this stage it would be extremely important to agree on the structure of the file format. Carlo has proposed a very well thought-through structure for this, and it would be great to get your concrete feedback on this, as I understand this hasn’t really happened yet. To aid in this, e.g. Pierre and/or Sal could try to convert or save your standard data into this structure, and report on any difficulties or ambiguities that he encounters.
Based on this I agree it’s best to meet and discuss and iron this out as a next step, however it either has to be next week (ideally Fri?), or after March 12 as I am travelling back-to-back in the meantime. Of course feel free to also meet without me for more technical discussions if this speeds up things. Either way we could then also discuss the file format etc. for the ‘raw’ data that Pierre proposed (and which is indeed very valuable as well).
Let me know your thoughts, and let’s keep up the great momentum and excitement on this work!
Best,
Robert -- Dr. Robert Prevedel Group Leader Cell Biology and Biophysics Unit European Molecular Biology Laboratory Meyerhofstr. 1 69117 Heidelberg, Germany
Phone: +49 6221 387-8722 Email: robert.prevedel@embl.de http://www.prevedel.embl.de
On 20.02.2025, at 10:29, Carlo Bevilacqua via Software <software@biobrillouin.org> wrote:
Hi Kareem,
thanks for the suggestion, I agree that it is a good (and easy) way to divide the tasks! Just to be clear, it is not that I don't see the need/advantage of providing some standard treatment going from raw data to standard spectra, it is just that was not my priority when proposing the idea of a unified file format.
Regarding the file format, splitting the one containing the raw data and the treatments from the one containing the spectra and the image in a standard format might be a good solution and we can always merge them at a later stage.
As for the file containing the "standard" spectra, it would be very helpful if you can give some feedback on the structure I originally proposed <https://github.com/prevedel-lab/Brillouin-standard-file/blob/main/docs/Bh5_f...>. Keep in mind that the idea is to be able to associate spectrum/spectra to each pixel in the image, in a way that is independent of the scanning strategy and underlaying technique. I tried to find a solution that works for the techniques I am aware of, considering the peculiarities (e.g. for most VIPA setups there is no absolute frequency axis but only relative to water). If am happy to discuss why I made some specific choices and if you see a better way to achieve the same or see things differently.
Both the 3rd and the 4th of March work for me.
Best, Carlo
On Thu, Feb 20, 2025 at 02:50, Kareem Elsayad via Software <software@biobrillouin.org> wrote: Dear All, (and I guess especially Carlo & Pierre 😊)
I understand both your (main) points concerning what this all should be, and I think this is actually perfect for dividing tasks. The format of the hf or bh5 file being where things meet and what needs to be agreed on.
The thing with raw data is ofcourse that it is variable between instruments and labs, and the conversion to “standard spectra” that can then be fitted etc. is going to be unique (maybe even between experiments in same project). That said, asking people to create some complex file from their data that works with a developed software is also unlikely to get a following.
So (the way I see it) there are basically two parts. Getting from raw data to h5 (or bh5) format which contains the spectra in standard format. And then the whole analysis part and visualization (GUI, pretty features, etc.).
While the latter may get the spotlight, it obviously relies heavily on the former being done right. Given that there are numerous “standard” BLS setup implementations the development of software for getting from raw data to h5 I think makes sense, since the h5 will no doubt be cryptic, and creating a working h5 is not something everyone will want to program by themselves (it is not an insignificant step given we are also trying to ultimately cater to biologists). As such a software that generates the h5 files, with drag and drop features and entering system parameters, for different setups makes sense and will save many labs a headache if they don’t have a good programmer on hand.
So I would suggest that Pierre & Sal lead the work on developing this, while Carlo & Sebastian lead the work on developing the analysis/interface-presentation part. This way things are nicely divided and we just need to agree on the h5 file that is transferred between the two. From the side of Pierre & Sal there could maybe also be a second h5 generated that contains all the raw data and details on how it was converted to the transferred h5 file (for complete transparency this could then also be reported in papers if people wish). These could exist as two separate programs with respective GUIs but also eventually combined to a single one.
How does this sound to everyone?
To clear up details and try assign tasks going forward how about a Zoom first week of March (I would be free Monday 3rd and Tue 4th after 1pm)?
All the best,
Kareem
From: Carlo Bevilacqua via Software <software@biobrillouin.org <mailto:software@biobrillouin.org>> Reply to: Carlo Bevilacqua <carlo.bevilacqua@embl.de <mailto:carlo.bevilacqua@embl.de>> Date: Wednesday, 19. February 2025 at 20:43 To: Pierre Bouvet <pierre.bouvet@meduniwien.ac.at <mailto:pierre.bouvet@meduniwien.ac.at>> Cc: <software@biobrillouin.org <mailto:software@biobrillouin.org>> Subject: [Software] Re: [EXTERN] Re: Software manuscript / BLS microscopy
Hi Pierre,
I realized that we might have slightly different aims.
For me the most important part of this project is to have a unified file format that can be read and visualized by a standard software. The file format you are proposing is not sufficient for that in my opinion. For example one of my main motivation was to have an interface where the user can see the reconstructed image, click on a pixel, see the corresponding spectrum to check its quality and maybe try different fitting functions; that would already not be possible with your structure because the software would have no notion on where the spectral data is stored and how to associate it to a specific pixel.
I don't see the structure of the file to be too complex as an issue, as long as it is functional: we can always provide an API and/or a GUI that allow people to take their spectra and save them in whatever format we decide without bothering about understanding the actual structure, the same way you can work with HDF5 file without having any understanding on how the data is actually stored on the disk.
My idea of making a webapp as a GUI follows directly from there. Typical case: I sent some data to a collaborator and they can just run the app in their browser and check if the outliers they see in the image are real or a bad spectra. Similarly if we make a common database of Brillouin spectra, people can explore it easily using the webapp.
From what I understood, you are instead more interested in going from raw data to an actual spectrum, which I don't see so much as a priority because each lab has their own code already and the actual procedure would be different for each lab (apart from standard instruments like the FP). I am not saying this should not be part of the software but not as a priority and rather has a layer where people can easily implement their own code (of course we could already implement code for standard instruments).
I think it would be good to cleary define what is our common aim now, so we are sure we are working in the same direction.
Let me know if you agree or I misunderstood what is your idea.
Best,
Carlo
On Wed, Feb 19, 2025 at 16:11, Pierre Bouvet <pierre.bouvet@meduniwien.ac.at <mailto:pierre.bouvet@meduniwien.ac.at>> wrote:
Hi,
I think you're trying to go too far too fast. The approach I present here <https://github.com/bio-brillouin/HDF5_BLS/blob/GUI_development/guides/Projec...> is intentionally simple, so that people can very quickly get to storing their data in a HDF5 file format together with the parameters they used to acquire them with minimal effort. The closest to what you did is therefore as follows:
- data are datasets with no other restriction and they are stored in groups
- each group can have a set of attribute proper to the data they are storing
- attributes have a nomenclature imposed by a spreadsheet and are in the form of text
- the default name of a data is the name of a raw data: “Raw_data”, other arrays can have whatever name they want (Shift_5GHz, Frequency, ...)
- arrays and attributes are hierarchical, so they apply to their groups and all groups under it.
This is the bare minimum to meet our needs, so we need to stop here in the definition of the format since it’s already enough to have the GUI working correctly, and therefore the first version of the unified software advertised. Of course we will have to refine things later on, but we don’t want to scare people off by presenting them a file description that for one might not match their measurements and that is extremely hard to conceptually understand. To make my point clearer, take your definition of the format for example: there are 3 different amplitude arrays in your description, two different shift arrays and width arrays that are of different dimension, then we have a calibration group on one side but a spectrometer characterization array in another group that is called “experiment_info”, that’s just too complicated to use correctly. On the other hand, placing your raw data “as is” in a group dedicated to this data is conceptually easy and straightforward.
Where you are right, is that should we have hundreds of people using it, we might in a near future want to store abscissa, impulse responses, … in a standardized manner. In that case, the question falls down to either adding sub-groups or storing the data together with the measure. Both are fine and don’t really pose a problem for now, essentially because we are not trying to visualize the results but just trying to unify the way to get them.
Now regarding Dash, if I understand correctly, it’s just a way to change the frontend you propose? If that’s so, why not, but then I don’t really see the benefits: if you really want to use dash, you can always embed it inside a Qt app. Also Dash being browser based, you will only have one window for the whole interface, which will be a pain to deal with if you want to use the interface to do everything the GUI is expected to do (inspect an H5 file, convert PSD, treat data, edit parameters, inspect a failed treatment, simulate results using setups with slight changes of parameters…). We agree that at one point when people receive an h5 file, it will be useful to have a web interface that can do what yours or Sal’s GUI do (seeing the mapping results together with the spectrum, eventually the time-domain signal) but here again, it’s going too far too soon: let’s first have a simple and reliable GUI that can convert data from any spectrometer to PSDs and treat them with a unified code. This is the real challenge, visualization and nomenclature of results are both important but secondary. Also keep in mind that, the frontend can easily be generated by anyone really, with Copilot or ChatGPT or whatever AI, but you can’t ask them to develop the function that will correctly read your data and convert them to a PSD nor treat the PSD. This is done on the backend and is the priority since the unification essentially happens there.
Best,
Pierre
Pierre Bouvet, PhD
Post-doctoral Fellow
Medical University Vienna
Department of Anatomy and Cell Biology
Wahringer Straße 13, 1090 Wien, Austria
On 19/2/25, at 13:21, Carlo Bevilacqua <carlo.bevilacqua@embl.de <mailto:carlo.bevilacqua@embl.de>> wrote:
Hi Pierre,
thanks for your reply.
Regarding the file structure, what I am still not very clear about is what you define as Raw_data and data, how the actual spectra are stored and how the association to spatial coordinates and parameters is made. That's why I would really appreciate if you could make a document similar to what I did <https://github.com/prevedel-lab/Brillouin-standard-file/blob/main/docs/Bh5_f...>, where it is clear what each group should (or can) contain, what is the shape of each dataset, which attributes they have, etc...
I am not saying that this should be the final structure of the file but I strongly believe that having it written in a structured way helps defining it and seeing potential issues.
Regarding the webapp, it works by separating the frontend, which run in the browser and is responsible of running the GUI, and the backend which is doing the actual computation and that you can structure as you like with multithreading or any optimization you wish. The communication between frontend and backend is handled transparently by the framework, so you don't have to take care of it.
When you run Dash locally a local server is created so the data stays on your computer and there is no issue with data transfer/privacy.
If we want to move it to a server at a later stage, then you are right about the fact that data needs to be transferred to a server (although there might be solutions that allow you to still run the computation on the local browser, like WebAssembly <https://webassembly.org/>, but I think it is too complex to look into this at this stage). Regarding safety and privacy, the data will be stored on the server only for the time that the user is using the app and then deleted (of course we will need to make a disclaimer on the website about this). Regarding space I don't think people at the beginning will load their 1Tb dataset on the webapp but rather look at some small dataset of few tens of Gb; in that case 1Tb of server space is more than enough (remember that the file will be stored only for the time the user is using the app). If people really start to use the webapp and space becomes a limitation, I would be super happy to look into WebAssembly so that the data can be handled locally from the browser without transferring it to the server.
To summarize I would agree that, at this stage, there might be no advantage of a webapp over a local GUI (and might actually be a bit more work to develop it). But, if this project really flies, the potential of a webapp is huge, especially in the context of the BioBrillouin society where we want to have a database of spectral data and the webapp could be used to explore that without downloading anything on your computer. My main point is that moving now to a webapp would not be too much work, but if we want to do it at a later stage it will basically entail re-writing everything from scratch.
Let me know what are your thoughts about it.
Best,
Carlo
On Wed, Feb 19, 2025 at 08:51, Pierre Bouvet <pierre.bouvet@meduniwien.ac.at <mailto:pierre.bouvet@meduniwien.ac.at>> wrote:
Hi Carlo,
You’re right, the format is still a little fuzzy. The main idea is to have a data-based hierarchy for storage: each data is stored in an individual group. From there, abscissa dependent on the data are stored in the same group and the treated data are stored in sub-groups. The names of the groups and sub-groups are fixed (Data_i), as is the name of the raw data (Raw_data) and abscissa (Abscissa_i). Also, the measure and spectrometer-dependent arguments have a defined nomenclature. To differentiate groups between them, we preferably attribute them a name as an attribute that is not used as an identifier, the identifier being either the path to the data/group from file root (Data_0/Data_42/Data_2/Raw_data) or potentially a hash value (not implemented). This I think allows all possible configurations, and using an hierarchical approach we can also pass common attributes and arrays (parameters of the spectrometer or abscissa arrays for example) on parent to reduce memory complexity.
Now regarding the use of server-based GUI, first off, I’ve never used them so I’m just making supposition here but if the platform is able to treat data online, it will have to store the spectra somewhere in memory and it will not be local. My primary concerns with this approach is safety, particularly in terms of intellectual property protection, ethical considerations, and potential security vulnerabilities. Additionally, managing storage space will be a headache.
Now, this doesn’t mean that we can’t have a server-based data plotter, or a server-based interface that does treatments locally but I don’t really see the benefits of this over a local software that can have multiple windows, which could at one point be multithreaded, and that could wrap c code to speed regressions for example (some of this might apply to Dash, I’m not super familiar with it). Now regarding memory complexity, having all the data we treat go on a server is a bad idea as it will raise the question of cost which will very rapidly become a real problem. Just an example: for a 100x100 map, I need 10Gb of memory (1Mo/point) with my setup (1To of archive storage is approximately 1euro/month) so this would get out of hands super fast assuming people use it.
Now maybe there are solutions I don’t see for these problems and someone can take care of them but for me it’s just not worth the effort when having a local GUI solves all of these issues at once. But if you find a solution, then I’ll be happy to migrate to Dash, it won’t be fast to translate every feature but I can totally join you on the platform.
Best,
Pierre
Pierre Bouvet, PhD
Post-doctoral Fellow
Medical University Vienna
Department of Anatomy and Cell Biology
Wahringer Straße 13, 1090 Wien, Austria
On 18/2/25, at 20:26, Carlo Bevilacqua <carlo.bevilacqua@embl.de <mailto:carlo.bevilacqua@embl.de>> wrote:
Hi Pierre,
regarding the structure of the file, I agree that we should keep it simple. I am not suggesting to make it more complex, rather to have a document where we define it in a clear and structured way rather than as a general description, to make sure that we are all on the same page.
I am saying this because, to be honest, I am not sure I fully understand how you are structuring the HDF5 and I think it is important to agree on this now, rather than finding at a later stage that we had different ideas.
Ideally if the GUI should be part of a single application, we should write it using a unified framework.
The reasons why, after considering it for a bit, I lean towards Dash rather than Qt are:
it can run in a web browser so it will be easy to eventually move it to a website, thus people can use it without installing it (which will hopefully help in promoting its use) it is based on plotly <https://plotly.com/python/> which is a graphical library with very good plotting capabilites and highly customizable, that would make the data visualization easier/more appealing Let me know what you think about it and if you see any advantage of Qt over a web app which I am not considering. Also, if we agree that Dash might be a better option, would you consider migrating to Dash? It might not be too much work if most of the code you wrote is for data processing rather that for the GUI itself and I could help you with that. Alternatively one workaround is to have a QtWebEngine <https://doc.qt.io/qtforpython-6/overviews/qtwebengine-overview.html> in your Qt app and have the Dash app run inside that, but that would make only the Dash part portable to a server later on.
Best,
Carlo
On Tue, Feb 18, 2025 at 10:24, Pierre Bouvet <pierre.bouvet@meduniwien.ac.at <mailto:pierre.bouvet@meduniwien.ac.at>> wrote:
Hi,
Thanks,
More than merge them later, just keep them separate in the process and rather than trying to build "one code to do it all", build one library and GUI that encapsulate codes to do everything.
Having a structure is a must but it needs to be kept as simple as possible else we’ll rapidly find situations where we need to change the structure. The middle ground I think is to force the use of hierarchies and impose nomenclatures where problem are expected to appear: each dataset has its own group, each group can encapsulate other groups, each parameter of a group applies to all its sub-groups if the subgroup does not change its value, each array of a group applies to all of its sub-groups if the sub-group does not redefine an array with same name, the names of the groups are held as parameters and their ID are managed by the software.
For the Plotly interface, I don’t know how to integrate it to Qt but if you find a way to do it, that’s perfect with me :)
My vision of the GUI is something that unifies the format and can then execute scripts on the data stored in this format. I have pushed the application of the GUI to my data up to the point where I can do the whole information extraction process from it (add data, convert to PSD, fit curves). I think this could be super interesting if we implement it for all techniques.
I think we could formalize the project in milestones, in particular define the minimal denominator that will allow us to have the paper. The milestone I reached for my spectro encompasses the following points:
- Being able to add data to the file easily (by dragging & dropping to the GUI)
- Being able to assign properties to these data easily (again by dragging & dropping)
- Being able to structure the added data in groups/folders/containers/however we want to call it
- Making it easy for new data types to be loaded
- Allowing data from same type but different structure to be added (e.g. .dat files)
- Execute scripts on the data easily and allowing parameters of these scripts to be defined from the GUI (e.g. select a peak on a curve to fit this peak)
- Make it easy to add scripts for treating or extracting PSD from raw data.
- Allow the export of a Python code to access the data from the file (we cans see them as “break points” in the treatment pipeline)
- Edit of properties inside the GUI
In any case I think we could build a spec sheet for the project with what we want to have in it based on what we want to advertise in the paper. We can always add things later on but if we agree on a strict minimum to have the project advertised, then that will set its first milestone on which we’ll be able to build later on.
Best,
Pierre
Pierre Bouvet, PhD
Post-doctoral Fellow
Medical University Vienna
Department of Anatomy and Cell Biology
Wahringer Straße 13, 1090 Wien, Austria
On 17/2/25, at 14:53, Carlo Bevilacqua via Software <software@biobrillouin.org <mailto:software@biobrillouin.org>> wrote:
Hi Pierre, hi Sal,
thanks for sharing your thoughts about it.
@Pierre I am very sorry that Ren passed away :(
As far as I understood you are suggesting to work on the individual aspects separately and then merge them together at a later stage? I am fine with that but I still think it is very important to now agree on what should be in the file format we are defining, because that is kind of the core of the project and will affect a lot of the design choices.
I am happy to start working on the GUI for data visualization. In my idea, it will be something similar to this <https://www.nature.com/articles/s41592-023-02054-z/figures/10> but written in dash <https://dash.plotly.com/>, so it is a web app that for now can run locally (so no transfer of data to an external server is required) but in the future can easily be uploaded to a website that people can just use without installing anything on their computer.
The question is how much of the data processing should be possible to do (or trigger) from the same GUI? I think at least a drop down menu with different fitting functions should be there, so the user can quickly check the results on a spectrum from a specific point in the image.
@Pierre how are you envisioning the GUI you are working on? As far as I understood it is mainly to get the raw data and save it to our HDF5 format with some treatment on it.
One idea could be to have a shared list of features that we are implementing in the GUI as we work on it, to avoid having the same functionality duplicated (or worst inconsistent) between the GUI for generating our file format and the GUI for visualization.
Let me know what you think about it.
Best,
Carlo
On Mon, Feb 17, 2025 at 11:04, Pierre Bouvet via Software <software@biobrillouin.org <mailto:software@biobrillouin.org>> wrote:
Hi everyone,
Sorry for the delayed response, I just went through the loss of Ren (my dog) and wasn’t at all able to answer.
First of, Sal, I am making progress and I should have everything you have made on your branch integrated to the GUI branch soon, at which point I will push everything to main.
Regarding the project, I think I align with Sal: keep things as simple as possible. My approach was to divide everything in 3 mostly independent layers:
- Store data in an organized file that anyone can use, and make it easy to do
- Convert these data into something that has physical significance: a Power Spectrum Density
- Extract information from this Power Spectrum Density
Each layer has its own challenge but they are independent on the challenge of having people using it: personally, if I had someone come to me with a new software to play with my measures, I would most likely only look at it for 1 minute (or less depending who made it) with a lot of apprehension and then based on how simple it looks and how much I understood of it, use it or - what is most likely - discard it. This is why Project.pdf <https://github.com/bio-brillouin/HDF5_BLS/blob/GUI_development/guides/Projec...> is essentially meant to say: we put data arrays in groups and give them attributes written in text, but you can also create groups within groups to organize your data!
I believe most of the people in the BioBrillouin society will have the same approach and before having something complex that can do a lot, I think it’s best to have something simple that can just unify the format (which in itself is a lot) and that people can use right away with a minimal impact on their own individual pipelines for data processing.
To be honest, I don’t think people will blindly trust our software at first to treat their data, but they will most likely use it at first to organize their raw spectra, and maybe add their own treated data if they are feeling particularly adventurous. But that is not a problem as long as we start a movement. From there yes, we can complexity and create custom file architectures but that is already too complex I think for this first project.
If we can all just import our data to the wrapper and specify their attributes, this will already be a success. Then for the paper, if we can all add a custom code to treat these data to obtain a PSD, I think this will be enough. As I said, the current API already allows you to add your data in a variety of format, so it’s just a question of developing the PSD conversion before having something we can publish (and then tell people to use).
A few extra points:
- Working with my setup, I realized if the user could choose between different algorithms to treat their own data, it would make the overall project much more usable (if an algorithm bugs for whatever reason, you can use another one) so I created 2 bottle necks in the form of functions (for PSD conversion and treatment) that would inspect modules dedicated to either PSD conversion or treatment, and list existing functions. It’s in between classical and modular programming but it makes the development of new PSD conversion code and treatment way way easier
- The GUI is developed using oriented-object programming. Therefore I have already made some low-level choices that kind of impact all the GUI. I’m not saying they are the best choices, I’m just saying that they work, so if you want to work on the GUI, I would either recommend getting familiar with these choices, or making sure that all the functionalities are preserved, particularly the ones that are invisible (logging of treatment steps, treatment errors…)
I’ll try merging the branches on Git asap and will definitely send you all an email when it’s done :)
Best,
Pierre
Pierre Bouvet, PhD
Post-doctoral Fellow
Medical University Vienna
Department of Anatomy and Cell Biology
Wahringer Straße 13, 1090 Wien, Austria
On 14/2/25, at 19:36, Sal La Cavera Iii via Software <software@biobrillouin.org <mailto:software@biobrillouin.org>> wrote:
Hi all,
I agree with the things enumerated and points made by Kareem/Carlo! I guess I would advocate for starting from a position of simplicity. We probably don't want to get weighed down by trying to include a bunch of bells and whistles from the start as these can be easily added once there is a minimally viable stable product.
As long as data can be loaded to local memory, then treated in various (initially simple) ways through the GUI (and maybe maintain non-GUI compatibility for command-line warriors like myself), then the bh5 formatting stuff can be sorted on the back end? I definitely agree with Carlo's structure set out in the file format document; but all of that data will be floating around the memory in some shape or form and just needs to be wrapped up and packaged (according to Carlo's structure e.g.) when the user is happy and presses the "generate h5 filestore" etc. (?)
Definitely agree with the recommendation to create the alpha using mainly requirements that our 3 labs would find useful (import filetypes, treatments, etc), and then we can add on more universal functionality second / get some beta testers in from other labs etc.
I'm able to support on whatever jobs need doing and am free to meet in the beginning of March like you mentioned Kareem.
Hope you guys have a nice weekend,
Cheers,
Sal
---------------------------------------------------------------
Salvatore La Cavera III
Royal Academy of Engineering Research Fellow
Nottingham Research Fellow
Optics and Photonics Group
University of Nottingham Email: salvatore.lacaveraiii@nottingham.ac.uk <mailto:salvatore.lacaveraiii@nottingham.ac.uk> ORCID iD: 0000-0003-0210-3102
<Outlook-tygjxucs.png> <https://outlook.office.com/bookwithme/user/6a3f960a8e89429cb6fc693c01d10119@...>
Book a Coffee and Research chat with me!
From: Carlo Bevilacqua via Software <software@biobrillouin.org <mailto:software@biobrillouin.org>> Sent: 12 February 2025 13:31 To: Kareem Elsayad <kareem.elsayad@meduniwien.ac.at <mailto:kareem.elsayad@meduniwien.ac.at>> Cc: sebastian.hambura@embl.de <mailto:sebastian.hambura@embl.de> <sebastian.hambura@embl.de <mailto:sebastian.hambura@embl.de>>; software@biobrillouin.org <mailto:software@biobrillouin.org> <software@biobrillouin.org <mailto:software@biobrillouin.org>> Subject: [Software] Re: Software manuscript / BLS microscopy
You don't often get email from software@biobrillouin.org <mailto:software@biobrillouin.org>. Learn why this is important <https://aka.ms/LearnAboutSenderIdentification>
Hi Kareem,
thanks for restarting this and sorry for my silence, I just came back from US and was planning to start working on this again.
Could you also add Sebastian (in CC) to the mailing list?
As you outlined, I would split the project into two parts: 1) getting from the raw data to some standard "processed' spectra and 2) do data analysis/visualization on that. For the second part the way I envision it is:
the most updated definition of the file format from Pierre is this one <https://github.com/bio-brillouin/HDF5_BLS/blob/GUI_development/guides/Projec...>, correct? In addition to this document I think it would be good to have a more structured description of the file (like this <https://github.com/prevedel-lab/Brillouin-standard-file/blob/main/docs/Bh5_f...>), where each field is clearly defined in terms of data type and dimensions. Sebastian was also suggesting that the document should contain the reasoning behind each specific choice in the specs and also things that we considered but decided had some issues (so in future we can look back at it). I still believe that the file format should contain the "processed" spectra (i.e. after FT and baseline subtraction for impulsive, or after taking a line profile and possibly linearization with VIPA,...) so we can apply standard data processing or visualization which is independent on the actual underlaying technique (e.g. VIPA, FP, stimulated, time domain, ...) agree on an API to read the data from our file format (most likely a Python class). For that we should: 1) decide on which information is important to extract (spectral information, spatial coordinates, hyper-parameters, metadata,...) 2) implement an interface to read the data (e.g. readSpectrumAtIndex(...), readImage(...), ...) build a GUI that use the previously defined API to show and process the data. I would say that, once we have a very solid description of the file format as in step 1, step 2 will come naturally and we can divide the actual implementation between us. Step 3 can also easily be implemented and divided between us once we have an API (and I am happy to work on the GUI myself).
The first half of the project is the trickiest and I know Pierre has already done a lot of work in that direction. We should definitely agree on which extent we can define a standard to store the raw data, given the variability between labs, (and probably we should do it for common techniques like FP or VIPA) and how to implement the treatments, leaving to possibility to load some custom code in the pipeline to do the conversion.
Let me know what you all think about this.
If you agree I would start by making a document which clearly defines the file format in a structured way (as in my step 1 before). @Pierre could you write a new document or modify the document I originally made <https://github.com/prevedel-lab/Brillouin-standard-file/blob/main/docs/Bh5_f...> to reflect the latest structure you implemented for the file format? The metadata can still be defined in a separated excel sheet, as long as the data type and format is well defined there.
Best regards,
Carlo
On Wed, Feb 12, 2025 at 02:19, Kareem Elsayad via Software <software@biobrillouin.org <mailto:software@biobrillouin.org>> wrote:
Hi Robert, Carlo, Sal, Pierre,
Think it would be good to follow up on software project. Pierre has made some progress here and would be good to try and define tasks a little bit clearer to make progress…
There is always the potential issue of having “too many cooks in the kitchen” (that have different recipes for same thing) to move forward efficiently, something that I noticed can get quite confusing/frustrating when writing software together with people. So would be good to clearly assign tasks. I talked to Pierre today and he would be happy to integrate things in framework we have to try tie things together. What would foremost be needed would be ways of treating data, meaning code that takes a raw spectral image and meta-data and converts it into “standard” format (spectral representation) that can then be fitted. Then also “plugins” that serve a specific purpose in the analysis/rendering that can be included in framework.
The way I see it (and please comment if you see differently), there are ~4 steps here:
Take raw data (in .tif,, .dat, txt, etc. format) and meta data (in .cvs, xlsx, .dat, .txt, etc.) and render a standard spectral presentation. Also take provided instrument response in one of these formats and extract key parameters from this Fit the data with drop-down menu list of functions, that will include different functional dependences and functions corrected for instrument response. Generate/display a visual representation of results (frequency shift(s) and linewidth(s)), that is ideally interactive to some extent (and maybe has some funky features like looking at spectra at different points. These can be spatial maps and/or evolution with some other parameter (time, temperature, angle, etc.). Also be able to display maps of relative peak intensities in case of multiple peak fits, and whatever else useful you can think of. Extract “mechanical” parameters given assigned refractive indices and densities
I think the idea of fitting modified functions (e.g. corrected based on instrument response) vs. deconvolving spectra makes more sense (as can account for more complex corrections due to non-optical anomalies in future –ultimately even functional variations in vicinity of e.g. phase transitions). It is also less error prone, as systematically doing decon with non-ideal registration data can really throw you off the cliff, so to speak.
My understanding is that we kind of agreed on initial meta-data reporting format. Getting from 1 to 2 will no doubt be most challenging as it is very instrument specific. So instructions will need to be written for different BLS implementations.
This is a huge project if we want it to be all inclusive.. so I would suggest to focus on making it work for just a couple of modalities first would be good (e.g. crossed VIPA, time-resolved, anisotropy, and maybe some time or temperature course of one of these). Extensions should then be more easy to navigate. At one point think would be good to involve SBS specific considerations also.
Think would be good to discuss a while per email to gather thoughts and opinions (and already start to share codes), and then plan a meeting beginning of March -- how does first week of March look for everyone?
I created this mailing list (software@biobrillouin.org <mailto:software@biobrillouin.org>) we can use for discussion. You should all be able to post to (and it makes it easier if we bring anyone else in along the way).
At moment on this mailing list is Robert, Carlo, Sal, Pierre and myself. Let me know if I should add anyone.
All the best,
Kareem
This message and any attachment are intended solely for the addressee and may contain confidential information. If you have received this message in error, please contact the sender and delete the email and attachment. Any views or opinions expressed by the author of this email do not necessarily reflect the views of the University of Nottingham. Email communications with the University of Nottingham may be monitored where permitted by law. _______________________________________________ Software mailing list -- software@biobrillouin.org <mailto:software@biobrillouin.org> To unsubscribe send an email to software-leave@biobrillouin.org <mailto:software-leave@biobrillouin.org>
_______________________________________________ Software mailing list -- software@biobrillouin.org <mailto:software@biobrillouin.org> To unsubscribe send an email to software-leave@biobrillouin.org <mailto:software-leave@biobrillouin.org>
_______________________________________________ Software mailing list -- software@biobrillouin.org <mailto:software@biobrillouin.org> To unsubscribe send an email to software-leave@biobrillouin.org <mailto:software-leave@biobrillouin.org>
_______________________________________________ Software mailing list -- software@biobrillouin.org To unsubscribe send an email to software-leave@biobrillouin.org
_______________________________________________ Software mailing list -- software@biobrillouin.org To unsubscribe send an email to software-leave@biobrillouin.org
Hi Pierre, thank you for your feedback. I appreciate that you took the time to go through my definition and highlighting the critical points. I much prefer this rather than starting working with a file format where problem might arise in the future. If we understand what are the reasons behind our choices in the definition we can merge the best of the two approaches, rather than defining two "standards" for the same thing with each of them having their limitations. I will provide an answer to each of the points you raised (I gave numbers to the points in your email below, so it is easier to reference): * I am not sure to which attribute you are referring specifically, but I am completely fine with text; I defined enums where I felt it makes sense to do so because there is a discrete number of options (one could always add elements at the end of an enum) * I defined the attributes before we started working together and I am very much open to changing them so they reflect what you have in the spreadsheet; in the document defining the file format we can just state that the attributes and their type are defined in the excel sheet * I did it this way because in my idea an individual HDF5 file corresponds to a single experiment. If you feel there is an advantage in keeping different experiments in the same file I am open to introduce your structure of subgroups; I honestly feel like this will only make the file unnecessarly large and different experiments would mostly not share much (apart from the metadata, which is anyway a small overhead in terms of filesize). Now of course the question is what you define as an 'experiment': for me different timepoints or measurements at different temperatures/angles/etc on the same sample are a single experiment and I defined the file so that it is possible to save them in a single file; measurements on different samples are not the same experiment in my original idea * same as the point 3 * same as before, I would put different samples in different files but happy to introduce your structure if you feel there is an advantage * the index is used to uniquely identify an entry in the 'Analysed_data' table; it is important in the contest of reconstructing the image (see the definition of the 'tn/image' group) * in my opinion spatial coordinates have a privileged role since we are doing imaging and having them well defined it is important to reconstruct the image; for different abscissas I defined the 'parameters' dataset (more in point 14). If one is not doing imaging this dataset can be set to an empty array or a single element (we can include this in the definition) * in my idea the "Analyzed_data" group doesn't contain multiple treatments but the result of the fit on the 'final' spectra, which are unique; if you are referring to the 'n' in the 'Shift_n_GHz' that is included in case a multipeak fit is performed. Now, if we want to include the possibility of multiple treatments like you are doing (which I didn't originally consider) we could just add an additional layer to the hierarchy * that is the amplitude of the peak from the fit. I am not sure if you didn't understand what I meant or you think it is not an useful information * The fit error actually contains 2 quantities: R2 and RMSE (as defined in the type). I am not sure how you would calculate a std from a single spectrum * the calibration curves are stored in the 'calibration_spectra' group with the name of the dataset matching the respective 'Calibration_index'. In our VIPA setup we are acquiring multiple calibration curves during a single acquisition to compensate for laser drift, that's why I introduced the possibility of having multiple calibration curves. Note that the 'Calibration_index' is defined as optional exactly because it might not be needed * each spectrum can have its own timestamp if it is acquired from a different camera image or scan of a FP, etc that's why it needs to be a dataset. Note that it is an optional dataset * good point, we can rename it to PSD * that is exactly to account for the general case of the abscissa not being a spatial coordinate and it contains the values for the parameters (e.g. the angles in an angle resolved measurement). It is a dataset whose dimensions are defined in the description (happy to elaborate more if it is not clear) * float is the type of each element; it is a dataset whose dimensions are defined in the description; the way to define the frequency axis in general for setups which don't have an absolute frequency (like VIPAs) is tricky and would be good to brainstorm about possibile solutions * as for the name we can change it, but the problem on how to deal with the situation when one doesn't have the frequency in GHz remains. My idea here was to leave the possibility of different units because the fit and most of the data analysis can be performed even if the x-axis is not in GHz and the actual conversion of the shift to GHz can be done at the end and requires the calibration data. As in my previous point, I am happy to brainstorm different solutions to this problem * it is indeed redundant with 'Analyzed_data' and I pushed a change on GitHub to correct this * see point 11; also note that the group is optional (in case people don't need it) and I introduced the attribute "same_as" to avoid repeating it multiple times if it is always the same for all the 'tn' As you see we agree with some of the points or we could find a common solution, for others it was mainly a misunderstanding on what were my intentions (probably my bad in expressing them, but you could have asked if it was not clear). Hope this helps claryfing my reasoning in the file definition and I am happy to discuss all the open points. I will look in details at your newest definition that you shared in the next days. Best, Carlo On Thu, Feb 20, 2025 at 18:25, Pierre Bouvet via Software wrote: Hi, My goal with this project is to unify the treatment of BLS spectra, to then allow us to address fundamental biophysical questions with BLS as a community in the mid-long term. Therefore my principal concern for this format is simplicity: measure are datasets called “Raw_data”, if they need one or more abscissa to be understood, this/these abscissa are called “Abscissa_i” and they are placed in groups called “Data_i” where we can store their attributes in the group’s attributes. From there, I can put groups in groups to store an experiment with different ... (e.g. : samples, time points, positions, techniques, wavelengths, patients, …). This structure is trivial but lacks usability so I added an attribute called “Name” to all groups that the user can define as he wants without impacting the structure. Now here are a few critics on Carlo’s approach. I didn’t want to share them because I hate criticizing anyone’s work, and I do think that what Carlo presented is great, but I don’t want you to think that I just trashed what he did, to the contrary, it’s because I see limitations in his approach that I tried developing another, simpler one. So here are the points I have problems with in Carlo’s approach: * The preferred type of the information on an experiment should be text as we’ll likely see new devices (like your super nice FT approach) appear in the next months/years that will require new parameters to be defined to describe them. I think we should really try not to use anything else than strings in the attributes. * The experiment information should not be defined by the HDF5 file structure but rather by a spreadsheet because everyone knows how to use Excel, and it’s way easier to edit an Excel file than an HDF5 file. * Experiment information should apply to measures and not to files, because they might vary from experiment to experiment, I think their preferred allocation is thus the attributes of the groups storing individual measures (in my approach) * The characterization of the instrument might also be experiment-dependent (if for some reason you change the tilt of a VIPA during the experiment for example), therefore having a dedicated group for it might not work for some experiments * The groups are named “tn” and the structure does not present the nomenclature of sub-groups, this is a big problem if we want to store in the same format say different samples measured at different times (the logic patch would be to have sub-groups follow the same structure so tn/tm/tl/… but it should be mentioned in the definition of the structure) * The dataset “index” in Analyzed_data is difficult to understand, what is it used for? I think it’s not useful, I would delete it. * The "spatial position" in Analyzed_data supposes that we are doing mappings. This is too restrictive for no reason, it’s better to generalize the abscissa and allow the user to specify a non-limiting parameter (the “Name” attribute for example) with whatever value he wants (position, temperature, concentration of whatever, …). A concrete example of a limit here: angle measurements, I want my data to be dependent on the angle, not the position. * Having different datasets in the same “Analyzed_data” group corresponding to the result of different treatments raises the question of where the process followed to treat the data is stored. A better approach would be to create n groups “Analyzed_data_n” with only one dataset of treated values, allowing for the process to be stored in the attributes of the group Analyzed_data_n * I don’t understand why store an array of amplitude in “Analyzed_data”, is it for the SNR? Then maybe we could name this array “SNR”? * The array “Fit_error_n” is super important but ill defined. I’d rather choose a statistical quantity like the variance, standard deviation (what I think is best), least-square error… and have it apply to both the Shift and Linewidth array as so: “Shift_std” and “Linewidth_std" * I don’t understand “Calibration_index”: where are the calibration curves? Are they in “experiment_info”? If so, we expect people to already process their calibration curves to create an array before adding them to the hdf5 file? I’m not very familiar with all devices, so I might not see the limitations here but do we ever have more than one calibration curve per measure? Could we not add it to the group as a “Calibration” dataset? Or just have one group with the calibration curve? * Timestamp is typically an attribute, it shouldn’t be present inside the group as an element. * In tn/Spectra_n , “Amplitude” is the PSD so I would call it PSD because there are other “Amplitude” datasets so it’s confusing. If it’s not the PSD, I would call it “Raw_data”. * I don’t understand what “Parameters” is meant to do in tn/Spectra_n, plus it’s not a dataset so I would put it in attributes or most likely not use it as I don’t understand what it does. * Frequency is a dataset, not a float (I think). We also need to have a place where to store the process to obtain it. In VIPA spectrometers for instance this is likely a big (the main even I think) source of error. I would put this process in attributes (as a text). * I don’t think “Unit” is useful, if we have a frequency axis, then we should define it directly in GHz, and if it’s a pixel axis, then for one we should not call it “Frequency” and then it’s better not to put anything since by default we will consider the abscissa (in absence of Frequency) as a simple range of the size of the “Amplitude” dataset. * /tn/Images: it’s a good idea, but I believe this is redundant with “Analyzed_data” (?) If it’s not then I don’t understand how we get the datasets inside it. * “Calibration_spectra” is a separate group, wouldn’t it be better to have it in “Experiment_info” in the presented structure? Also might scare off people that might not want to store a calibration file every time they create a HDF5 file (I might or might not be one of them) Like I said before, I don’t want this to be taken as more than what lead me to defining a new approach to the format. I want to state once again that Carlo's structure is complete, only it’s useful for specific instruments and applications, and difficultly applicable to other techniques and scenarios (and more lazy people like myself). Following Carlo’s mail, I’ve also completed the PDF I made to describe the structure I use in the HDF5_BLS library, I’m joining it to this email and pushing its code to GitHub (https://github.com/bio-brillouin/HDF5_BLS/tree/GUI_development/guides/Projec...), feel free to edit it and criticize it at length (I feel like I deserve it after this email I really tried not to write). Best, Pierre Pierre Bouvet, PhD Post-doctoral Fellow Medical University Vienna Department of Anatomy and Cell Biology Wahringer Straße 13, 1090 Wien, Austria On 20/2/25, at 16:12, Robert Prevedel via Software wrote: Dear all, great to see all this discussion in this thread, and thanks to especially Pierre and Carlo for driving this forward. I’ve been following the various emails and arguments closely but simply didn’t have any time to chip in due to some important committments in the past days. I understand that there was a bit of a disagreement about what the focus of this effort should be, so maybe it just helps to highlight my lab's view on this (which I just discussed in depth with Carlo and Sebastian): Our original motivation was to come up with and define a common file-format, as we regard this to be key to unify the processing and visualization of Brillouin data by the community. In this respect, we would be happy to focus our efforts on defining this format and taking care of implementing the necessary processing/visualization software and interface that allows anyone to look at the data in the same way. We also regard this to be crucial if we want to standardize the reporting of Brillouin data from diverse setups/users/applications. Therefore, at this stage it would be extremely important to agree on the structure of the file format. Carlo has proposed a very well thought-through structure for this, and it would be great to get your concrete feedback on this, as I understand this hasn’t really happened yet. To aid in this, e.g. Pierre and/or Sal could try to convert or save your standard data into this structure, and report on any difficulties or ambiguities that he encounters. Based on this I agree it’s best to meet and discuss and iron this out as a next step, however it either has to be next week (ideally Fri?), or after March 12 as I am travelling back-to-back in the meantime. Of course feel free to also meet without me for more technical discussions if this speeds up things. Either way we could then also discuss the file format etc. for the ‘raw’ data that Pierre proposed (and which is indeed very valuable as well). Let me know your thoughts, and let’s keep up the great momentum and excitement on this work! Best, Robert -- Dr. Robert Prevedel Group Leader Cell Biology and Biophysics Unit European Molecular Biology Laboratory Meyerhofstr. 1 69117 Heidelberg, Germany Phone: +49 6221 387-8722 Email: robert.prevedel@embl.de (mailto:robert.prevedel@embl.de)http://www.prevedel.embl.de (http://www.prevedel.embl.de) On 20.02.2025, at 10:29, Carlo Bevilacqua via Software wrote: Hi Kareem, thanks for the suggestion, I agree that it is a good (and easy) way to divide the tasks! Just to be clear, it is not that I don't see the need/advantage of providing some standard treatment going from raw data to standard spectra, it is just that was not my priority when proposing the idea of a unified file format. Regarding the file format, splitting the one containing the raw data and the treatments from the one containing the spectra and the image in a standard format might be a good solution and we can always merge them at a later stage. As for the file containing the "standard" spectra, it would be very helpful if you can give some feedback on the structure I originally proposed (https://github.com/prevedel-lab/Brillouin-standard-file/blob/main/docs/Bh5_f...). Keep in mind that the idea is to be able to associate spectrum/spectra to each pixel in the image, in a way that is independent of the scanning strategy and underlaying technique. I tried to find a solution that works for the techniques I am aware of, considering the peculiarities (e.g. for most VIPA setups there is no absolute frequency axis but only relative to water). If am happy to discuss why I made some specific choices and if you see a better way to achieve the same or see things differently. Both the 3rd and the 4th of March work for me. Best, Carlo On Thu, Feb 20, 2025 at 02:50, Kareem Elsayad via Software wrote: Dear All, (and I guess especially Carlo & Pierre 😊) I understand both your (main) points concerning what this all should be, and I think this is actually perfect for dividing tasks. The format of the hf or bh5 file being where things meet and what needs to be agreed on. The thing with raw data is ofcourse that it is variable between instruments and labs, and the conversion to “standard spectra” that can then be fitted etc. is going to be unique (maybe even between experiments in same project). That said, asking people to create some complex file from their data that works with a developed software is also unlikely to get a following. So (the way I see it) there are basically two parts. Getting from raw data to h5 (or bh5) format which contains the spectra in standard format. And then the whole analysis part and visualization (GUI, pretty features, etc.). While the latter may get the spotlight, it obviously relies heavily on the former being done right. Given that there are numerous “standard” BLS setup implementations the development of software for getting from raw data to h5 I think makes sense, since the h5 will no doubt be cryptic, and creating a working h5 is not something everyone will want to program by themselves (it is not an insignificant step given we are also trying to ultimately cater to biologists). As such a software that generates the h5 files, with drag and drop features and entering system parameters, for different setups makes sense and will save many labs a headache if they don’t have a good programmer on hand. So I would suggest that Pierre & Sal lead the work on developing this, while Carlo & Sebastian lead the work on developing the analysis/interface-presentation part. This way things are nicely divided and we just need to agree on the h5 file that is transferred between the two. From the side of Pierre & Sal there could maybe also be a second h5 generated that contains all the raw data and details on how it was converted to the transferred h5 file (for complete transparency this could then also be reported in papers if people wish). These could exist as two separate programs with respective GUIs but also eventually combined to a single one. How does this sound to everyone? To clear up details and try assign tasks going forward how about a Zoom first week of March (I would be free Monday 3rd and Tue 4th after 1pm)? All the best, Kareem From: Carlo Bevilacqua via Software Reply to: Carlo Bevilacqua Date: Wednesday, 19. February 2025 at 20:43 To: Pierre Bouvet Cc: Subject: [Software] Re: [EXTERN] Re: Software manuscript / BLS microscopy Hi Pierre, I realized that we might have slightly different aims. For me the most important part of this project is to have a unified file format that can be read and visualized by a standard software. The file format you are proposing is not sufficient for that in my opinion. For example one of my main motivation was to have an interface where the user can see the reconstructed image, click on a pixel, see the corresponding spectrum to check its quality and maybe try different fitting functions; that would already not be possible with your structure because the software would have no notion on where the spectral data is stored and how to associate it to a specific pixel. I don't see the structure of the file to be too complex as an issue, as long as it is functional: we can always provide an API and/or a GUI that allow people to take their spectra and save them in whatever format we decide without bothering about understanding the actual structure, the same way you can work with HDF5 file without having any understanding on how the data is actually stored on the disk. My idea of making a webapp as a GUI follows directly from there. Typical case: I sent some data to a collaborator and they can just run the app in their browser and check if the outliers they see in the image are real or a bad spectra. Similarly if we make a common database of Brillouin spectra, people can explore it easily using the webapp. From what I understood, you are instead more interested in going from raw data to an actual spectrum, which I don't see so much as a priority because each lab has their own code already and the actual procedure would be different for each lab (apart from standard instruments like the FP). I am not saying this should not be part of the software but not as a priority and rather has a layer where people can easily implement their own code (of course we could already implement code for standard instruments). I think it would be good to cleary define what is our common aim now, so we are sure we are working in the same direction. Let me know if you agree or I misunderstood what is your idea. Best, Carlo On Wed, Feb 19, 2025 at 16:11, Pierre Bouvet wrote: Hi, I think you're trying to go too far too fast. The approach I present here (https://github.com/bio-brillouin/HDF5_BLS/blob/GUI_development/guides/Projec...) is intentionally simple, so that people can very quickly get to storing their data in a HDF5 file format together with the parameters they used to acquire them with minimal effort. The closest to what you did is therefore as follows: - data are datasets with no other restriction and they are stored in groups - each group can have a set of attribute proper to the data they are storing - attributes have a nomenclature imposed by a spreadsheet and are in the form of text - the default name of a data is the name of a raw data: “Raw_data”, other arrays can have whatever name they want (Shift_5GHz, Frequency, ...) - arrays and attributes are hierarchical, so they apply to their groups and all groups under it. This is the bare minimum to meet our needs, so we need to stop here in the definition of the format since it’s already enough to have the GUI working correctly, and therefore the first version of the unified software advertised. Of course we will have to refine things later on, but we don’t want to scare people off by presenting them a file description that for one might not match their measurements and that is extremely hard to conceptually understand. To make my point clearer, take your definition of the format for example: there are 3 different amplitude arrays in your description, two different shift arrays and width arrays that are of different dimension, then we have a calibration group on one side but a spectrometer characterization array in another group that is called “experiment_info”, that’s just too complicated to use correctly. On the other hand, placing your raw data “as is” in a group dedicated to this data is conceptually easy and straightforward. Where you are right, is that should we have hundreds of people using it, we might in a near future want to store abscissa, impulse responses, … in a standardized manner. In that case, the question falls down to either adding sub-groups or storing the data together with the measure. Both are fine and don’t really pose a problem for now, essentially because we are not trying to visualize the results but just trying to unify the way to get them. Now regarding Dash, if I understand correctly, it’s just a way to change the frontend you propose? If that’s so, why not, but then I don’t really see the benefits: if you really want to use dash, you can always embed it inside a Qt app. Also Dash being browser based, you will only have one window for the whole interface, which will be a pain to deal with if you want to use the interface to do everything the GUI is expected to do (inspect an H5 file, convert PSD, treat data, edit parameters, inspect a failed treatment, simulate results using setups with slight changes of parameters…). We agree that at one point when people receive an h5 file, it will be useful to have a web interface that can do what yours or Sal’s GUI do (seeing the mapping results together with the spectrum, eventually the time-domain signal) but here again, it’s going too far too soon: let’s first have a simple and reliable GUI that can convert data from any spectrometer to PSDs and treat them with a unified code. This is the real challenge, visualization and nomenclature of results are both important but secondary. Also keep in mind that, the frontend can easily be generated by anyone really, with Copilot or ChatGPT or whatever AI, but you can’t ask them to develop the function that will correctly read your data and convert them to a PSD nor treat the PSD. This is done on the backend and is the priority since the unification essentially happens there. Best, Pierre Pierre Bouvet, PhD Post-doctoral Fellow Medical University Vienna Department of Anatomy and Cell Biology Wahringer Straße 13, 1090 Wien, Austria On 19/2/25, at 13:21, Carlo Bevilacqua wrote: Hi Pierre, thanks for your reply. Regarding the file structure, what I am still not very clear about is what you define as Raw_data and data, how the actual spectra are stored and how the association to spatial coordinates and parameters is made. That's why I would really appreciate if you could make a document similar to what I did (https://github.com/prevedel-lab/Brillouin-standard-file/blob/main/docs/Bh5_f...), where it is clear what each group should (or can) contain, what is the shape of each dataset, which attributes they have, etc... I am not saying that this should be the final structure of the file but I strongly believe that having it written in a structured way helps defining it and seeing potential issues. Regarding the webapp, it works by separating the frontend, which run in the browser and is responsible of running the GUI, and the backend which is doing the actual computation and that you can structure as you like with multithreading or any optimization you wish. The communication between frontend and backend is handled transparently by the framework, so you don't have to take care of it. When you run Dash locally a local server is created so the data stays on your computer and there is no issue with data transfer/privacy. If we want to move it to a server at a later stage, then you are right about the fact that data needs to be transferred to a server (although there might be solutions that allow you to still run the computation on the local browser, like WebAssembly (https://webassembly.org/), but I think it is too complex to look into this at this stage). Regarding safety and privacy, the data will be stored on the server only for the time that the user is using the app and then deleted (of course we will need to make a disclaimer on the website about this). Regarding space I don't think people at the beginning will load their 1Tb dataset on the webapp but rather look at some small dataset of few tens of Gb; in that case 1Tb of server space is more than enough (remember that the file will be stored only for the time the user is using the app). If people really start to use the webapp and space becomes a limitation, I would be super happy to look into WebAssembly so that the data can be handled locally from the browser without transferring it to the server. To summarize I would agree that, at this stage, there might be no advantage of a webapp over a local GUI (and might actually be a bit more work to develop it). But, if this project really flies, the potential of a webapp is huge, especially in the context of the BioBrillouin society where we want to have a database of spectral data and the webapp could be used to explore that without downloading anything on your computer. My main point is that moving now to a webapp would not be too much work, but if we want to do it at a later stage it will basically entail re-writing everything from scratch. Let me know what are your thoughts about it. Best, Carlo On Wed, Feb 19, 2025 at 08:51, Pierre Bouvet wrote: Hi Carlo, You’re right, the format is still a little fuzzy. The main idea is to have a data-based hierarchy for storage: each data is stored in an individual group. From there, abscissa dependent on the data are stored in the same group and the treated data are stored in sub-groups. The names of the groups and sub-groups are fixed (Data_i), as is the name of the raw data (Raw_data) and abscissa (Abscissa_i). Also, the measure and spectrometer-dependent arguments have a defined nomenclature. To differentiate groups between them, we preferably attribute them a name as an attribute that is not used as an identifier, the identifier being either the path to the data/group from file root (Data_0/Data_42/Data_2/Raw_data) or potentially a hash value (not implemented). This I think allows all possible configurations, and using an hierarchical approach we can also pass common attributes and arrays (parameters of the spectrometer or abscissa arrays for example) on parent to reduce memory complexity. Now regarding the use of server-based GUI, first off, I’ve never used them so I’m just making supposition here but if the platform is able to treat data online, it will have to store the spectra somewhere in memory and it will not be local. My primary concerns with this approach is safety, particularly in terms of intellectual property protection, ethical considerations, and potential security vulnerabilities. Additionally, managing storage space will be a headache. Now, this doesn’t mean that we can’t have a server-based data plotter, or a server-based interface that does treatments locally but I don’t really see the benefits of this over a local software that can have multiple windows, which could at one point be multithreaded, and that could wrap c code to speed regressions for example (some of this might apply to Dash, I’m not super familiar with it). Now regarding memory complexity, having all the data we treat go on a server is a bad idea as it will raise the question of cost which will very rapidly become a real problem. Just an example: for a 100x100 map, I need 10Gb of memory (1Mo/point) with my setup (1To of archive storage is approximately 1euro/month) so this would get out of hands super fast assuming people use it. Now maybe there are solutions I don’t see for these problems and someone can take care of them but for me it’s just not worth the effort when having a local GUI solves all of these issues at once. But if you find a solution, then I’ll be happy to migrate to Dash, it won’t be fast to translate every feature but I can totally join you on the platform. Best, Pierre Pierre Bouvet, PhD Post-doctoral Fellow Medical University Vienna Department of Anatomy and Cell Biology Wahringer Straße 13, 1090 Wien, Austria On 18/2/25, at 20:26, Carlo Bevilacqua wrote: Hi Pierre, regarding the structure of the file, I agree that we should keep it simple. I am not suggesting to make it more complex, rather to have a document where we define it in a clear and structured way rather than as a general description, to make sure that we are all on the same page. I am saying this because, to be honest, I am not sure I fully understand how you are structuring the HDF5 and I think it is important to agree on this now, rather than finding at a later stage that we had different ideas. Ideally if the GUI should be part of a single application, we should write it using a unified framework. The reasons why, after considering it for a bit, I lean towards Dash rather than Qt are: * it can run in a web browser so it will be easy to eventually move it to a website, thus people can use it without installing it (which will hopefully help in promoting its use) * it is based on plotly (https://plotly.com/python/) which is a graphical library with very good plotting capabilites and highly customizable, that would make the data visualization easier/more appealing Let me know what you think about it and if you see any advantage of Qt over a web app which I am not considering. Also, if we agree that Dash might be a better option, would you consider migrating to Dash? It might not be too much work if most of the code you wrote is for data processing rather that for the GUI itself and I could help you with that. Alternatively one workaround is to have a QtWebEngine (https://doc.qt.io/qtforpython-6/overviews/qtwebengine-overview.html) in your Qt app and have the Dash app run inside that, but that would make only the Dash part portable to a server later on. Best, Carlo On Tue, Feb 18, 2025 at 10:24, Pierre Bouvet wrote: Hi, Thanks, More than merge them later, just keep them separate in the process and rather than trying to build "one code to do it all", build one library and GUI that encapsulate codes to do everything. Having a structure is a must but it needs to be kept as simple as possible else we’ll rapidly find situations where we need to change the structure. The middle ground I think is to force the use of hierarchies and impose nomenclatures where problem are expected to appear: each dataset has its own group, each group can encapsulate other groups, each parameter of a group applies to all its sub-groups if the subgroup does not change its value, each array of a group applies to all of its sub-groups if the sub-group does not redefine an array with same name, the names of the groups are held as parameters and their ID are managed by the software. For the Plotly interface, I don’t know how to integrate it to Qt but if you find a way to do it, that’s perfect with me :) My vision of the GUI is something that unifies the format and can then execute scripts on the data stored in this format. I have pushed the application of the GUI to my data up to the point where I can do the whole information extraction process from it (add data, convert to PSD, fit curves). I think this could be super interesting if we implement it for all techniques. I think we could formalize the project in milestones, in particular define the minimal denominator that will allow us to have the paper. The milestone I reached for my spectro encompasses the following points: - Being able to add data to the file easily (by dragging & dropping to the GUI) - Being able to assign properties to these data easily (again by dragging & dropping) - Being able to structure the added data in groups/folders/containers/however we want to call it - Making it easy for new data types to be loaded - Allowing data from same type but different structure to be added (e.g. .dat files) - Execute scripts on the data easily and allowing parameters of these scripts to be defined from the GUI (e.g. select a peak on a curve to fit this peak) - Make it easy to add scripts for treating or extracting PSD from raw data. - Allow the export of a Python code to access the data from the file (we cans see them as “break points” in the treatment pipeline) - Edit of properties inside the GUI In any case I think we could build a spec sheet for the project with what we want to have in it based on what we want to advertise in the paper. We can always add things later on but if we agree on a strict minimum to have the project advertised, then that will set its first milestone on which we’ll be able to build later on. Best, Pierre Pierre Bouvet, PhD Post-doctoral Fellow Medical University Vienna Department of Anatomy and Cell Biology Wahringer Straße 13, 1090 Wien, Austria On 17/2/25, at 14:53, Carlo Bevilacqua via Software wrote: Hi Pierre, hi Sal, thanks for sharing your thoughts about it. @Pierre I am very sorry that Ren passed away :( As far as I understood you are suggesting to work on the individual aspects separately and then merge them together at a later stage? I am fine with that but I still think it is very important to now agree on what should be in the file format we are defining, because that is kind of the core of the project and will affect a lot of the design choices. I am happy to start working on the GUI for data visualization. In my idea, it will be something similar to this (https://www.nature.com/articles/s41592-023-02054-z/figures/10) but written in dash (https://dash.plotly.com/), so it is a web app that for now can run locally (so no transfer of data to an external server is required) but in the future can easily be uploaded to a website that people can just use without installing anything on their computer. The question is how much of the data processing should be possible to do (or trigger) from the same GUI? I think at least a drop down menu with different fitting functions should be there, so the user can quickly check the results on a spectrum from a specific point in the image. @Pierre how are you envisioning the GUI you are working on? As far as I understood it is mainly to get the raw data and save it to our HDF5 format with some treatment on it. One idea could be to have a shared list of features that we are implementing in the GUI as we work on it, to avoid having the same functionality duplicated (or worst inconsistent) between the GUI for generating our file format and the GUI for visualization. Let me know what you think about it. Best, Carlo On Mon, Feb 17, 2025 at 11:04, Pierre Bouvet via Software wrote: Hi everyone, Sorry for the delayed response, I just went through the loss of Ren (my dog) and wasn’t at all able to answer. First of, Sal, I am making progress and I should have everything you have made on your branch integrated to the GUI branch soon, at which point I will push everything to main. Regarding the project, I think I align with Sal: keep things as simple as possible. My approach was to divide everything in 3 mostly independent layers: - Store data in an organized file that anyone can use, and make it easy to do - Convert these data into something that has physical significance: a Power Spectrum Density - Extract information from this Power Spectrum Density Each layer has its own challenge but they are independent on the challenge of having people using it: personally, if I had someone come to me with a new software to play with my measures, I would most likely only look at it for 1 minute (or less depending who made it) with a lot of apprehension and then based on how simple it looks and how much I understood of it, use it or - what is most likely - discard it. This is why Project.pdf (https://github.com/bio-brillouin/HDF5_BLS/blob/GUI_development/guides/Projec...) is essentially meant to say: we put data arrays in groups and give them attributes written in text, but you can also create groups within groups to organize your data! I believe most of the people in the BioBrillouin society will have the same approach and before having something complex that can do a lot, I think it’s best to have something simple that can just unify the format (which in itself is a lot) and that people can use right away with a minimal impact on their own individual pipelines for data processing. To be honest, I don’t think people will blindly trust our software at first to treat their data, but they will most likely use it at first to organize their raw spectra, and maybe add their own treated data if they are feeling particularly adventurous. But that is not a problem as long as we start a movement. From there yes, we can complexity and create custom file architectures but that is already too complex I think for this first project. If we can all just import our data to the wrapper and specify their attributes, this will already be a success. Then for the paper, if we can all add a custom code to treat these data to obtain a PSD, I think this will be enough. As I said, the current API already allows you to add your data in a variety of format, so it’s just a question of developing the PSD conversion before having something we can publish (and then tell people to use). A few extra points: - Working with my setup, I realized if the user could choose between different algorithms to treat their own data, it would make the overall project much more usable (if an algorithm bugs for whatever reason, you can use another one) so I created 2 bottle necks in the form of functions (for PSD conversion and treatment) that would inspect modules dedicated to either PSD conversion or treatment, and list existing functions. It’s in between classical and modular programming but it makes the development of new PSD conversion code and treatment way way easier - The GUI is developed using oriented-object programming. Therefore I have already made some low-level choices that kind of impact all the GUI. I’m not saying they are the best choices, I’m just saying that they work, so if you want to work on the GUI, I would either recommend getting familiar with these choices, or making sure that all the functionalities are preserved, particularly the ones that are invisible (logging of treatment steps, treatment errors…) I’ll try merging the branches on Git asap and will definitely send you all an email when it’s done :) Best, Pierre Pierre Bouvet, PhD Post-doctoral Fellow Medical University Vienna Department of Anatomy and Cell Biology Wahringer Straße 13, 1090 Wien, Austria On 14/2/25, at 19:36, Sal La Cavera Iii via Software wrote: Hi all, I agree with the things enumerated and points made by Kareem/Carlo! I guess I would advocate for starting from a position of simplicity. We probably don't want to get weighed down by trying to include a bunch of bells and whistles from the start as these can be easily added once there is a minimally viable stable product. As long as data can be loaded to local memory, then treated in various (initially simple) ways through the GUI (and maybe maintain non-GUI compatibility for command-line warriors like myself), then the bh5 formatting stuff can be sorted on the back end? I definitely agree with Carlo's structure set out in the file format document; but all of that data will be floating around the memory in some shape or form and just needs to be wrapped up and packaged (according to Carlo's structure e.g.) when the user is happy and presses the "generate h5 filestore" etc. (?) Definitely agree with the recommendation to create the alpha using mainly requirements that our 3 labs would find useful (import filetypes, treatments, etc), and then we can add on more universal functionality second / get some beta testers in from other labs etc. I'm able to support on whatever jobs need doing and am free to meet in the beginning of March like you mentioned Kareem. Hope you guys have a nice weekend, Cheers, Sal --------------------------------------------------------------- Salvatore La Cavera III Royal Academy of Engineering Research Fellow Nottingham Research Fellow Optics and Photonics Group University of Nottingham Email: salvatore.lacaveraiii@nottingham.ac.uk (mailto:salvatore.lacaveraiii@nottingham.ac.uk) ORCID iD: 0000-0003-0210-3102 (https://outlook.office.com/bookwithme/user/6a3f960a8e89429cb6fc693c01d10119@...) Book a Coffee and Research chat with me! ------------------------------------ From: Carlo Bevilacqua via Software Sent: 12 February 2025 13:31 To: Kareem Elsayad Cc: sebastian.hambura@embl.de (mailto:sebastian.hambura@embl.de) ; software@biobrillouin.org (mailto:software@biobrillouin.org) Subject: [Software] Re: Software manuscript / BLS microscopy You don't often get email from software@biobrillouin.org (mailto:software@biobrillouin.org). Learn why this is important (https://aka.ms/LearnAboutSenderIdentification) Hi Kareem, thanks for restarting this and sorry for my silence, I just came back from US and was planning to start working on this again. Could you also add Sebastian (in CC) to the mailing list? As you outlined, I would split the project into two parts: 1) getting from the raw data to some standard "processed' spectra and 2) do data analysis/visualization on that. For the second part the way I envision it is: * the most updated definition of the file format from Pierre is this one (https://github.com/bio-brillouin/HDF5_BLS/blob/GUI_development/guides/Projec...), correct? In addition to this document I think it would be good to have a more structured description of the file (like this (https://github.com/prevedel-lab/Brillouin-standard-file/blob/main/docs/Bh5_f...)), where each field is clearly defined in terms of data type and dimensions. Sebastian was also suggesting that the document should contain the reasoning behind each specific choice in the specs and also things that we considered but decided had some issues (so in future we can look back at it). I still believe that the file format should contain the "processed" spectra (i.e. after FT and baseline subtraction for impulsive, or after taking a line profile and possibly linearization with VIPA,...) so we can apply standard data processing or visualization which is independent on the actual underlaying technique (e.g. VIPA, FP, stimulated, time domain, ...) * agree on an API to read the data from our file format (most likely a Python class). For that we should: 1) decide on which information is important to extract (spectral information, spatial coordinates, hyper-parameters, metadata,...) 2) implement an interface to read the data (e.g. readSpectrumAtIndex(...), readImage(...), ...) * build a GUI that use the previously defined API to show and process the data. I would say that, once we have a very solid description of the file format as in step 1, step 2 will come naturally and we can divide the actual implementation between us. Step 3 can also easily be implemented and divided between us once we have an API (and I am happy to work on the GUI myself). The first half of the project is the trickiest and I know Pierre has already done a lot of work in that direction. We should definitely agree on which extent we can define a standard to store the raw data, given the variability between labs, (and probably we should do it for common techniques like FP or VIPA) and how to implement the treatments, leaving to possibility to load some custom code in the pipeline to do the conversion. Let me know what you all think about this. If you agree I would start by making a document which clearly defines the file format in a structured way (as in my step 1 before). @Pierre could you write a new document or modify the document I originally made (https://github.com/prevedel-lab/Brillouin-standard-file/blob/main/docs/Bh5_f...) to reflect the latest structure you implemented for the file format? The metadata can still be defined in a separated excel sheet, as long as the data type and format is well defined there. Best regards, Carlo On Wed, Feb 12, 2025 at 02:19, Kareem Elsayad via Software wrote: Hi Robert, Carlo, Sal, Pierre, Think it would be good to follow up on software project. Pierre has made some progress here and would be good to try and define tasks a little bit clearer to make progress… There is always the potential issue of having “too many cooks in the kitchen” (that have different recipes for same thing) to move forward efficiently, something that I noticed can get quite confusing/frustrating when writing software together with people. So would be good to clearly assign tasks. I talked to Pierre today and he would be happy to integrate things in framework we have to try tie things together. What would foremost be needed would be ways of treating data, meaning code that takes a raw spectral image and meta-data and converts it into “standard” format (spectral representation) that can then be fitted. Then also “plugins” that serve a specific purpose in the analysis/rendering that can be included in framework. The way I see it (and please comment if you see differently), there are ~4 steps here: * Take raw data (in .tif,, .dat, txt, etc. format) and meta data (in .cvs, xlsx, .dat, .txt, etc.) and render a standard spectral presentation. Also take provided instrument response in one of these formats and extract key parameters from this * Fit the data with drop-down menu list of functions, that will include different functional dependences and functions corrected for instrument response. * Generate/display a visual representation of results (frequency shift(s) and linewidth(s)), that is ideally interactive to some extent (and maybe has some funky features like looking at spectra at different points. These can be spatial maps and/or evolution with some other parameter (time, temperature, angle, etc.). Also be able to display maps of relative peak intensities in case of multiple peak fits, and whatever else useful you can think of. * Extract “mechanical” parameters given assigned refractive indices and densities I think the idea of fitting modified functions (e.g. corrected based on instrument response) vs. deconvolving spectra makes more sense (as can account for more complex corrections due to non-optical anomalies in future –ultimately even functional variations in vicinity of e.g. phase transitions). It is also less error prone, as systematically doing decon with non-ideal registration data can really throw you off the cliff, so to speak. My understanding is that we kind of agreed on initial meta-data reporting format. Getting from 1 to 2 will no doubt be most challenging as it is very instrument specific. So instructions will need to be written for different BLS implementations. This is a huge project if we want it to be all inclusive.. so I would suggest to focus on making it work for just a couple of modalities first would be good (e.g. crossed VIPA, time-resolved, anisotropy, and maybe some time or temperature course of one of these). Extensions should then be more easy to navigate. At one point think would be good to involve SBS specific considerations also. Think would be good to discuss a while per email to gather thoughts and opinions (and already start to share codes), and then plan a meeting beginning of March -- how does first week of March look for everyone? I created this mailing list (software@biobrillouin.org (mailto:software@biobrillouin.org)) we can use for discussion. You should all be able to post to (and it makes it easier if we bring anyone else in along the way). At moment on this mailing list is Robert, Carlo, Sal, Pierre and myself. Let me know if I should add anyone. All the best, Kareem This message and any attachment are intended solely for the addressee and may contain confidential information. If you have received this message in error, please contact the sender and delete the email and attachment. Any views or opinions expressed by the author of this email do not necessarily reflect the views of the University of Nottingham. Email communications with the University of Nottingham may be monitored where permitted by law. _______________________________________________ Software mailing list -- software@biobrillouin.org (mailto:software@biobrillouin.org) To unsubscribe send an email to software-leave@biobrillouin.org (mailto:software-leave@biobrillouin.org) _______________________________________________ Software mailing list -- software@biobrillouin.org (mailto:software@biobrillouin.org) To unsubscribe send an email to software-leave@biobrillouin.org (mailto:software-leave@biobrillouin.org) _______________________________________________ Software mailing list -- software@biobrillouin.org (mailto:software@biobrillouin.org) To unsubscribe send an email to software-leave@biobrillouin.org (mailto:software-leave@biobrillouin.org) _______________________________________________ Software mailing list -- software@biobrillouin.org (mailto:software@biobrillouin.org) To unsubscribe send an email to software-leave@biobrillouin.org (mailto:software-leave@biobrillouin.org) _______________________________________________ Software mailing list -- software@biobrillouin.org (mailto:software@biobrillouin.org) To unsubscribe send an email to software-leave@biobrillouin.org (mailto:software-leave@biobrillouin.org)
Hi Carlo, Thanks for your reply, here is the next pong of this ping pong series ^^ 1- I was talking indeed about the enums, but also the parameters that are defined as integers or floating point numbers and uint32. I think its easier (and that we already agreed on) having a spreadsheet with the parameters (easy to use, easy to update, easy to store and modify between two experiments using the same setup, allows to impose fixed choices for some parameters with drop-down lists, allows to detail the requirements for the attribute like its format or units and allows examples) and to just import it in the HDF5 file. From there it’s easier to have every attribute as strings both for the import and for the concept of what an attribute is. 2- OK 3- The problem is not necessarily the number of experiments you put in the file but the number of hyper parameters you want to take into account. Let’s take an example with a doubtable sense: I want to study the effect of low-frequency temperature fluctuations on micro mechanics in active samples both eukaryote and prokaryote showing a layered structure (endothelial cells arranged in epidermis, biofilms, …) with different cell types, and as a function of aging. I would then create a file with a first range of groups for the age of the sample, then inside these groups 2 groups for eukaryote and prokaryote samples, then inside these groups N groups for the samples I’m looking at, then inside these groups M groups for the temperature fluctuations I impose, then inside these groups the individual measures I make (this is fictional, I’m scared just to think at the amount of work to have all the samples, let alone measure them), this is simply not possible with your approach I think, and even simpler experiments like to measure the Allan variance on an instrument using 2 samples is not possible with your structure I think. 4- / 5- I think the real question is what we expect to get from a wrapper: for me is to wrap the measures of a given study, to then share, link to papers, treat using new approaches… Having a structure that can wrap both a full study and an experiment is in my opinion better in the long run than forcing the format to be used with only one experiment. 6- Yes, I understand it is an identifier, but why an integer? Why not a tuple? Why not a hash? And what if there’s a bug and instead of 3 you store you store 3.0, or 2, or ‘e'? Do you imagine the amount of work to understand where this bug comes from? Assuming it’s a bug because it might very well be just an inexperienced user making a mistake and then your file is broken. The idea is good but the safer way to have this is to work with nD arrays where the dimensionality is conserved I think, or just have all the information in the same group. 7- Here again, it’s more useful for your application but many people don’t use maps, so why force them to have even an empty array for that? Plus if they need to have a dedicated array for the concentration of crosslinkers (for example), they are faced with a non-trivial solution, which means they won’t use the format. 8- Yes, we could add an additional layer, but then it means that if you don’t need it, your datasets are in plain in the group and if you need it, then you don’t have the same structure. The solution I think is to already have the treated data in a group, if you don’t need more than one group (which will be most of the time the case) then you’ll only have one group of treated data. 9- I think it’s not useful. The SNR on the other hand is useful, because in shot-noise regime it’s a marker of variance, and this is one of the ways to spot outliers from treatment (if the SNR doesn’t match the returned standard deviation on the shift of one peak, there’s a problem somewhere). 10- The std of a fit is obtained by taking the square root of the diagonalized covariant matrix returned by the fit as long as your parameters are independent (it’s super interesting actually and a little bit more complicated but it’s true enough for lorentzian, DHO, Gaussian...) 11- OK but then why not have the calibration curves placed with your measures if they are only applicable to this measure? Once again, I think having indexes that are modifiable by the user is not safe (the technical term is “idiot proof”) 12- I don’t agree, if you are capturing points at a fixed interval, then you can reconstruct the timestamp from the timestamp of the first acquisition and either the delay between two acquisitions or the timestamp of the last acquisition. Most of the time however we don’t even need this as we consider the sample to be time-invariant on the scale of our measure, so a single timestamp for all the measure is enough and is better stored as an attribute. In the special case where we are not time-invariant, then time becomes the abscissa of the measures and in that case yes, it can be a dataset, but then it’s better to not impose a fixed name for this dataset and rather let the user decide what hyper parameter is changed during he’s measure, this way the user is free to use whatever hyper parameters he feels like it. 13- OK 14- Still not clear to me. My approach is to consider an experiment to be a measure of a sample as function of one or more controlled or measured hyper parameter. So my general approach for storing experiments is have 3 files: abscissa (with the hyper parameters that vary), measure and metadata, which translates to “Raw_data”, “Abscissa_i” and attributes for this format. 15- OK, I think more than brainstorming about how to treat correctly a VIPA spectrum, we need to allow people to tell how they do it if we want this project to be used in short term, unification is a goal of this project and we will advertise it in the paper, but to be honest, I doubt people like Giuliano will run with it without second guessing it, particularly with its clinical setups, so there will be some going back and forth before we have something stable, and this means we need to allow for this back and forth to appear somewhere, I propose having it as a parameter. 16- Here I think you allow too much liberty, changing the frequency of an array to GHz is trivial and I think most people do use GHz as the unit of their frequency arrays anyway. We need to make it clear that the frequency axis is in GHz but I think we don’t need a full element for this. If you really want to specify the unit of the Frequency dataset, I would suggest putting it in its attributes in any case, and not as another element in the structure. 17- OK 18- I think it’s one way to do it but it is not intuitive: I won’t have the reflex to go check in the attributes if there is a parameter “sam_as” to see if the calibration applies to all the curves. The way I would expect it to be is using the hierarchical logic of the format: if I’m looking at a dataset in a sub-group of a group containing a calibration dataset, then I know this calibration applies to my data: Data |- Data_0 (group) | |- Calibration (dataset) | |- Data_0 (group) | | |- Raw_data (dataset) | |- Data_1 (group) | | |- Raw_data (dataset) |- Data_1 (group) | |- Calibration (dataset) | |- Data_0 (group) | | |- Raw_data (dataset) I think in this example most people would suppose Data/Data_0/Calibration applies both to Data/Data_0/Data_0/Raw_data and Data/Data_0/Data_1/Raw_data but not Data/Data_1/Data_0/Raw_data whose calibration is intuitively Data/Data_1/Calibration Once again, my approach of the structure is trying to make it intuitive and most of all, simple. For instance if I place myself in the position of someone that is willing to try “just to see how it works”, I would give myself 10s to understand how I could have a file for only one measure that complies with the new (hope to be) standard. It is my opinion as I already told you before, that your approach is too complete and therefore complex, which will inevitably lead to people not using the format unless there’s a GUI to do it for them (and even then they might not use it). I don’t want to impose my vision here, and like you I have put a lot of thinking (and testing) into building the format I propose, but I’m convinced that if we go with your structure, not only will it make it hard for anyone to understand how to use it but we’ll have problems using it ourselves. I want to repeat that I don’t have the solution, I’m just confident that my approach is much easier to conceptually understand and less restrictive than yours. In any case we can agree to disagree on that, but then it’ll be good to have an alternative backend like the one I did with your format to try and use it, and see if indeed it’s better, because if it’s not and people don’t use it, I don’t want to go back to all the trouble I had building the library, docs and GUI just to try. I don’t want to impose you anything but it would be awesome if you took the time to read the document I made and completed for you yesterday. Then you can just tell me where you think I’m missing something and you had a better solution because as you might see, I’m having problems with nearly all your structure and we can’t really use it as a starting point at this stage since most of the backend is written and the front-end is already functional for my setup (and soon Sal’s and the TFP). Best, Pierre Pierre Bouvet, PhD Post-doctoral Fellow Medical University Vienna Department of Anatomy and Cell Biology Wahringer Straße 13, 1090 Wien, Austria
On 20/2/25, at 22:55, Carlo Bevilacqua <carlo.bevilacqua@embl.de> wrote:
Hi Pierre, thank you for your feedback. I appreciate that you took the time to go through my definition and highlighting the critical points. I much prefer this rather than starting working with a file format where problem might arise in the future. If we understand what are the reasons behind our choices in the definition we can merge the best of the two approaches, rather than defining two "standards" for the same thing with each of them having their limitations.
I will provide an answer to each of the points you raised (I gave numbers to the points in your email below, so it is easier to reference): I am not sure to which attribute you are referring specifically, but I am completely fine with text; I defined enums where I felt it makes sense to do so because there is a discrete number of options (one could always add elements at the end of an enum) I defined the attributes before we started working together and I am very much open to changing them so they reflect what you have in the spreadsheet; in the document defining the file format we can just state that the attributes and their type are defined in the excel sheet I did it this way because in my idea an individual HDF5 file corresponds to a single experiment. If you feel there is an advantage in keeping different experiments in the same file I am open to introduce your structure of subgroups; I honestly feel like this will only make the file unnecessarly large and different experiments would mostly not share much (apart from the metadata, which is anyway a small overhead in terms of filesize). Now of course the question is what you define as an 'experiment': for me different timepoints or measurements at different temperatures/angles/etc on the same sample are a single experiment and I defined the file so that it is possible to save them in a single file; measurements on different samples are not the same experiment in my original idea same as the point 3 same as before, I would put different samples in different files but happy to introduce your structure if you feel there is an advantage the index is used to uniquely identify an entry in the 'Analysed_data' table; it is important in the contest of reconstructing the image (see the definition of the 'tn/image' group) in my opinion spatial coordinates have a privileged role since we are doing imaging and having them well defined it is important to reconstruct the image; for different abscissas I defined the 'parameters' dataset (more in point 14). If one is not doing imaging this dataset can be set to an empty array or a single element (we can include this in the definition) in my idea the "Analyzed_data" group doesn't contain multiple treatments but the result of the fit on the 'final' spectra, which are unique; if you are referring to the 'n' in the 'Shift_n_GHz' that is included in case a multipeak fit is performed. Now, if we want to include the possibility of multiple treatments like you are doing (which I didn't originally consider) we could just add an additional layer to the hierarchy that is the amplitude of the peak from the fit. I am not sure if you didn't understand what I meant or you think it is not an useful information The fit error actually contains 2 quantities: R2 and RMSE (as defined in the type). I am not sure how you would calculate a std from a single spectrum the calibration curves are stored in the 'calibration_spectra' group with the name of the dataset matching the respective 'Calibration_index'. In our VIPA setup we are acquiring multiple calibration curves during a single acquisition to compensate for laser drift, that's why I introduced the possibility of having multiple calibration curves. Note that the 'Calibration_index' is defined as optional exactly because it might not be needed each spectrum can have its own timestamp if it is acquired from a different camera image or scan of a FP, etc that's why it needs to be a dataset. Note that it is an optional dataset good point, we can rename it to PSD that is exactly to account for the general case of the abscissa not being a spatial coordinate and it contains the values for the parameters (e.g. the angles in an angle resolved measurement). It is a dataset whose dimensions are defined in the description (happy to elaborate more if it is not clear) float is the type of each element; it is a dataset whose dimensions are defined in the description; the way to define the frequency axis in general for setups which don't have an absolute frequency (like VIPAs) is tricky and would be good to brainstorm about possibile solutions as for the name we can change it, but the problem on how to deal with the situation when one doesn't have the frequency in GHz remains. My idea here was to leave the possibility of different units because the fit and most of the data analysis can be performed even if the x-axis is not in GHz and the actual conversion of the shift to GHz can be done at the end and requires the calibration data. As in my previous point, I am happy to brainstorm different solutions to this problem it is indeed redundant with 'Analyzed_data' and I pushed a change on GitHub to correct this see point 11; also note that the group is optional (in case people don't need it) and I introduced the attribute "same_as" to avoid repeating it multiple times if it is always the same for all the 'tn' As you see we agree with some of the points or we could find a common solution, for others it was mainly a misunderstanding on what were my intentions (probably my bad in expressing them, but you could have asked if it was not clear).
Hope this helps claryfing my reasoning in the file definition and I am happy to discuss all the open points. I will look in details at your newest definition that you shared in the next days.
Best, Carlo
On Thu, Feb 20, 2025 at 18:25, Pierre Bouvet via Software <software@biobrillouin.org> wrote: Hi,
My goal with this project is to unify the treatment of BLS spectra, to then allow us to address fundamental biophysical questions with BLS as a community in the mid-long term. Therefore my principal concern for this format is simplicity: measure are datasets called “Raw_data”, if they need one or more abscissa to be understood, this/these abscissa are called “Abscissa_i” and they are placed in groups called “Data_i” where we can store their attributes in the group’s attributes. From there, I can put groups in groups to store an experiment with different ... (e.g. : samples, time points, positions, techniques, wavelengths, patients, …). This structure is trivial but lacks usability so I added an attribute called “Name” to all groups that the user can define as he wants without impacting the structure. Now here are a few critics on Carlo’s approach. I didn’t want to share them because I hate criticizing anyone’s work, and I do think that what Carlo presented is great, but I don’t want you to think that I just trashed what he did, to the contrary, it’s because I see limitations in his approach that I tried developing another, simpler one. So here are the points I have problems with in Carlo’s approach: The preferred type of the information on an experiment should be text as we’ll likely see new devices (like your super nice FT approach) appear in the next months/years that will require new parameters to be defined to describe them. I think we should really try not to use anything else than strings in the attributes. The experiment information should not be defined by the HDF5 file structure but rather by a spreadsheet because everyone knows how to use Excel, and it’s way easier to edit an Excel file than an HDF5 file. Experiment information should apply to measures and not to files, because they might vary from experiment to experiment, I think their preferred allocation is thus the attributes of the groups storing individual measures (in my approach) The characterization of the instrument might also be experiment-dependent (if for some reason you change the tilt of a VIPA during the experiment for example), therefore having a dedicated group for it might not work for some experiments The groups are named “tn” and the structure does not present the nomenclature of sub-groups, this is a big problem if we want to store in the same format say different samples measured at different times (the logic patch would be to have sub-groups follow the same structure so tn/tm/tl/… but it should be mentioned in the definition of the structure) The dataset “index” in Analyzed_data is difficult to understand, what is it used for? I think it’s not useful, I would delete it. The "spatial position" in Analyzed_data supposes that we are doing mappings. This is too restrictive for no reason, it’s better to generalize the abscissa and allow the user to specify a non-limiting parameter (the “Name” attribute for example) with whatever value he wants (position, temperature, concentration of whatever, …). A concrete example of a limit here: angle measurements, I want my data to be dependent on the angle, not the position. Having different datasets in the same “Analyzed_data” group corresponding to the result of different treatments raises the question of where the process followed to treat the data is stored. A better approach would be to create n groups “Analyzed_data_n” with only one dataset of treated values, allowing for the process to be stored in the attributes of the group Analyzed_data_n I don’t understand why store an array of amplitude in “Analyzed_data”, is it for the SNR? Then maybe we could name this array “SNR”? The array “Fit_error_n” is super important but ill defined. I’d rather choose a statistical quantity like the variance, standard deviation (what I think is best), least-square error… and have it apply to both the Shift and Linewidth array as so: “Shift_std” and “Linewidth_std" I don’t understand “Calibration_index”: where are the calibration curves? Are they in “experiment_info”? If so, we expect people to already process their calibration curves to create an array before adding them to the hdf5 file? I’m not very familiar with all devices, so I might not see the limitations here but do we ever have more than one calibration curve per measure? Could we not add it to the group as a “Calibration” dataset? Or just have one group with the calibration curve? Timestamp is typically an attribute, it shouldn’t be present inside the group as an element. In tn/Spectra_n , “Amplitude” is the PSD so I would call it PSD because there are other “Amplitude” datasets so it’s confusing. If it’s not the PSD, I would call it “Raw_data”. I don’t understand what “Parameters” is meant to do in tn/Spectra_n, plus it’s not a dataset so I would put it in attributes or most likely not use it as I don’t understand what it does. Frequency is a dataset, not a float (I think). We also need to have a place where to store the process to obtain it. In VIPA spectrometers for instance this is likely a big (the main even I think) source of error. I would put this process in attributes (as a text). I don’t think “Unit” is useful, if we have a frequency axis, then we should define it directly in GHz, and if it’s a pixel axis, then for one we should not call it “Frequency” and then it’s better not to put anything since by default we will consider the abscissa (in absence of Frequency) as a simple range of the size of the “Amplitude” dataset. /tn/Images: it’s a good idea, but I believe this is redundant with “Analyzed_data” (?) If it’s not then I don’t understand how we get the datasets inside it. “Calibration_spectra” is a separate group, wouldn’t it be better to have it in “Experiment_info” in the presented structure? Also might scare off people that might not want to store a calibration file every time they create a HDF5 file (I might or might not be one of them) Like I said before, I don’t want this to be taken as more than what lead me to defining a new approach to the format. I want to state once again that Carlo's structure is complete, only it’s useful for specific instruments and applications, and difficultly applicable to other techniques and scenarios (and more lazy people like myself). Following Carlo’s mail, I’ve also completed the PDF I made to describe the structure I use in the HDF5_BLS library, I’m joining it to this email and pushing its code to <https://github.com/bio-brillouin/HDF5_BLS/tree/GUI_development/guides/Project>GitHub <https://github.com/bio-brillouin/HDF5_BLS/blob/GUI_development/guides/Projec...>, feel free to edit it and criticize it at length (I feel like I deserve it after this email I really tried not to write).
Best,
Pierre
Pierre Bouvet, PhD Post-doctoral Fellow Medical University Vienna Department of Anatomy and Cell Biology Wahringer Straße 13, 1090 Wien, Austria
On 20/2/25, at 16:12, Robert Prevedel via Software <software@biobrillouin.org <mailto:software@biobrillouin.org>> wrote:
Dear all,
great to see all this discussion in this thread, and thanks to especially Pierre and Carlo for driving this forward. I’ve been following the various emails and arguments closely but simply didn’t have any time to chip in due to some important committments in the past days.
I understand that there was a bit of a disagreement about what the focus of this effort should be, so maybe it just helps to highlight my lab's view on this (which I just discussed in depth with Carlo and Sebastian):
Our original motivation was to come up with and define a common file-format, as we regard this to be key to unify the processing and visualization of Brillouin data by the community. In this respect, we would be happy to focus our efforts on defining this format and taking care of implementing the necessary processing/visualization software and interface that allows anyone to look at the data in the same way. We also regard this to be crucial if we want to standardize the reporting of Brillouin data from diverse setups/users/applications.
Therefore, at this stage it would be extremely important to agree on the structure of the file format. Carlo has proposed a very well thought-through structure for this, and it would be great to get your concrete feedback on this, as I understand this hasn’t really happened yet. To aid in this, e.g. Pierre and/or Sal could try to convert or save your standard data into this structure, and report on any difficulties or ambiguities that he encounters.
Based on this I agree it’s best to meet and discuss and iron this out as a next step, however it either has to be next week (ideally Fri?), or after March 12 as I am travelling back-to-back in the meantime. Of course feel free to also meet without me for more technical discussions if this speeds up things. Either way we could then also discuss the file format etc. for the ‘raw’ data that Pierre proposed (and which is indeed very valuable as well).
Let me know your thoughts, and let’s keep up the great momentum and excitement on this work!
Best,
Robert -- Dr. Robert Prevedel Group Leader Cell Biology and Biophysics Unit European Molecular Biology Laboratory Meyerhofstr. 1 69117 Heidelberg, Germany
Phone: +49 6221 387-8722 Email: robert.prevedel@embl.de <mailto:robert.prevedel@embl.de>http://www.prevedel.embl.de <http://www.prevedel.embl.de/>
On 20.02.2025, at 10:29, Carlo Bevilacqua via Software <software@biobrillouin.org <mailto:software@biobrillouin.org>> wrote:
Hi Kareem,
thanks for the suggestion, I agree that it is a good (and easy) way to divide the tasks! Just to be clear, it is not that I don't see the need/advantage of providing some standard treatment going from raw data to standard spectra, it is just that was not my priority when proposing the idea of a unified file format.
Regarding the file format, splitting the one containing the raw data and the treatments from the one containing the spectra and the image in a standard format might be a good solution and we can always merge them at a later stage.
As for the file containing the "standard" spectra, it would be very helpful if you can give some feedback on the structure I originally proposed <https://github.com/prevedel-lab/Brillouin-standard-file/blob/main/docs/Bh5_f...>. Keep in mind that the idea is to be able to associate spectrum/spectra to each pixel in the image, in a way that is independent of the scanning strategy and underlaying technique. I tried to find a solution that works for the techniques I am aware of, considering the peculiarities (e.g. for most VIPA setups there is no absolute frequency axis but only relative to water). If am happy to discuss why I made some specific choices and if you see a better way to achieve the same or see things differently.
Both the 3rd and the 4th of March work for me.
Best, Carlo
On Thu, Feb 20, 2025 at 02:50, Kareem Elsayad via Software <software@biobrillouin.org <mailto:software@biobrillouin.org>> wrote: Dear All, (and I guess especially Carlo & Pierre 😊)
I understand both your (main) points concerning what this all should be, and I think this is actually perfect for dividing tasks. The format of the hf or bh5 file being where things meet and what needs to be agreed on.
The thing with raw data is ofcourse that it is variable between instruments and labs, and the conversion to “standard spectra” that can then be fitted etc. is going to be unique (maybe even between experiments in same project). That said, asking people to create some complex file from their data that works with a developed software is also unlikely to get a following.
So (the way I see it) there are basically two parts. Getting from raw data to h5 (or bh5) format which contains the spectra in standard format. And then the whole analysis part and visualization (GUI, pretty features, etc.).
While the latter may get the spotlight, it obviously relies heavily on the former being done right. Given that there are numerous “standard” BLS setup implementations the development of software for getting from raw data to h5 I think makes sense, since the h5 will no doubt be cryptic, and creating a working h5 is not something everyone will want to program by themselves (it is not an insignificant step given we are also trying to ultimately cater to biologists). As such a software that generates the h5 files, with drag and drop features and entering system parameters, for different setups makes sense and will save many labs a headache if they don’t have a good programmer on hand.
So I would suggest that Pierre & Sal lead the work on developing this, while Carlo & Sebastian lead the work on developing the analysis/interface-presentation part. This way things are nicely divided and we just need to agree on the h5 file that is transferred between the two. From the side of Pierre & Sal there could maybe also be a second h5 generated that contains all the raw data and details on how it was converted to the transferred h5 file (for complete transparency this could then also be reported in papers if people wish). These could exist as two separate programs with respective GUIs but also eventually combined to a single one.
How does this sound to everyone?
To clear up details and try assign tasks going forward how about a Zoom first week of March (I would be free Monday 3rd and Tue 4th after 1pm)?
All the best,
Kareem
From: Carlo Bevilacqua via Software <software@biobrillouin.org <mailto:software@biobrillouin.org>> Reply to: Carlo Bevilacqua <carlo.bevilacqua@embl.de <mailto:carlo.bevilacqua@embl.de>> Date: Wednesday, 19. February 2025 at 20:43 To: Pierre Bouvet <pierre.bouvet@meduniwien.ac.at <mailto:pierre.bouvet@meduniwien.ac.at>> Cc: <software@biobrillouin.org <mailto:software@biobrillouin.org>> Subject: [Software] Re: [EXTERN] Re: Software manuscript / BLS microscopy
Hi Pierre,
I realized that we might have slightly different aims.
For me the most important part of this project is to have a unified file format that can be read and visualized by a standard software. The file format you are proposing is not sufficient for that in my opinion. For example one of my main motivation was to have an interface where the user can see the reconstructed image, click on a pixel, see the corresponding spectrum to check its quality and maybe try different fitting functions; that would already not be possible with your structure because the software would have no notion on where the spectral data is stored and how to associate it to a specific pixel.
I don't see the structure of the file to be too complex as an issue, as long as it is functional: we can always provide an API and/or a GUI that allow people to take their spectra and save them in whatever format we decide without bothering about understanding the actual structure, the same way you can work with HDF5 file without having any understanding on how the data is actually stored on the disk.
My idea of making a webapp as a GUI follows directly from there. Typical case: I sent some data to a collaborator and they can just run the app in their browser and check if the outliers they see in the image are real or a bad spectra. Similarly if we make a common database of Brillouin spectra, people can explore it easily using the webapp.
From what I understood, you are instead more interested in going from raw data to an actual spectrum, which I don't see so much as a priority because each lab has their own code already and the actual procedure would be different for each lab (apart from standard instruments like the FP). I am not saying this should not be part of the software but not as a priority and rather has a layer where people can easily implement their own code (of course we could already implement code for standard instruments).
I think it would be good to cleary define what is our common aim now, so we are sure we are working in the same direction.
Let me know if you agree or I misunderstood what is your idea.
Best,
Carlo
On Wed, Feb 19, 2025 at 16:11, Pierre Bouvet <pierre.bouvet@meduniwien.ac.at <mailto:pierre.bouvet@meduniwien.ac.at>> wrote:
Hi,
I think you're trying to go too far too fast. The approach I present here <https://github.com/bio-brillouin/HDF5_BLS/blob/GUI_development/guides/Projec...> is intentionally simple, so that people can very quickly get to storing their data in a HDF5 file format together with the parameters they used to acquire them with minimal effort. The closest to what you did is therefore as follows:
- data are datasets with no other restriction and they are stored in groups
- each group can have a set of attribute proper to the data they are storing
- attributes have a nomenclature imposed by a spreadsheet and are in the form of text
- the default name of a data is the name of a raw data: “Raw_data”, other arrays can have whatever name they want (Shift_5GHz, Frequency, ...)
- arrays and attributes are hierarchical, so they apply to their groups and all groups under it.
This is the bare minimum to meet our needs, so we need to stop here in the definition of the format since it’s already enough to have the GUI working correctly, and therefore the first version of the unified software advertised. Of course we will have to refine things later on, but we don’t want to scare people off by presenting them a file description that for one might not match their measurements and that is extremely hard to conceptually understand. To make my point clearer, take your definition of the format for example: there are 3 different amplitude arrays in your description, two different shift arrays and width arrays that are of different dimension, then we have a calibration group on one side but a spectrometer characterization array in another group that is called “experiment_info”, that’s just too complicated to use correctly. On the other hand, placing your raw data “as is” in a group dedicated to this data is conceptually easy and straightforward.
Where you are right, is that should we have hundreds of people using it, we might in a near future want to store abscissa, impulse responses, … in a standardized manner. In that case, the question falls down to either adding sub-groups or storing the data together with the measure. Both are fine and don’t really pose a problem for now, essentially because we are not trying to visualize the results but just trying to unify the way to get them.
Now regarding Dash, if I understand correctly, it’s just a way to change the frontend you propose? If that’s so, why not, but then I don’t really see the benefits: if you really want to use dash, you can always embed it inside a Qt app. Also Dash being browser based, you will only have one window for the whole interface, which will be a pain to deal with if you want to use the interface to do everything the GUI is expected to do (inspect an H5 file, convert PSD, treat data, edit parameters, inspect a failed treatment, simulate results using setups with slight changes of parameters…). We agree that at one point when people receive an h5 file, it will be useful to have a web interface that can do what yours or Sal’s GUI do (seeing the mapping results together with the spectrum, eventually the time-domain signal) but here again, it’s going too far too soon: let’s first have a simple and reliable GUI that can convert data from any spectrometer to PSDs and treat them with a unified code. This is the real challenge, visualization and nomenclature of results are both important but secondary. Also keep in mind that, the frontend can easily be generated by anyone really, with Copilot or ChatGPT or whatever AI, but you can’t ask them to develop the function that will correctly read your data and convert them to a PSD nor treat the PSD. This is done on the backend and is the priority since the unification essentially happens there.
Best,
Pierre
Pierre Bouvet, PhD
Post-doctoral Fellow
Medical University Vienna
Department of Anatomy and Cell Biology
Wahringer Straße 13, 1090 Wien, Austria
On 19/2/25, at 13:21, Carlo Bevilacqua <carlo.bevilacqua@embl.de <mailto:carlo.bevilacqua@embl.de>> wrote:
Hi Pierre,
thanks for your reply.
Regarding the file structure, what I am still not very clear about is what you define as Raw_data and data, how the actual spectra are stored and how the association to spatial coordinates and parameters is made. That's why I would really appreciate if you could make a document similar to what I did <https://github.com/prevedel-lab/Brillouin-standard-file/blob/main/docs/Bh5_f...>, where it is clear what each group should (or can) contain, what is the shape of each dataset, which attributes they have, etc...
I am not saying that this should be the final structure of the file but I strongly believe that having it written in a structured way helps defining it and seeing potential issues.
Regarding the webapp, it works by separating the frontend, which run in the browser and is responsible of running the GUI, and the backend which is doing the actual computation and that you can structure as you like with multithreading or any optimization you wish. The communication between frontend and backend is handled transparently by the framework, so you don't have to take care of it.
When you run Dash locally a local server is created so the data stays on your computer and there is no issue with data transfer/privacy.
If we want to move it to a server at a later stage, then you are right about the fact that data needs to be transferred to a server (although there might be solutions that allow you to still run the computation on the local browser, like WebAssembly <https://webassembly.org/>, but I think it is too complex to look into this at this stage). Regarding safety and privacy, the data will be stored on the server only for the time that the user is using the app and then deleted (of course we will need to make a disclaimer on the website about this). Regarding space I don't think people at the beginning will load their 1Tb dataset on the webapp but rather look at some small dataset of few tens of Gb; in that case 1Tb of server space is more than enough (remember that the file will be stored only for the time the user is using the app). If people really start to use the webapp and space becomes a limitation, I would be super happy to look into WebAssembly so that the data can be handled locally from the browser without transferring it to the server.
To summarize I would agree that, at this stage, there might be no advantage of a webapp over a local GUI (and might actually be a bit more work to develop it). But, if this project really flies, the potential of a webapp is huge, especially in the context of the BioBrillouin society where we want to have a database of spectral data and the webapp could be used to explore that without downloading anything on your computer. My main point is that moving now to a webapp would not be too much work, but if we want to do it at a later stage it will basically entail re-writing everything from scratch.
Let me know what are your thoughts about it.
Best,
Carlo
On Wed, Feb 19, 2025 at 08:51, Pierre Bouvet <pierre.bouvet@meduniwien.ac.at <mailto:pierre.bouvet@meduniwien.ac.at>> wrote:
Hi Carlo,
You’re right, the format is still a little fuzzy. The main idea is to have a data-based hierarchy for storage: each data is stored in an individual group. From there, abscissa dependent on the data are stored in the same group and the treated data are stored in sub-groups. The names of the groups and sub-groups are fixed (Data_i), as is the name of the raw data (Raw_data) and abscissa (Abscissa_i). Also, the measure and spectrometer-dependent arguments have a defined nomenclature. To differentiate groups between them, we preferably attribute them a name as an attribute that is not used as an identifier, the identifier being either the path to the data/group from file root (Data_0/Data_42/Data_2/Raw_data) or potentially a hash value (not implemented). This I think allows all possible configurations, and using an hierarchical approach we can also pass common attributes and arrays (parameters of the spectrometer or abscissa arrays for example) on parent to reduce memory complexity.
Now regarding the use of server-based GUI, first off, I’ve never used them so I’m just making supposition here but if the platform is able to treat data online, it will have to store the spectra somewhere in memory and it will not be local. My primary concerns with this approach is safety, particularly in terms of intellectual property protection, ethical considerations, and potential security vulnerabilities. Additionally, managing storage space will be a headache.
Now, this doesn’t mean that we can’t have a server-based data plotter, or a server-based interface that does treatments locally but I don’t really see the benefits of this over a local software that can have multiple windows, which could at one point be multithreaded, and that could wrap c code to speed regressions for example (some of this might apply to Dash, I’m not super familiar with it). Now regarding memory complexity, having all the data we treat go on a server is a bad idea as it will raise the question of cost which will very rapidly become a real problem. Just an example: for a 100x100 map, I need 10Gb of memory (1Mo/point) with my setup (1To of archive storage is approximately 1euro/month) so this would get out of hands super fast assuming people use it.
Now maybe there are solutions I don’t see for these problems and someone can take care of them but for me it’s just not worth the effort when having a local GUI solves all of these issues at once. But if you find a solution, then I’ll be happy to migrate to Dash, it won’t be fast to translate every feature but I can totally join you on the platform.
Best,
Pierre
Pierre Bouvet, PhD
Post-doctoral Fellow
Medical University Vienna
Department of Anatomy and Cell Biology
Wahringer Straße 13, 1090 Wien, Austria
On 18/2/25, at 20:26, Carlo Bevilacqua <carlo.bevilacqua@embl.de <mailto:carlo.bevilacqua@embl.de>> wrote:
Hi Pierre,
regarding the structure of the file, I agree that we should keep it simple. I am not suggesting to make it more complex, rather to have a document where we define it in a clear and structured way rather than as a general description, to make sure that we are all on the same page.
I am saying this because, to be honest, I am not sure I fully understand how you are structuring the HDF5 and I think it is important to agree on this now, rather than finding at a later stage that we had different ideas.
Ideally if the GUI should be part of a single application, we should write it using a unified framework.
The reasons why, after considering it for a bit, I lean towards Dash rather than Qt are:
it can run in a web browser so it will be easy to eventually move it to a website, thus people can use it without installing it (which will hopefully help in promoting its use) it is based on plotly <https://plotly.com/python/> which is a graphical library with very good plotting capabilites and highly customizable, that would make the data visualization easier/more appealing Let me know what you think about it and if you see any advantage of Qt over a web app which I am not considering. Also, if we agree that Dash might be a better option, would you consider migrating to Dash? It might not be too much work if most of the code you wrote is for data processing rather that for the GUI itself and I could help you with that. Alternatively one workaround is to have a QtWebEngine <https://doc.qt.io/qtforpython-6/overviews/qtwebengine-overview.html> in your Qt app and have the Dash app run inside that, but that would make only the Dash part portable to a server later on.
Best,
Carlo
On Tue, Feb 18, 2025 at 10:24, Pierre Bouvet <pierre.bouvet@meduniwien.ac.at <mailto:pierre.bouvet@meduniwien.ac.at>> wrote:
Hi,
Thanks,
More than merge them later, just keep them separate in the process and rather than trying to build "one code to do it all", build one library and GUI that encapsulate codes to do everything.
Having a structure is a must but it needs to be kept as simple as possible else we’ll rapidly find situations where we need to change the structure. The middle ground I think is to force the use of hierarchies and impose nomenclatures where problem are expected to appear: each dataset has its own group, each group can encapsulate other groups, each parameter of a group applies to all its sub-groups if the subgroup does not change its value, each array of a group applies to all of its sub-groups if the sub-group does not redefine an array with same name, the names of the groups are held as parameters and their ID are managed by the software.
For the Plotly interface, I don’t know how to integrate it to Qt but if you find a way to do it, that’s perfect with me :)
My vision of the GUI is something that unifies the format and can then execute scripts on the data stored in this format. I have pushed the application of the GUI to my data up to the point where I can do the whole information extraction process from it (add data, convert to PSD, fit curves). I think this could be super interesting if we implement it for all techniques.
I think we could formalize the project in milestones, in particular define the minimal denominator that will allow us to have the paper. The milestone I reached for my spectro encompasses the following points:
- Being able to add data to the file easily (by dragging & dropping to the GUI)
- Being able to assign properties to these data easily (again by dragging & dropping)
- Being able to structure the added data in groups/folders/containers/however we want to call it
- Making it easy for new data types to be loaded
- Allowing data from same type but different structure to be added (e.g. .dat files)
- Execute scripts on the data easily and allowing parameters of these scripts to be defined from the GUI (e.g. select a peak on a curve to fit this peak)
- Make it easy to add scripts for treating or extracting PSD from raw data.
- Allow the export of a Python code to access the data from the file (we cans see them as “break points” in the treatment pipeline)
- Edit of properties inside the GUI
In any case I think we could build a spec sheet for the project with what we want to have in it based on what we want to advertise in the paper. We can always add things later on but if we agree on a strict minimum to have the project advertised, then that will set its first milestone on which we’ll be able to build later on.
Best,
Pierre
Pierre Bouvet, PhD
Post-doctoral Fellow
Medical University Vienna
Department of Anatomy and Cell Biology
Wahringer Straße 13, 1090 Wien, Austria
On 17/2/25, at 14:53, Carlo Bevilacqua via Software <software@biobrillouin.org <mailto:software@biobrillouin.org>> wrote:
Hi Pierre, hi Sal,
thanks for sharing your thoughts about it.
@Pierre I am very sorry that Ren passed away :(
As far as I understood you are suggesting to work on the individual aspects separately and then merge them together at a later stage? I am fine with that but I still think it is very important to now agree on what should be in the file format we are defining, because that is kind of the core of the project and will affect a lot of the design choices.
I am happy to start working on the GUI for data visualization. In my idea, it will be something similar to this <https://www.nature.com/articles/s41592-023-02054-z/figures/10> but written in dash <https://dash.plotly.com/>, so it is a web app that for now can run locally (so no transfer of data to an external server is required) but in the future can easily be uploaded to a website that people can just use without installing anything on their computer.
The question is how much of the data processing should be possible to do (or trigger) from the same GUI? I think at least a drop down menu with different fitting functions should be there, so the user can quickly check the results on a spectrum from a specific point in the image.
@Pierre how are you envisioning the GUI you are working on? As far as I understood it is mainly to get the raw data and save it to our HDF5 format with some treatment on it.
One idea could be to have a shared list of features that we are implementing in the GUI as we work on it, to avoid having the same functionality duplicated (or worst inconsistent) between the GUI for generating our file format and the GUI for visualization.
Let me know what you think about it.
Best,
Carlo
On Mon, Feb 17, 2025 at 11:04, Pierre Bouvet via Software <software@biobrillouin.org <mailto:software@biobrillouin.org>> wrote:
Hi everyone,
Sorry for the delayed response, I just went through the loss of Ren (my dog) and wasn’t at all able to answer.
First of, Sal, I am making progress and I should have everything you have made on your branch integrated to the GUI branch soon, at which point I will push everything to main.
Regarding the project, I think I align with Sal: keep things as simple as possible. My approach was to divide everything in 3 mostly independent layers:
- Store data in an organized file that anyone can use, and make it easy to do
- Convert these data into something that has physical significance: a Power Spectrum Density
- Extract information from this Power Spectrum Density
Each layer has its own challenge but they are independent on the challenge of having people using it: personally, if I had someone come to me with a new software to play with my measures, I would most likely only look at it for 1 minute (or less depending who made it) with a lot of apprehension and then based on how simple it looks and how much I understood of it, use it or - what is most likely - discard it. This is why Project.pdf <https://github.com/bio-brillouin/HDF5_BLS/blob/GUI_development/guides/Projec...> is essentially meant to say: we put data arrays in groups and give them attributes written in text, but you can also create groups within groups to organize your data!
I believe most of the people in the BioBrillouin society will have the same approach and before having something complex that can do a lot, I think it’s best to have something simple that can just unify the format (which in itself is a lot) and that people can use right away with a minimal impact on their own individual pipelines for data processing.
To be honest, I don’t think people will blindly trust our software at first to treat their data, but they will most likely use it at first to organize their raw spectra, and maybe add their own treated data if they are feeling particularly adventurous. But that is not a problem as long as we start a movement. From there yes, we can complexity and create custom file architectures but that is already too complex I think for this first project.
If we can all just import our data to the wrapper and specify their attributes, this will already be a success. Then for the paper, if we can all add a custom code to treat these data to obtain a PSD, I think this will be enough. As I said, the current API already allows you to add your data in a variety of format, so it’s just a question of developing the PSD conversion before having something we can publish (and then tell people to use).
A few extra points:
- Working with my setup, I realized if the user could choose between different algorithms to treat their own data, it would make the overall project much more usable (if an algorithm bugs for whatever reason, you can use another one) so I created 2 bottle necks in the form of functions (for PSD conversion and treatment) that would inspect modules dedicated to either PSD conversion or treatment, and list existing functions. It’s in between classical and modular programming but it makes the development of new PSD conversion code and treatment way way easier
- The GUI is developed using oriented-object programming. Therefore I have already made some low-level choices that kind of impact all the GUI. I’m not saying they are the best choices, I’m just saying that they work, so if you want to work on the GUI, I would either recommend getting familiar with these choices, or making sure that all the functionalities are preserved, particularly the ones that are invisible (logging of treatment steps, treatment errors…)
I’ll try merging the branches on Git asap and will definitely send you all an email when it’s done :)
Best,
Pierre
Pierre Bouvet, PhD
Post-doctoral Fellow
Medical University Vienna
Department of Anatomy and Cell Biology
Wahringer Straße 13, 1090 Wien, Austria
On 14/2/25, at 19:36, Sal La Cavera Iii via Software <software@biobrillouin.org <mailto:software@biobrillouin.org>> wrote:
Hi all,
I agree with the things enumerated and points made by Kareem/Carlo! I guess I would advocate for starting from a position of simplicity. We probably don't want to get weighed down by trying to include a bunch of bells and whistles from the start as these can be easily added once there is a minimally viable stable product.
As long as data can be loaded to local memory, then treated in various (initially simple) ways through the GUI (and maybe maintain non-GUI compatibility for command-line warriors like myself), then the bh5 formatting stuff can be sorted on the back end? I definitely agree with Carlo's structure set out in the file format document; but all of that data will be floating around the memory in some shape or form and just needs to be wrapped up and packaged (according to Carlo's structure e.g.) when the user is happy and presses the "generate h5 filestore" etc. (?)
Definitely agree with the recommendation to create the alpha using mainly requirements that our 3 labs would find useful (import filetypes, treatments, etc), and then we can add on more universal functionality second / get some beta testers in from other labs etc.
I'm able to support on whatever jobs need doing and am free to meet in the beginning of March like you mentioned Kareem.
Hope you guys have a nice weekend,
Cheers,
Sal
---------------------------------------------------------------
Salvatore La Cavera III
Royal Academy of Engineering Research Fellow
Nottingham Research Fellow
Optics and Photonics Group
University of Nottingham Email: salvatore.lacaveraiii@nottingham.ac.uk <mailto:salvatore.lacaveraiii@nottingham.ac.uk> ORCID iD: 0000-0003-0210-3102
<Outlook-tygjxucs.png> <https://outlook.office.com/bookwithme/user/6a3f960a8e89429cb6fc693c01d10119@...>
Book a Coffee and Research chat with me!
From: Carlo Bevilacqua via Software <software@biobrillouin.org <mailto:software@biobrillouin.org>> Sent: 12 February 2025 13:31 To: Kareem Elsayad <kareem.elsayad@meduniwien.ac.at <mailto:kareem.elsayad@meduniwien.ac.at>> Cc: sebastian.hambura@embl.de <mailto:sebastian.hambura@embl.de> <sebastian.hambura@embl.de <mailto:sebastian.hambura@embl.de>>; software@biobrillouin.org <mailto:software@biobrillouin.org> <software@biobrillouin.org <mailto:software@biobrillouin.org>> Subject: [Software] Re: Software manuscript / BLS microscopy
You don't often get email from software@biobrillouin.org <mailto:software@biobrillouin.org>. Learn why this is important <https://aka.ms/LearnAboutSenderIdentification>
Hi Kareem,
thanks for restarting this and sorry for my silence, I just came back from US and was planning to start working on this again.
Could you also add Sebastian (in CC) to the mailing list?
As you outlined, I would split the project into two parts: 1) getting from the raw data to some standard "processed' spectra and 2) do data analysis/visualization on that. For the second part the way I envision it is:
the most updated definition of the file format from Pierre is this one <https://github.com/bio-brillouin/HDF5_BLS/blob/GUI_development/guides/Projec...>, correct? In addition to this document I think it would be good to have a more structured description of the file (like this <https://github.com/prevedel-lab/Brillouin-standard-file/blob/main/docs/Bh5_f...>), where each field is clearly defined in terms of data type and dimensions. Sebastian was also suggesting that the document should contain the reasoning behind each specific choice in the specs and also things that we considered but decided had some issues (so in future we can look back at it). I still believe that the file format should contain the "processed" spectra (i.e. after FT and baseline subtraction for impulsive, or after taking a line profile and possibly linearization with VIPA,...) so we can apply standard data processing or visualization which is independent on the actual underlaying technique (e.g. VIPA, FP, stimulated, time domain, ...) agree on an API to read the data from our file format (most likely a Python class). For that we should: 1) decide on which information is important to extract (spectral information, spatial coordinates, hyper-parameters, metadata,...) 2) implement an interface to read the data (e.g. readSpectrumAtIndex(...), readImage(...), ...) build a GUI that use the previously defined API to show and process the data. I would say that, once we have a very solid description of the file format as in step 1, step 2 will come naturally and we can divide the actual implementation between us. Step 3 can also easily be implemented and divided between us once we have an API (and I am happy to work on the GUI myself).
The first half of the project is the trickiest and I know Pierre has already done a lot of work in that direction. We should definitely agree on which extent we can define a standard to store the raw data, given the variability between labs, (and probably we should do it for common techniques like FP or VIPA) and how to implement the treatments, leaving to possibility to load some custom code in the pipeline to do the conversion.
Let me know what you all think about this.
If you agree I would start by making a document which clearly defines the file format in a structured way (as in my step 1 before). @Pierre could you write a new document or modify the document I originally made <https://github.com/prevedel-lab/Brillouin-standard-file/blob/main/docs/Bh5_f...> to reflect the latest structure you implemented for the file format? The metadata can still be defined in a separated excel sheet, as long as the data type and format is well defined there.
Best regards,
Carlo
On Wed, Feb 12, 2025 at 02:19, Kareem Elsayad via Software <software@biobrillouin.org <mailto:software@biobrillouin.org>> wrote:
Hi Robert, Carlo, Sal, Pierre,
Think it would be good to follow up on software project. Pierre has made some progress here and would be good to try and define tasks a little bit clearer to make progress…
There is always the potential issue of having “too many cooks in the kitchen” (that have different recipes for same thing) to move forward efficiently, something that I noticed can get quite confusing/frustrating when writing software together with people. So would be good to clearly assign tasks. I talked to Pierre today and he would be happy to integrate things in framework we have to try tie things together. What would foremost be needed would be ways of treating data, meaning code that takes a raw spectral image and meta-data and converts it into “standard” format (spectral representation) that can then be fitted. Then also “plugins” that serve a specific purpose in the analysis/rendering that can be included in framework.
The way I see it (and please comment if you see differently), there are ~4 steps here:
Take raw data (in .tif,, .dat, txt, etc. format) and meta data (in .cvs, xlsx, .dat, .txt, etc.) and render a standard spectral presentation. Also take provided instrument response in one of these formats and extract key parameters from this Fit the data with drop-down menu list of functions, that will include different functional dependences and functions corrected for instrument response. Generate/display a visual representation of results (frequency shift(s) and linewidth(s)), that is ideally interactive to some extent (and maybe has some funky features like looking at spectra at different points. These can be spatial maps and/or evolution with some other parameter (time, temperature, angle, etc.). Also be able to display maps of relative peak intensities in case of multiple peak fits, and whatever else useful you can think of. Extract “mechanical” parameters given assigned refractive indices and densities
I think the idea of fitting modified functions (e.g. corrected based on instrument response) vs. deconvolving spectra makes more sense (as can account for more complex corrections due to non-optical anomalies in future –ultimately even functional variations in vicinity of e.g. phase transitions). It is also less error prone, as systematically doing decon with non-ideal registration data can really throw you off the cliff, so to speak.
My understanding is that we kind of agreed on initial meta-data reporting format. Getting from 1 to 2 will no doubt be most challenging as it is very instrument specific. So instructions will need to be written for different BLS implementations.
This is a huge project if we want it to be all inclusive.. so I would suggest to focus on making it work for just a couple of modalities first would be good (e.g. crossed VIPA, time-resolved, anisotropy, and maybe some time or temperature course of one of these). Extensions should then be more easy to navigate. At one point think would be good to involve SBS specific considerations also.
Think would be good to discuss a while per email to gather thoughts and opinions (and already start to share codes), and then plan a meeting beginning of March -- how does first week of March look for everyone?
I created this mailing list (software@biobrillouin.org <mailto:software@biobrillouin.org>) we can use for discussion. You should all be able to post to (and it makes it easier if we bring anyone else in along the way).
At moment on this mailing list is Robert, Carlo, Sal, Pierre and myself. Let me know if I should add anyone.
All the best,
Kareem
This message and any attachment are intended solely for the addressee and may contain confidential information. If you have received this message in error, please contact the sender and delete the email and attachment. Any views or opinions expressed by the author of this email do not necessarily reflect the views of the University of Nottingham. Email communications with the University of Nottingham may be monitored where permitted by law. _______________________________________________ Software mailing list -- software@biobrillouin.org <mailto:software@biobrillouin.org> To unsubscribe send an email to software-leave@biobrillouin.org <mailto:software-leave@biobrillouin.org>
_______________________________________________ Software mailing list -- software@biobrillouin.org <mailto:software@biobrillouin.org> To unsubscribe send an email to software-leave@biobrillouin.org <mailto:software-leave@biobrillouin.org>
_______________________________________________ Software mailing list -- software@biobrillouin.org <mailto:software@biobrillouin.org> To unsubscribe send an email to software-leave@biobrillouin.org <mailto:software-leave@biobrillouin.org>
_______________________________________________ Software mailing list -- software@biobrillouin.org <mailto:software@biobrillouin.org> To unsubscribe send an email to software-leave@biobrillouin.org <mailto:software-leave@biobrillouin.org>
_______________________________________________ Software mailing list -- software@biobrillouin.org <mailto:software@biobrillouin.org> To unsubscribe send an email to software-leave@biobrillouin.org <mailto:software-leave@biobrillouin.org>
Dear All, I (and Robert) were hoping there would be some consensus on this h5 file format. Let us do a Zoom on Fri 28th Feb at 15:00? A couple of points pertaining to arguments… Firstly, the precise structure is not worth getting into big arguments or fuss about…as long as it contains all the information needed for the analysis/representation, and all parties can work with (able to write and read knowing what is what), it ultimately doesn’t matter. In my opinion better put more (optional) stuff in if that is issue, and make it as inclusive as possible. In the end this does not need to be read by analysis/representation side, and when we go through we can decide if and what needs to be stripped. It is after all the “black box” between doing the experiment and having your final plots/images. Take a look at say a Zeiss file and try figure all that’s in it (it is not ideally structured maybe, but no biologist ever cared) – that said, I am sure their team had very similar arguments concerning structure etc.! (you have as many opinions as people). Maybe the issue is that the boundary conditions were not as well defined, but I would say at this point make them more inclusive than they need to be (empty spaces cost little memory) Secondly, and following on from firstly. We need to simply agree and compromise to make any progress asap. Rather than building separate structures we need to add/modify a single existing structure or we might as well be working on independent projects. Carlo’s initially proposed structure seemed reasonable, maybe with some minor changes, and we should just go with that as a basis in my opinion. I would suggest that Pierre and Carlo have a Zoom together and try and come up with something that is acceptable to both. Like everything in life, this will involve making compromises. And then present it on 28th Feb. Quite simply, if there is no agreement we cannot do this project and in the end it doesn’t matter who is right or wrong. Finally, I hope the disagreements from both sides are not seen as negative or personal attacks –it is ok to disagree (that’s why we have so many meetings!) On the plus side we are still more effective than the Austrian government (that is still deciding who should be next prime minister like half a year after elections) 😊 All the best, Kareem From: Pierre Bouvet via Software <software@biobrillouin.org> Reply to: Pierre Bouvet <pierre.bouvet@meduniwien.ac.at> Date: Friday, 21. February 2025 at 11:55 To: Carlo Bevilacqua <carlo.bevilacqua@embl.de> Cc: <software@biobrillouin.org> Subject: [Software] Re: [EXTERN] Re: Software manuscript / BLS microscopy Hi Carlo, Thanks for your reply, here is the next pong of this ping pong series ^^ 1- I was talking indeed about the enums, but also the parameters that are defined as integers or floating point numbers and uint32. I think its easier (and that we already agreed on) having a spreadsheet with the parameters (easy to use, easy to update, easy to store and modify between two experiments using the same setup, allows to impose fixed choices for some parameters with drop-down lists, allows to detail the requirements for the attribute like its format or units and allows examples) and to just import it in the HDF5 file. From there it’s easier to have every attribute as strings both for the import and for the concept of what an attribute is. 2- OK 3- The problem is not necessarily the number of experiments you put in the file but the number of hyper parameters you want to take into account. Let’s take an example with a doubtable sense: I want to study the effect of low-frequency temperature fluctuations on micro mechanics in active samples both eukaryote and prokaryote showing a layered structure (endothelial cells arranged in epidermis, biofilms, …) with different cell types, and as a function of aging. I would then create a file with a first range of groups for the age of the sample, then inside these groups 2 groups for eukaryote and prokaryote samples, then inside these groups N groups for the samples I’m looking at, then inside these groups M groups for the temperature fluctuations I impose, then inside these groups the individual measures I make (this is fictional, I’m scared just to think at the amount of work to have all the samples, let alone measure them), this is simply not possible with your approach I think, and even simpler experiments like to measure the Allan variance on an instrument using 2 samples is not possible with your structure I think. 4- / 5- I think the real question is what we expect to get from a wrapper: for me is to wrap the measures of a given study, to then share, link to papers, treat using new approaches… Having a structure that can wrap both a full study and an experiment is in my opinion better in the long run than forcing the format to be used with only one experiment. 6- Yes, I understand it is an identifier, but why an integer? Why not a tuple? Why not a hash? And what if there’s a bug and instead of 3 you store you store 3.0, or 2, or ‘e'? Do you imagine the amount of work to understand where this bug comes from? Assuming it’s a bug because it might very well be just an inexperienced user making a mistake and then your file is broken. The idea is good but the safer way to have this is to work with nD arrays where the dimensionality is conserved I think, or just have all the information in the same group. 7- Here again, it’s more useful for your application but many people don’t use maps, so why force them to have even an empty array for that? Plus if they need to have a dedicated array for the concentration of crosslinkers (for example), they are faced with a non-trivial solution, which means they won’t use the format. 8- Yes, we could add an additional layer, but then it means that if you don’t need it, your datasets are in plain in the group and if you need it, then you don’t have the same structure. The solution I think is to already have the treated data in a group, if you don’t need more than one group (which will be most of the time the case) then you’ll only have one group of treated data. 9- I think it’s not useful. The SNR on the other hand is useful, because in shot-noise regime it’s a marker of variance, and this is one of the ways to spot outliers from treatment (if the SNR doesn’t match the returned standard deviation on the shift of one peak, there’s a problem somewhere). 10- The std of a fit is obtained by taking the square root of the diagonalized covariant matrix returned by the fit as long as your parameters are independent (it’s super interesting actually and a little bit more complicated but it’s true enough for lorentzian, DHO, Gaussian...) 11- OK but then why not have the calibration curves placed with your measures if they are only applicable to this measure? Once again, I think having indexes that are modifiable by the user is not safe (the technical term is “idiot proof”) 12- I don’t agree, if you are capturing points at a fixed interval, then you can reconstruct the timestamp from the timestamp of the first acquisition and either the delay between two acquisitions or the timestamp of the last acquisition. Most of the time however we don’t even need this as we consider the sample to be time-invariant on the scale of our measure, so a single timestamp for all the measure is enough and is better stored as an attribute. In the special case where we are not time-invariant, then time becomes the abscissa of the measures and in that case yes, it can be a dataset, but then it’s better to not impose a fixed name for this dataset and rather let the user decide what hyper parameter is changed during he’s measure, this way the user is free to use whatever hyper parameters he feels like it. 13- OK 14- Still not clear to me. My approach is to consider an experiment to be a measure of a sample as function of one or more controlled or measured hyper parameter. So my general approach for storing experiments is have 3 files: abscissa (with the hyper parameters that vary), measure and metadata, which translates to “Raw_data”, “Abscissa_i” and attributes for this format. 15- OK, I think more than brainstorming about how to treat correctly a VIPA spectrum, we need to allow people to tell how they do it if we want this project to be used in short term, unification is a goal of this project and we will advertise it in the paper, but to be honest, I doubt people like Giuliano will run with it without second guessing it, particularly with its clinical setups, so there will be some going back and forth before we have something stable, and this means we need to allow for this back and forth to appear somewhere, I propose having it as a parameter. 16- Here I think you allow too much liberty, changing the frequency of an array to GHz is trivial and I think most people do use GHz as the unit of their frequency arrays anyway. We need to make it clear that the frequency axis is in GHz but I think we don’t need a full element for this. If you really want to specify the unit of the Frequency dataset, I would suggest putting it in its attributes in any case, and not as another element in the structure. 17- OK 18- I think it’s one way to do it but it is not intuitive: I won’t have the reflex to go check in the attributes if there is a parameter “sam_as” to see if the calibration applies to all the curves. The way I would expect it to be is using the hierarchical logic of the format: if I’m looking at a dataset in a sub-group of a group containing a calibration dataset, then I know this calibration applies to my data: Data |- Data_0 (group) | |- Calibration (dataset) | |- Data_0 (group) | | |- Raw_data (dataset) | |- Data_1 (group) | | |- Raw_data (dataset) |- Data_1 (group) | |- Calibration (dataset) | |- Data_0 (group) | | |- Raw_data (dataset) I think in this example most people would suppose Data/Data_0/Calibration applies both to Data/Data_0/Data_0/Raw_data and Data/Data_0/Data_1/Raw_data but not Data/Data_1/Data_0/Raw_data whose calibration is intuitively Data/Data_1/Calibration Once again, my approach of the structure is trying to make it intuitive and most of all, simple. For instance if I place myself in the position of someone that is willing to try “just to see how it works”, I would give myself 10s to understand how I could have a file for only one measure that complies with the new (hope to be) standard. It is my opinion as I already told you before, that your approach is too complete and therefore complex, which will inevitably lead to people not using the format unless there’s a GUI to do it for them (and even then they might not use it). I don’t want to impose my vision here, and like you I have put a lot of thinking (and testing) into building the format I propose, but I’m convinced that if we go with your structure, not only will it make it hard for anyone to understand how to use it but we’ll have problems using it ourselves. I want to repeat that I don’t have the solution, I’m just confident that my approach is much easier to conceptually understand and less restrictive than yours. In any case we can agree to disagree on that, but then it’ll be good to have an alternative backend like the one I did with your format to try and use it, and see if indeed it’s better, because if it’s not and people don’t use it, I don’t want to go back to all the trouble I had building the library, docs and GUI just to try. I don’t want to impose you anything but it would be awesome if you took the time to read the document I made and completed for you yesterday. Then you can just tell me where you think I’m missing something and you had a better solution because as you might see, I’m having problems with nearly all your structure and we can’t really use it as a starting point at this stage since most of the backend is written and the front-end is already functional for my setup (and soon Sal’s and the TFP). Best, Pierre Pierre Bouvet, PhD Post-doctoral Fellow Medical University Vienna Department of Anatomy and Cell Biology Wahringer Straße 13, 1090 Wien, Austria On 20/2/25, at 22:55, Carlo Bevilacqua <carlo.bevilacqua@embl.de> wrote: Hi Pierre, thank you for your feedback. I appreciate that you took the time to go through my definition and highlighting the critical points. I much prefer this rather than starting working with a file format where problem might arise in the future. If we understand what are the reasons behind our choices in the definition we can merge the best of the two approaches, rather than defining two "standards" for the same thing with each of them having their limitations. I will provide an answer to each of the points you raised (I gave numbers to the points in your email below, so it is easier to reference): I am not sure to which attribute you are referring specifically, but I am completely fine with text; I defined enums where I felt it makes sense to do so because there is a discrete number of options (one could always add elements at the end of an enum) I defined the attributes before we started working together and I am very much open to changing them so they reflect what you have in the spreadsheet; in the document defining the file format we can just state that the attributes and their type are defined in the excel sheet I did it this way because in my idea an individual HDF5 file corresponds to a single experiment. If you feel there is an advantage in keeping different experiments in the same file I am open to introduce your structure of subgroups; I honestly feel like this will only make the file unnecessarly large and different experiments would mostly not share much (apart from the metadata, which is anyway a small overhead in terms of filesize). Now of course the question is what you define as an 'experiment': for me different timepoints or measurements at different temperatures/angles/etc on the same sample are a single experiment and I defined the file so that it is possible to save them in a single file; measurements on different samples are not the same experiment in my original idea same as the point 3 same as before, I would put different samples in different files but happy to introduce your structure if you feel there is an advantage the index is used to uniquely identify an entry in the 'Analysed_data' table; it is important in the contest of reconstructing the image (see the definition of the 'tn/image' group) in my opinion spatial coordinates have a privileged role since we are doing imaging and having them well defined it is important to reconstruct the image; for different abscissas I defined the 'parameters' dataset (more in point 14). If one is not doing imaging this dataset can be set to an empty array or a single element (we can include this in the definition) in my idea the "Analyzed_data" group doesn't contain multiple treatments but the result of the fit on the 'final' spectra, which are unique; if you are referring to the 'n' in the 'Shift_n_GHz' that is included in case a multipeak fit is performed. Now, if we want to include the possibility of multiple treatments like you are doing (which I didn't originally consider) we could just add an additional layer to the hierarchy that is the amplitude of the peak from the fit. I am not sure if you didn't understand what I meant or you think it is not an useful information The fit error actually contains 2 quantities: R2 and RMSE (as defined in the type). I am not sure how you would calculate a std from a single spectrum the calibration curves are stored in the 'calibration_spectra' group with the name of the dataset matching the respective 'Calibration_index'. In our VIPA setup we are acquiring multiple calibration curves during a single acquisition to compensate for laser drift, that's why I introduced the possibility of having multiple calibration curves. Note that the 'Calibration_index' is defined as optional exactly because it might not be needed each spectrum can have its own timestamp if it is acquired from a different camera image or scan of a FP, etc that's why it needs to be a dataset. Note that it is an optional dataset good point, we can rename it to PSD that is exactly to account for the general case of the abscissa not being a spatial coordinate and it contains the values for the parameters (e.g. the angles in an angle resolved measurement). It is a dataset whose dimensions are defined in the description (happy to elaborate more if it is not clear) float is the type of each element; it is a dataset whose dimensions are defined in the description; the way to define the frequency axis in general for setups which don't have an absolute frequency (like VIPAs) is tricky and would be good to brainstorm about possibile solutions as for the name we can change it, but the problem on how to deal with the situation when one doesn't have the frequency in GHz remains. My idea here was to leave the possibility of different units because the fit and most of the data analysis can be performed even if the x-axis is not in GHz and the actual conversion of the shift to GHz can be done at the end and requires the calibration data. As in my previous point, I am happy to brainstorm different solutions to this problem it is indeed redundant with 'Analyzed_data' and I pushed a change on GitHub to correct this see point 11; also note that the group is optional (in case people don't need it) and I introduced the attribute "same_as" to avoid repeating it multiple times if it is always the same for all the 'tn' As you see we agree with some of the points or we could find a common solution, for others it was mainly a misunderstanding on what were my intentions (probably my bad in expressing them, but you could have asked if it was not clear). Hope this helps claryfing my reasoning in the file definition and I am happy to discuss all the open points. I will look in details at your newest definition that you shared in the next days. Best, Carlo On Thu, Feb 20, 2025 at 18:25, Pierre Bouvet via Software <software@biobrillouin.org> wrote: Hi, My goal with this project is to unify the treatment of BLS spectra, to then allow us to address fundamental biophysical questions with BLS as a community in the mid-long term. Therefore my principal concern for this format is simplicity: measure are datasets called “Raw_data”, if they need one or more abscissa to be understood, this/these abscissa are called “Abscissa_i” and they are placed in groups called “Data_i” where we can store their attributes in the group’s attributes. From there, I can put groups in groups to store an experiment with different ... (e.g. : samples, time points, positions, techniques, wavelengths, patients, …). This structure is trivial but lacks usability so I added an attribute called “Name” to all groups that the user can define as he wants without impacting the structure. Now here are a few critics on Carlo’s approach. I didn’t want to share them because I hate criticizing anyone’s work, and I do think that what Carlo presented is great, but I don’t want you to think that I just trashed what he did, to the contrary, it’s because I see limitations in his approach that I tried developing another, simpler one. So here are the points I have problems with in Carlo’s approach: The preferred type of the information on an experiment should be text as we’ll likely see new devices (like your super nice FT approach) appear in the next months/years that will require new parameters to be defined to describe them. I think we should really try not to use anything else than strings in the attributes. The experiment information should not be defined by the HDF5 file structure but rather by a spreadsheet because everyone knows how to use Excel, and it’s way easier to edit an Excel file than an HDF5 file. Experiment information should apply to measures and not to files, because they might vary from experiment to experiment, I think their preferred allocation is thus the attributes of the groups storing individual measures (in my approach) The characterization of the instrument might also be experiment-dependent (if for some reason you change the tilt of a VIPA during the experiment for example), therefore having a dedicated group for it might not work for some experiments The groups are named “tn” and the structure does not present the nomenclature of sub-groups, this is a big problem if we want to store in the same format say different samples measured at different times (the logic patch would be to have sub-groups follow the same structure so tn/tm/tl/… but it should be mentioned in the definition of the structure) The dataset “index” in Analyzed_data is difficult to understand, what is it used for? I think it’s not useful, I would delete it. The "spatial position" in Analyzed_data supposes that we are doing mappings. This is too restrictive for no reason, it’s better to generalize the abscissa and allow the user to specify a non-limiting parameter (the “Name” attribute for example) with whatever value he wants (position, temperature, concentration of whatever, …). A concrete example of a limit here: angle measurements, I want my data to be dependent on the angle, not the position. Having different datasets in the same “Analyzed_data” group corresponding to the result of different treatments raises the question of where the process followed to treat the data is stored. A better approach would be to create n groups “Analyzed_data_n” with only one dataset of treated values, allowing for the process to be stored in the attributes of the group Analyzed_data_n I don’t understand why store an array of amplitude in “Analyzed_data”, is it for the SNR? Then maybe we could name this array “SNR”? The array “Fit_error_n” is super important but ill defined. I’d rather choose a statistical quantity like the variance, standard deviation (what I think is best), least-square error… and have it apply to both the Shift and Linewidth array as so: “Shift_std” and “Linewidth_std" I don’t understand “Calibration_index”: where are the calibration curves? Are they in “experiment_info”? If so, we expect people to already process their calibration curves to create an array before adding them to the hdf5 file? I’m not very familiar with all devices, so I might not see the limitations here but do we ever have more than one calibration curve per measure? Could we not add it to the group as a “Calibration” dataset? Or just have one group with the calibration curve? Timestamp is typically an attribute, it shouldn’t be present inside the group as an element. In tn/Spectra_n , “Amplitude” is the PSD so I would call it PSD because there are other “Amplitude” datasets so it’s confusing. If it’s not the PSD, I would call it “Raw_data”. I don’t understand what “Parameters” is meant to do in tn/Spectra_n, plus it’s not a dataset so I would put it in attributes or most likely not use it as I don’t understand what it does. Frequency is a dataset, not a float (I think). We also need to have a place where to store the process to obtain it. In VIPA spectrometers for instance this is likely a big (the main even I think) source of error. I would put this process in attributes (as a text). I don’t think “Unit” is useful, if we have a frequency axis, then we should define it directly in GHz, and if it’s a pixel axis, then for one we should not call it “Frequency” and then it’s better not to put anything since by default we will consider the abscissa (in absence of Frequency) as a simple range of the size of the “Amplitude” dataset. /tn/Images: it’s a good idea, but I believe this is redundant with “Analyzed_data” (?) If it’s not then I don’t understand how we get the datasets inside it. “Calibration_spectra” is a separate group, wouldn’t it be better to have it in “Experiment_info” in the presented structure? Also might scare off people that might not want to store a calibration file every time they create a HDF5 file (I might or might not be one of them) Like I said before, I don’t want this to be taken as more than what lead me to defining a new approach to the format. I want to state once again that Carlo's structure is complete, only it’s useful for specific instruments and applications, and difficultly applicable to other techniques and scenarios (and more lazy people like myself). Following Carlo’s mail, I’ve also completed the PDF I made to describe the structure I use in the HDF5_BLS library, I’m joining it to this email and pushing its code to GitHub, feel free to edit it and criticize it at length (I feel like I deserve it after this email I really tried not to write). Best, Pierre Pierre Bouvet, PhD Post-doctoral Fellow Medical University Vienna Department of Anatomy and Cell Biology Wahringer Straße 13, 1090 Wien, Austria On 20/2/25, at 16:12, Robert Prevedel via Software <software@biobrillouin.org> wrote: Dear all, great to see all this discussion in this thread, and thanks to especially Pierre and Carlo for driving this forward. I’ve been following the various emails and arguments closely but simply didn’t have any time to chip in due to some important committments in the past days. I understand that there was a bit of a disagreement about what the focus of this effort should be, so maybe it just helps to highlight my lab's view on this (which I just discussed in depth with Carlo and Sebastian): Our original motivation was to come up with and define a common file-format, as we regard this to be key to unify the processing and visualization of Brillouin data by the community. In this respect, we would be happy to focus our efforts on defining this format and taking care of implementing the necessary processing/visualization software and interface that allows anyone to look at the data in the same way. We also regard this to be crucial if we want to standardize the reporting of Brillouin data from diverse setups/users/applications. Therefore, at this stage it would be extremely important to agree on the structure of the file format. Carlo has proposed a very well thought-through structure for this, and it would be great to get your concrete feedback on this, as I understand this hasn’t really happened yet. To aid in this, e.g. Pierre and/or Sal could try to convert or save your standard data into this structure, and report on any difficulties or ambiguities that he encounters. Based on this I agree it’s best to meet and discuss and iron this out as a next step, however it either has to be next week (ideally Fri?), or after March 12 as I am travelling back-to-back in the meantime. Of course feel free to also meet without me for more technical discussions if this speeds up things. Either way we could then also discuss the file format etc. for the ‘raw’ data that Pierre proposed (and which is indeed very valuable as well). Let me know your thoughts, and let’s keep up the great momentum and excitement on this work! Best, Robert -- Dr. Robert Prevedel Group Leader Cell Biology and Biophysics Unit European Molecular Biology Laboratory Meyerhofstr. 1 69117 Heidelberg, Germany Phone: +49 6221 387-8722 Email: robert.prevedel@embl.de http://www.prevedel.embl.de On 20.02.2025, at 10:29, Carlo Bevilacqua via Software <software@biobrillouin.org> wrote: Hi Kareem, thanks for the suggestion, I agree that it is a good (and easy) way to divide the tasks! Just to be clear, it is not that I don't see the need/advantage of providing some standard treatment going from raw data to standard spectra, it is just that was not my priority when proposing the idea of a unified file format. Regarding the file format, splitting the one containing the raw data and the treatments from the one containing the spectra and the image in a standard format might be a good solution and we can always merge them at a later stage. As for the file containing the "standard" spectra, it would be very helpful if you can give some feedback on the structure I originally proposed. Keep in mind that the idea is to be able to associate spectrum/spectra to each pixel in the image, in a way that is independent of the scanning strategy and underlaying technique. I tried to find a solution that works for the techniques I am aware of, considering the peculiarities (e.g. for most VIPA setups there is no absolute frequency axis but only relative to water). If am happy to discuss why I made some specific choices and if you see a better way to achieve the same or see things differently. Both the 3rd and the 4th of March work for me. Best, Carlo On Thu, Feb 20, 2025 at 02:50, Kareem Elsayad via Software <software@biobrillouin.org> wrote: Dear All, (and I guess especially Carlo & Pierre 😊) I understand both your (main) points concerning what this all should be, and I think this is actually perfect for dividing tasks. The format of the hf or bh5 file being where things meet and what needs to be agreed on. The thing with raw data is ofcourse that it is variable between instruments and labs, and the conversion to “standard spectra” that can then be fitted etc. is going to be unique (maybe even between experiments in same project). That said, asking people to create some complex file from their data that works with a developed software is also unlikely to get a following. So (the way I see it) there are basically two parts. Getting from raw data to h5 (or bh5) format which contains the spectra in standard format. And then the whole analysis part and visualization (GUI, pretty features, etc.). While the latter may get the spotlight, it obviously relies heavily on the former being done right. Given that there are numerous “standard” BLS setup implementations the development of software for getting from raw data to h5 I think makes sense, since the h5 will no doubt be cryptic, and creating a working h5 is not something everyone will want to program by themselves (it is not an insignificant step given we are also trying to ultimately cater to biologists). As such a software that generates the h5 files, with drag and drop features and entering system parameters, for different setups makes sense and will save many labs a headache if they don’t have a good programmer on hand. So I would suggest that Pierre & Sal lead the work on developing this, while Carlo & Sebastian lead the work on developing the analysis/interface-presentation part. This way things are nicely divided and we just need to agree on the h5 file that is transferred between the two. From the side of Pierre & Sal there could maybe also be a second h5 generated that contains all the raw data and details on how it was converted to the transferred h5 file (for complete transparency this could then also be reported in papers if people wish). These could exist as two separate programs with respective GUIs but also eventually combined to a single one. How does this sound to everyone? To clear up details and try assign tasks going forward how about a Zoom first week of March (I would be free Monday 3rd and Tue 4th after 1pm)? All the best, Kareem From: Carlo Bevilacqua via Software <software@biobrillouin.org> Reply to: Carlo Bevilacqua <carlo.bevilacqua@embl.de> Date: Wednesday, 19. February 2025 at 20:43 To: Pierre Bouvet <pierre.bouvet@meduniwien.ac.at> Cc: <software@biobrillouin.org> Subject: [Software] Re: [EXTERN] Re: Software manuscript / BLS microscopy Hi Pierre, I realized that we might have slightly different aims. For me the most important part of this project is to have a unified file format that can be read and visualized by a standard software. The file format you are proposing is not sufficient for that in my opinion. For example one of my main motivation was to have an interface where the user can see the reconstructed image, click on a pixel, see the corresponding spectrum to check its quality and maybe try different fitting functions; that would already not be possible with your structure because the software would have no notion on where the spectral data is stored and how to associate it to a specific pixel. I don't see the structure of the file to be too complex as an issue, as long as it is functional: we can always provide an API and/or a GUI that allow people to take their spectra and save them in whatever format we decide without bothering about understanding the actual structure, the same way you can work with HDF5 file without having any understanding on how the data is actually stored on the disk. My idea of making a webapp as a GUI follows directly from there. Typical case: I sent some data to a collaborator and they can just run the app in their browser and check if the outliers they see in the image are real or a bad spectra. Similarly if we make a common database of Brillouin spectra, people can explore it easily using the webapp. From what I understood, you are instead more interested in going from raw data to an actual spectrum, which I don't see so much as a priority because each lab has their own code already and the actual procedure would be different for each lab (apart from standard instruments like the FP). I am not saying this should not be part of the software but not as a priority and rather has a layer where people can easily implement their own code (of course we could already implement code for standard instruments). I think it would be good to cleary define what is our common aim now, so we are sure we are working in the same direction. Let me know if you agree or I misunderstood what is your idea. Best, Carlo On Wed, Feb 19, 2025 at 16:11, Pierre Bouvet <pierre.bouvet@meduniwien.ac.at> wrote: Hi, I think you're trying to go too far too fast. The approach I present here is intentionally simple, so that people can very quickly get to storing their data in a HDF5 file format together with the parameters they used to acquire them with minimal effort. The closest to what you did is therefore as follows: - data are datasets with no other restriction and they are stored in groups - each group can have a set of attribute proper to the data they are storing - attributes have a nomenclature imposed by a spreadsheet and are in the form of text - the default name of a data is the name of a raw data: “Raw_data”, other arrays can have whatever name they want (Shift_5GHz, Frequency, ...) - arrays and attributes are hierarchical, so they apply to their groups and all groups under it. This is the bare minimum to meet our needs, so we need to stop here in the definition of the format since it’s already enough to have the GUI working correctly, and therefore the first version of the unified software advertised. Of course we will have to refine things later on, but we don’t want to scare people off by presenting them a file description that for one might not match their measurements and that is extremely hard to conceptually understand. To make my point clearer, take your definition of the format for example: there are 3 different amplitude arrays in your description, two different shift arrays and width arrays that are of different dimension, then we have a calibration group on one side but a spectrometer characterization array in another group that is called “experiment_info”, that’s just too complicated to use correctly. On the other hand, placing your raw data “as is” in a group dedicated to this data is conceptually easy and straightforward. Where you are right, is that should we have hundreds of people using it, we might in a near future want to store abscissa, impulse responses, … in a standardized manner. In that case, the question falls down to either adding sub-groups or storing the data together with the measure. Both are fine and don’t really pose a problem for now, essentially because we are not trying to visualize the results but just trying to unify the way to get them. Now regarding Dash, if I understand correctly, it’s just a way to change the frontend you propose? If that’s so, why not, but then I don’t really see the benefits: if you really want to use dash, you can always embed it inside a Qt app. Also Dash being browser based, you will only have one window for the whole interface, which will be a pain to deal with if you want to use the interface to do everything the GUI is expected to do (inspect an H5 file, convert PSD, treat data, edit parameters, inspect a failed treatment, simulate results using setups with slight changes of parameters…). We agree that at one point when people receive an h5 file, it will be useful to have a web interface that can do what yours or Sal’s GUI do (seeing the mapping results together with the spectrum, eventually the time-domain signal) but here again, it’s going too far too soon: let’s first have a simple and reliable GUI that can convert data from any spectrometer to PSDs and treat them with a unified code. This is the real challenge, visualization and nomenclature of results are both important but secondary. Also keep in mind that, the frontend can easily be generated by anyone really, with Copilot or ChatGPT or whatever AI, but you can’t ask them to develop the function that will correctly read your data and convert them to a PSD nor treat the PSD. This is done on the backend and is the priority since the unification essentially happens there. Best, Pierre Pierre Bouvet, PhD Post-doctoral Fellow Medical University Vienna Department of Anatomy and Cell Biology Wahringer Straße 13, 1090 Wien, Austria On 19/2/25, at 13:21, Carlo Bevilacqua <carlo.bevilacqua@embl.de> wrote: Hi Pierre, thanks for your reply. Regarding the file structure, what I am still not very clear about is what you define as Raw_data and data, how the actual spectra are stored and how the association to spatial coordinates and parameters is made. That's why I would really appreciate if you could make a document similar to what I did, where it is clear what each group should (or can) contain, what is the shape of each dataset, which attributes they have, etc... I am not saying that this should be the final structure of the file but I strongly believe that having it written in a structured way helps defining it and seeing potential issues. Regarding the webapp, it works by separating the frontend, which run in the browser and is responsible of running the GUI, and the backend which is doing the actual computation and that you can structure as you like with multithreading or any optimization you wish. The communication between frontend and backend is handled transparently by the framework, so you don't have to take care of it. When you run Dash locally a local server is created so the data stays on your computer and there is no issue with data transfer/privacy. If we want to move it to a server at a later stage, then you are right about the fact that data needs to be transferred to a server (although there might be solutions that allow you to still run the computation on the local browser, like WebAssembly, but I think it is too complex to look into this at this stage). Regarding safety and privacy, the data will be stored on the server only for the time that the user is using the app and then deleted (of course we will need to make a disclaimer on the website about this). Regarding space I don't think people at the beginning will load their 1Tb dataset on the webapp but rather look at some small dataset of few tens of Gb; in that case 1Tb of server space is more than enough (remember that the file will be stored only for the time the user is using the app). If people really start to use the webapp and space becomes a limitation, I would be super happy to look into WebAssembly so that the data can be handled locally from the browser without transferring it to the server. To summarize I would agree that, at this stage, there might be no advantage of a webapp over a local GUI (and might actually be a bit more work to develop it). But, if this project really flies, the potential of a webapp is huge, especially in the context of the BioBrillouin society where we want to have a database of spectral data and the webapp could be used to explore that without downloading anything on your computer. My main point is that moving now to a webapp would not be too much work, but if we want to do it at a later stage it will basically entail re-writing everything from scratch. Let me know what are your thoughts about it. Best, Carlo On Wed, Feb 19, 2025 at 08:51, Pierre Bouvet <pierre.bouvet@meduniwien.ac.at> wrote: Hi Carlo, You’re right, the format is still a little fuzzy. The main idea is to have a data-based hierarchy for storage: each data is stored in an individual group. From there, abscissa dependent on the data are stored in the same group and the treated data are stored in sub-groups. The names of the groups and sub-groups are fixed (Data_i), as is the name of the raw data (Raw_data) and abscissa (Abscissa_i). Also, the measure and spectrometer-dependent arguments have a defined nomenclature. To differentiate groups between them, we preferably attribute them a name as an attribute that is not used as an identifier, the identifier being either the path to the data/group from file root (Data_0/Data_42/Data_2/Raw_data) or potentially a hash value (not implemented). This I think allows all possible configurations, and using an hierarchical approach we can also pass common attributes and arrays (parameters of the spectrometer or abscissa arrays for example) on parent to reduce memory complexity. Now regarding the use of server-based GUI, first off, I’ve never used them so I’m just making supposition here but if the platform is able to treat data online, it will have to store the spectra somewhere in memory and it will not be local. My primary concerns with this approach is safety, particularly in terms of intellectual property protection, ethical considerations, and potential security vulnerabilities. Additionally, managing storage space will be a headache. Now, this doesn’t mean that we can’t have a server-based data plotter, or a server-based interface that does treatments locally but I don’t really see the benefits of this over a local software that can have multiple windows, which could at one point be multithreaded, and that could wrap c code to speed regressions for example (some of this might apply to Dash, I’m not super familiar with it). Now regarding memory complexity, having all the data we treat go on a server is a bad idea as it will raise the question of cost which will very rapidly become a real problem. Just an example: for a 100x100 map, I need 10Gb of memory (1Mo/point) with my setup (1To of archive storage is approximately 1euro/month) so this would get out of hands super fast assuming people use it. Now maybe there are solutions I don’t see for these problems and someone can take care of them but for me it’s just not worth the effort when having a local GUI solves all of these issues at once. But if you find a solution, then I’ll be happy to migrate to Dash, it won’t be fast to translate every feature but I can totally join you on the platform. Best, Pierre Pierre Bouvet, PhD Post-doctoral Fellow Medical University Vienna Department of Anatomy and Cell Biology Wahringer Straße 13, 1090 Wien, Austria On 18/2/25, at 20:26, Carlo Bevilacqua <carlo.bevilacqua@embl.de> wrote: Hi Pierre, regarding the structure of the file, I agree that we should keep it simple. I am not suggesting to make it more complex, rather to have a document where we define it in a clear and structured way rather than as a general description, to make sure that we are all on the same page. I am saying this because, to be honest, I am not sure I fully understand how you are structuring the HDF5 and I think it is important to agree on this now, rather than finding at a later stage that we had different ideas. Ideally if the GUI should be part of a single application, we should write it using a unified framework. The reasons why, after considering it for a bit, I lean towards Dash rather than Qt are: it can run in a web browser so it will be easy to eventually move it to a website, thus people can use it without installing it (which will hopefully help in promoting its use) it is based on plotly which is a graphical library with very good plotting capabilites and highly customizable, that would make the data visualization easier/more appealing Let me know what you think about it and if you see any advantage of Qt over a web app which I am not considering. Also, if we agree that Dash might be a better option, would you consider migrating to Dash? It might not be too much work if most of the code you wrote is for data processing rather that for the GUI itself and I could help you with that. Alternatively one workaround is to have a QtWebEngine in your Qt app and have the Dash app run inside that, but that would make only the Dash part portable to a server later on. Best, Carlo On Tue, Feb 18, 2025 at 10:24, Pierre Bouvet <pierre.bouvet@meduniwien.ac.at> wrote: Hi, Thanks, More than merge them later, just keep them separate in the process and rather than trying to build "one code to do it all", build one library and GUI that encapsulate codes to do everything. Having a structure is a must but it needs to be kept as simple as possible else we’ll rapidly find situations where we need to change the structure. The middle ground I think is to force the use of hierarchies and impose nomenclatures where problem are expected to appear: each dataset has its own group, each group can encapsulate other groups, each parameter of a group applies to all its sub-groups if the subgroup does not change its value, each array of a group applies to all of its sub-groups if the sub-group does not redefine an array with same name, the names of the groups are held as parameters and their ID are managed by the software. For the Plotly interface, I don’t know how to integrate it to Qt but if you find a way to do it, that’s perfect with me :) My vision of the GUI is something that unifies the format and can then execute scripts on the data stored in this format. I have pushed the application of the GUI to my data up to the point where I can do the whole information extraction process from it (add data, convert to PSD, fit curves). I think this could be super interesting if we implement it for all techniques. I think we could formalize the project in milestones, in particular define the minimal denominator that will allow us to have the paper. The milestone I reached for my spectro encompasses the following points: - Being able to add data to the file easily (by dragging & dropping to the GUI) - Being able to assign properties to these data easily (again by dragging & dropping) - Being able to structure the added data in groups/folders/containers/however we want to call it - Making it easy for new data types to be loaded - Allowing data from same type but different structure to be added (e.g. .dat files) - Execute scripts on the data easily and allowing parameters of these scripts to be defined from the GUI (e.g. select a peak on a curve to fit this peak) - Make it easy to add scripts for treating or extracting PSD from raw data. - Allow the export of a Python code to access the data from the file (we cans see them as “break points” in the treatment pipeline) - Edit of properties inside the GUI In any case I think we could build a spec sheet for the project with what we want to have in it based on what we want to advertise in the paper. We can always add things later on but if we agree on a strict minimum to have the project advertised, then that will set its first milestone on which we’ll be able to build later on. Best, Pierre Pierre Bouvet, PhD Post-doctoral Fellow Medical University Vienna Department of Anatomy and Cell Biology Wahringer Straße 13, 1090 Wien, Austria On 17/2/25, at 14:53, Carlo Bevilacqua via Software <software@biobrillouin.org> wrote: Hi Pierre, hi Sal, thanks for sharing your thoughts about it. @Pierre I am very sorry that Ren passed away :( As far as I understood you are suggesting to work on the individual aspects separately and then merge them together at a later stage? I am fine with that but I still think it is very important to now agree on what should be in the file format we are defining, because that is kind of the core of the project and will affect a lot of the design choices. I am happy to start working on the GUI for data visualization. In my idea, it will be something similar to this but written in dash, so it is a web app that for now can run locally (so no transfer of data to an external server is required) but in the future can easily be uploaded to a website that people can just use without installing anything on their computer. The question is how much of the data processing should be possible to do (or trigger) from the same GUI? I think at least a drop down menu with different fitting functions should be there, so the user can quickly check the results on a spectrum from a specific point in the image. @Pierre how are you envisioning the GUI you are working on? As far as I understood it is mainly to get the raw data and save it to our HDF5 format with some treatment on it. One idea could be to have a shared list of features that we are implementing in the GUI as we work on it, to avoid having the same functionality duplicated (or worst inconsistent) between the GUI for generating our file format and the GUI for visualization. Let me know what you think about it. Best, Carlo On Mon, Feb 17, 2025 at 11:04, Pierre Bouvet via Software <software@biobrillouin.org> wrote: Hi everyone, Sorry for the delayed response, I just went through the loss of Ren (my dog) and wasn’t at all able to answer. First of, Sal, I am making progress and I should have everything you have made on your branch integrated to the GUI branch soon, at which point I will push everything to main. Regarding the project, I think I align with Sal: keep things as simple as possible. My approach was to divide everything in 3 mostly independent layers: - Store data in an organized file that anyone can use, and make it easy to do - Convert these data into something that has physical significance: a Power Spectrum Density - Extract information from this Power Spectrum Density Each layer has its own challenge but they are independent on the challenge of having people using it: personally, if I had someone come to me with a new software to play with my measures, I would most likely only look at it for 1 minute (or less depending who made it) with a lot of apprehension and then based on how simple it looks and how much I understood of it, use it or - what is most likely - discard it. This is why Project.pdf is essentially meant to say: we put data arrays in groups and give them attributes written in text, but you can also create groups within groups to organize your data! I believe most of the people in the BioBrillouin society will have the same approach and before having something complex that can do a lot, I think it’s best to have something simple that can just unify the format (which in itself is a lot) and that people can use right away with a minimal impact on their own individual pipelines for data processing. To be honest, I don’t think people will blindly trust our software at first to treat their data, but they will most likely use it at first to organize their raw spectra, and maybe add their own treated data if they are feeling particularly adventurous. But that is not a problem as long as we start a movement. From there yes, we can complexity and create custom file architectures but that is already too complex I think for this first project. If we can all just import our data to the wrapper and specify their attributes, this will already be a success. Then for the paper, if we can all add a custom code to treat these data to obtain a PSD, I think this will be enough. As I said, the current API already allows you to add your data in a variety of format, so it’s just a question of developing the PSD conversion before having something we can publish (and then tell people to use). A few extra points: - Working with my setup, I realized if the user could choose between different algorithms to treat their own data, it would make the overall project much more usable (if an algorithm bugs for whatever reason, you can use another one) so I created 2 bottle necks in the form of functions (for PSD conversion and treatment) that would inspect modules dedicated to either PSD conversion or treatment, and list existing functions. It’s in between classical and modular programming but it makes the development of new PSD conversion code and treatment way way easier - The GUI is developed using oriented-object programming. Therefore I have already made some low-level choices that kind of impact all the GUI. I’m not saying they are the best choices, I’m just saying that they work, so if you want to work on the GUI, I would either recommend getting familiar with these choices, or making sure that all the functionalities are preserved, particularly the ones that are invisible (logging of treatment steps, treatment errors…) I’ll try merging the branches on Git asap and will definitely send you all an email when it’s done :) Best, Pierre Pierre Bouvet, PhD Post-doctoral Fellow Medical University Vienna Department of Anatomy and Cell Biology Wahringer Straße 13, 1090 Wien, Austria On 14/2/25, at 19:36, Sal La Cavera Iii via Software <software@biobrillouin.org> wrote: Hi all, I agree with the things enumerated and points made by Kareem/Carlo! I guess I would advocate for starting from a position of simplicity. We probably don't want to get weighed down by trying to include a bunch of bells and whistles from the start as these can be easily added once there is a minimally viable stable product. As long as data can be loaded to local memory, then treated in various (initially simple) ways through the GUI (and maybe maintain non-GUI compatibility for command-line warriors like myself), then the bh5 formatting stuff can be sorted on the back end? I definitely agree with Carlo's structure set out in the file format document; but all of that data will be floating around the memory in some shape or form and just needs to be wrapped up and packaged (according to Carlo's structure e.g.) when the user is happy and presses the "generate h5 filestore" etc. (?) Definitely agree with the recommendation to create the alpha using mainly requirements that our 3 labs would find useful (import filetypes, treatments, etc), and then we can add on more universal functionality second / get some beta testers in from other labs etc. I'm able to support on whatever jobs need doing and am free to meet in the beginning of March like you mentioned Kareem. Hope you guys have a nice weekend, Cheers, Sal --------------------------------------------------------------- Salvatore La Cavera III Royal Academy of Engineering Research Fellow Nottingham Research Fellow Optics and Photonics Group University of Nottingham Email: salvatore.lacaveraiii@nottingham.ac.uk ORCID iD: 0000-0003-0210-3102 <Outlook-tygjxucs.png> Book a Coffee and Research chat with me! From: Carlo Bevilacqua via Software <software@biobrillouin.org> Sent: 12 February 2025 13:31 To: Kareem Elsayad <kareem.elsayad@meduniwien.ac.at> Cc: sebastian.hambura@embl.de <sebastian.hambura@embl.de>; software@biobrillouin.org <software@biobrillouin.org> Subject: [Software] Re: Software manuscript / BLS microscopy You don't often get email from software@biobrillouin.org. Learn why this is important Hi Kareem, thanks for restarting this and sorry for my silence, I just came back from US and was planning to start working on this again. Could you also add Sebastian (in CC) to the mailing list? As you outlined, I would split the project into two parts: 1) getting from the raw data to some standard "processed' spectra and 2) do data analysis/visualization on that. For the second part the way I envision it is: the most updated definition of the file format from Pierre is this one, correct? In addition to this document I think it would be good to have a more structured description of the file (like this), where each field is clearly defined in terms of data type and dimensions. Sebastian was also suggesting that the document should contain the reasoning behind each specific choice in the specs and also things that we considered but decided had some issues (so in future we can look back at it). I still believe that the file format should contain the "processed" spectra (i.e. after FT and baseline subtraction for impulsive, or after taking a line profile and possibly linearization with VIPA,...) so we can apply standard data processing or visualization which is independent on the actual underlaying technique (e.g. VIPA, FP, stimulated, time domain, ...) agree on an API to read the data from our file format (most likely a Python class). For that we should: 1) decide on which information is important to extract (spectral information, spatial coordinates, hyper-parameters, metadata,...) 2) implement an interface to read the data (e.g. readSpectrumAtIndex(...), readImage(...), ...) build a GUI that use the previously defined API to show and process the data. I would say that, once we have a very solid description of the file format as in step 1, step 2 will come naturally and we can divide the actual implementation between us. Step 3 can also easily be implemented and divided between us once we have an API (and I am happy to work on the GUI myself). The first half of the project is the trickiest and I know Pierre has already done a lot of work in that direction. We should definitely agree on which extent we can define a standard to store the raw data, given the variability between labs, (and probably we should do it for common techniques like FP or VIPA) and how to implement the treatments, leaving to possibility to load some custom code in the pipeline to do the conversion. Let me know what you all think about this. If you agree I would start by making a document which clearly defines the file format in a structured way (as in my step 1 before). @Pierre could you write a new document or modify the document I originally made to reflect the latest structure you implemented for the file format? The metadata can still be defined in a separated excel sheet, as long as the data type and format is well defined there. Best regards, Carlo On Wed, Feb 12, 2025 at 02:19, Kareem Elsayad via Software <software@biobrillouin.org> wrote: Hi Robert, Carlo, Sal, Pierre, Think it would be good to follow up on software project. Pierre has made some progress here and would be good to try and define tasks a little bit clearer to make progress… There is always the potential issue of having “too many cooks in the kitchen” (that have different recipes for same thing) to move forward efficiently, something that I noticed can get quite confusing/frustrating when writing software together with people. So would be good to clearly assign tasks. I talked to Pierre today and he would be happy to integrate things in framework we have to try tie things together. What would foremost be needed would be ways of treating data, meaning code that takes a raw spectral image and meta-data and converts it into “standard” format (spectral representation) that can then be fitted. Then also “plugins” that serve a specific purpose in the analysis/rendering that can be included in framework. The way I see it (and please comment if you see differently), there are ~4 steps here: Take raw data (in .tif,, .dat, txt, etc. format) and meta data (in .cvs, xlsx, .dat, .txt, etc.) and render a standard spectral presentation. Also take provided instrument response in one of these formats and extract key parameters from this Fit the data with drop-down menu list of functions, that will include different functional dependences and functions corrected for instrument response. Generate/display a visual representation of results (frequency shift(s) and linewidth(s)), that is ideally interactive to some extent (and maybe has some funky features like looking at spectra at different points. These can be spatial maps and/or evolution with some other parameter (time, temperature, angle, etc.). Also be able to display maps of relative peak intensities in case of multiple peak fits, and whatever else useful you can think of. Extract “mechanical” parameters given assigned refractive indices and densities I think the idea of fitting modified functions (e.g. corrected based on instrument response) vs. deconvolving spectra makes more sense (as can account for more complex corrections due to non-optical anomalies in future –ultimately even functional variations in vicinity of e.g. phase transitions). It is also less error prone, as systematically doing decon with non-ideal registration data can really throw you off the cliff, so to speak. My understanding is that we kind of agreed on initial meta-data reporting format. Getting from 1 to 2 will no doubt be most challenging as it is very instrument specific. So instructions will need to be written for different BLS implementations. This is a huge project if we want it to be all inclusive.. so I would suggest to focus on making it work for just a couple of modalities first would be good (e.g. crossed VIPA, time-resolved, anisotropy, and maybe some time or temperature course of one of these). Extensions should then be more easy to navigate. At one point think would be good to involve SBS specific considerations also. Think would be good to discuss a while per email to gather thoughts and opinions (and already start to share codes), and then plan a meeting beginning of March -- how does first week of March look for everyone? I created this mailing list (software@biobrillouin.org) we can use for discussion. You should all be able to post to (and it makes it easier if we bring anyone else in along the way). At moment on this mailing list is Robert, Carlo, Sal, Pierre and myself. Let me know if I should add anyone. All the best, Kareem This message and any attachment are intended solely for the addressee and may contain confidential information. If you have received this message in error, please contact the sender and delete the email and attachment. Any views or opinions expressed by the author of this email do not necessarily reflect the views of the University of Nottingham. Email communications with the University of Nottingham may be monitored where permitted by law. _______________________________________________ Software mailing list -- software@biobrillouin.org To unsubscribe send an email to software-leave@biobrillouin.org _______________________________________________ Software mailing list -- software@biobrillouin.org To unsubscribe send an email to software-leave@biobrillouin.org _______________________________________________ Software mailing list -- software@biobrillouin.org To unsubscribe send an email to software-leave@biobrillouin.org _______________________________________________ Software mailing list -- software@biobrillouin.org To unsubscribe send an email to software-leave@biobrillouin.org _______________________________________________ Software mailing list -- software@biobrillouin.org To unsubscribe send an email to software-leave@biobrillouin.org _______________________________________________ Software mailing list -- software@biobrillouin.org To unsubscribe send an email to software-leave@biobrillouin.org
Hi Kareem, thank you for your email. We are discussing with Pierre about the details of the file format and hopefully by our next meeting we will have agreed on a file format and we can divide the tasks. If it is still an option, Friday 28th at 3pm works for me. Best regards, Carlo On Mon, Feb 24, 2025 at 03:17, Kareem Elsayad wrote: Dear All, I (and Robert) were hoping there would be some consensus on this h5 file format. Let us do a Zoom on Fri 28th Feb at 15:00? A couple of points pertaining to arguments… Firstly, the precise structure is not worth getting into big arguments or fuss about…as long as it contains all the information needed for the analysis/representation, and all parties can work with (able to write and read knowing what is what), it ultimately doesn’t matter. In my opinion better put more (optional) stuff in if that is issue, and make it as inclusive as possible. In the end this does not need to be read by analysis/representation side, and when we go through we can decide if and what needs to be stripped. It is after all the “black box” between doing the experiment and having your final plots/images. Take a look at say a Zeiss file and try figure all that’s in it (it is not ideally structured maybe, but no biologist ever cared) – that said, I am sure their team had very similar arguments concerning structure etc.! (you have as many opinions as people). Maybe the issue is that the boundary conditions were not as well defined, but I would say at this point make them more inclusive than they need to be (empty spaces cost little memory) Secondly, and following on from firstly. We need to simply agree and compromise to make any progress asap. Rather than building separate structures we need to add/modify a single existing structure or we might as well be working on independent projects. Carlo’s initially proposed structure seemed reasonable, maybe with some minor changes, and we should just go with that as a basis in my opinion. I would suggest that Pierre and Carlo have a Zoom together and try and come up with something that is acceptable to both. Like everything in life, this will involve making compromises. And then present it on 28th Feb. Quite simply, if there is no agreement we cannot do this project and in the end it doesn’t matter who is right or wrong. Finally, I hope the disagreements from both sides are not seen as negative or personal attacks –it is ok to disagree (that’s why we have so many meetings!) On the plus side we are still more effective than the Austrian government (that is still deciding who should be next prime minister like half a year after elections) 😊 All the best, Kareem From: Pierre Bouvet via Software Reply to: Pierre Bouvet Date: Friday, 21. February 2025 at 11:55 To: Carlo Bevilacqua Cc: Subject: [Software] Re: [EXTERN] Re: Software manuscript / BLS microscopy Hi Carlo, Thanks for your reply, here is the next pong of this ping pong series ^^ 1- I was talking indeed about the enums, but also the parameters that are defined as integers or floating point numbers and uint32. I think its easier (and that we already agreed on) having a spreadsheet with the parameters (easy to use, easy to update, easy to store and modify between two experiments using the same setup, allows to impose fixed choices for some parameters with drop-down lists, allows to detail the requirements for the attribute like its format or units and allows examples) and to just import it in the HDF5 file. From there it’s easier to have every attribute as strings both for the import and for the concept of what an attribute is. 2- OK 3- The problem is not necessarily the number of experiments you put in the file but the number of hyper parameters you want to take into account. Let’s take an example with a doubtable sense: I want to study the effect of low-frequency temperature fluctuations on micro mechanics in active samples both eukaryote and prokaryote showing a layered structure (endothelial cells arranged in epidermis, biofilms, …) with different cell types, and as a function of aging. I would then create a file with a first range of groups for the age of the sample, then inside these groups 2 groups for eukaryote and prokaryote samples, then inside these groups N groups for the samples I’m looking at, then inside these groups M groups for the temperature fluctuations I impose, then inside these groups the individual measures I make (this is fictional, I’m scared just to think at the amount of work to have all the samples, let alone measure them), this is simply not possible with your approach I think, and even simpler experiments like to measure the Allan variance on an instrument using 2 samples is not possible with your structure I think. 4- / 5- I think the real question is what we expect to get from a wrapper: for me is to wrap the measures of a given study, to then share, link to papers, treat using new approaches… Having a structure that can wrap both a full study and an experiment is in my opinion better in the long run than forcing the format to be used with only one experiment. 6- Yes, I understand it is an identifier, but why an integer? Why not a tuple? Why not a hash? And what if there’s a bug and instead of 3 you store you store 3.0, or 2, or ‘e'? Do you imagine the amount of work to understand where this bug comes from? Assuming it’s a bug because it might very well be just an inexperienced user making a mistake and then your file is broken. The idea is good but the safer way to have this is to work with nD arrays where the dimensionality is conserved I think, or just have all the information in the same group. 7- Here again, it’s more useful for your application but many people don’t use maps, so why force them to have even an empty array for that? Plus if they need to have a dedicated array for the concentration of crosslinkers (for example), they are faced with a non-trivial solution, which means they won’t use the format. 8- Yes, we could add an additional layer, but then it means that if you don’t need it, your datasets are in plain in the group and if you need it, then you don’t have the same structure. The solution I think is to already have the treated data in a group, if you don’t need more than one group (which will be most of the time the case) then you’ll only have one group of treated data. 9- I think it’s not useful. The SNR on the other hand is useful, because in shot-noise regime it’s a marker of variance, and this is one of the ways to spot outliers from treatment (if the SNR doesn’t match the returned standard deviation on the shift of one peak, there’s a problem somewhere). 10- The std of a fit is obtained by taking the square root of the diagonalized covariant matrix returned by the fit as long as your parameters are independent (it’s super interesting actually and a little bit more complicated but it’s true enough for lorentzian, DHO, Gaussian...) 11- OK but then why not have the calibration curves placed with your measures if they are only applicable to this measure? Once again, I think having indexes that are modifiable by the user is not safe (the technical term is “idiot proof”) 12- I don’t agree, if you are capturing points at a fixed interval, then you can reconstruct the timestamp from the timestamp of the first acquisition and either the delay between two acquisitions or the timestamp of the last acquisition. Most of the time however we don’t even need this as we consider the sample to be time-invariant on the scale of our measure, so a single timestamp for all the measure is enough and is better stored as an attribute. In the special case where we are not time-invariant, then time becomes the abscissa of the measures and in that case yes, it can be a dataset, but then it’s better to not impose a fixed name for this dataset and rather let the user decide what hyper parameter is changed during he’s measure, this way the user is free to use whatever hyper parameters he feels like it. 13- OK 14- Still not clear to me. My approach is to consider an experiment to be a measure of a sample as function of one or more controlled or measured hyper parameter. So my general approach for storing experiments is have 3 files: abscissa (with the hyper parameters that vary), measure and metadata, which translates to “Raw_data”, “Abscissa_i” and attributes for this format. 15- OK, I think more than brainstorming about how to treat correctly a VIPA spectrum, we need to allow people to tell how they do it if we want this project to be used in short term, unification is a goal of this project and we will advertise it in the paper, but to be honest, I doubt people like Giuliano will run with it without second guessing it, particularly with its clinical setups, so there will be some going back and forth before we have something stable, and this means we need to allow for this back and forth to appear somewhere, I propose having it as a parameter. 16- Here I think you allow too much liberty, changing the frequency of an array to GHz is trivial and I think most people do use GHz as the unit of their frequency arrays anyway. We need to make it clear that the frequency axis is in GHz but I think we don’t need a full element for this. If you really want to specify the unit of the Frequency dataset, I would suggest putting it in its attributes in any case, and not as another element in the structure. 17- OK 18- I think it’s one way to do it but it is not intuitive: I won’t have the reflex to go check in the attributes if there is a parameter “sam_as” to see if the calibration applies to all the curves. The way I would expect it to be is using the hierarchical logic of the format: if I’m looking at a dataset in a sub-group of a group containing a calibration dataset, then I know this calibration applies to my data: Data |- Data_0 (group) | |- Calibration (dataset) | |- Data_0 (group) | | |- Raw_data (dataset) | |- Data_1 (group) | | |- Raw_data (dataset) |- Data_1 (group) | |- Calibration (dataset) | |- Data_0 (group) | | |- Raw_data (dataset) I think in this example most people would suppose Data/Data_0/Calibration applies both to Data/Data_0/Data_0/Raw_data and Data/Data_0/Data_1/Raw_data but not Data/Data_1/Data_0/Raw_data whose calibration is intuitively Data/Data_1/Calibration Once again, my approach of the structure is trying to make it intuitive and most of all, simple. For instance if I place myself in the position of someone that is willing to try “just to see how it works”, I would give myself 10s to understand how I could have a file for only one measure that complies with the new (hope to be) standard. It is my opinion as I already told you before, that your approach is too complete and therefore complex, which will inevitably lead to people not using the format unless there’s a GUI to do it for them (and even then they might not use it). I don’t want to impose my vision here, and like you I have put a lot of thinking (and testing) into building the format I propose, but I’m convinced that if we go with your structure, not only will it make it hard for anyone to understand how to use it but we’ll have problems using it ourselves. I want to repeat that I don’t have the solution, I’m just confident that my approach is much easier to conceptually understand and less restrictive than yours. In any case we can agree to disagree on that, but then it’ll be good to have an alternative backend like the one I did with your format to try and use it, and see if indeed it’s better, because if it’s not and people don’t use it, I don’t want to go back to all the trouble I had building the library, docs and GUI just to try. I don’t want to impose you anything but it would be awesome if you took the time to read the document I made and completed for you yesterday. Then you can just tell me where you think I’m missing something and you had a better solution because as you might see, I’m having problems with nearly all your structure and we can’t really use it as a starting point at this stage since most of the backend is written and the front-end is already functional for my setup (and soon Sal’s and the TFP). Best, Pierre Pierre Bouvet, PhD Post-doctoral Fellow Medical University Vienna Department of Anatomy and Cell Biology Wahringer Straße 13, 1090 Wien, Austria On 20/2/25, at 22:55, Carlo Bevilacqua wrote: Hi Pierre, thank you for your feedback. I appreciate that you took the time to go through my definition and highlighting the critical points. I much prefer this rather than starting working with a file format where problem might arise in the future. If we understand what are the reasons behind our choices in the definition we can merge the best of the two approaches, rather than defining two "standards" for the same thing with each of them having their limitations. I will provide an answer to each of the points you raised (I gave numbers to the points in your email below, so it is easier to reference): * I am not sure to which attribute you are referring specifically, but I am completely fine with text; I defined enums where I felt it makes sense to do so because there is a discrete number of options (one could always add elements at the end of an enum) * I defined the attributes before we started working together and I am very much open to changing them so they reflect what you have in the spreadsheet; in the document defining the file format we can just state that the attributes and their type are defined in the excel sheet * I did it this way because in my idea an individual HDF5 file corresponds to a single experiment. If you feel there is an advantage in keeping different experiments in the same file I am open to introduce your structure of subgroups; I honestly feel like this will only make the file unnecessarly large and different experiments would mostly not share much (apart from the metadata, which is anyway a small overhead in terms of filesize). Now of course the question is what you define as an 'experiment': for me different timepoints or measurements at different temperatures/angles/etc on the same sample are a single experiment and I defined the file so that it is possible to save them in a single file; measurements on different samples are not the same experiment in my original idea * same as the point 3 * same as before, I would put different samples in different files but happy to introduce your structure if you feel there is an advantage * the index is used to uniquely identify an entry in the 'Analysed_data' table; it is important in the contest of reconstructing the image (see the definition of the 'tn/image' group) * in my opinion spatial coordinates have a privileged role since we are doing imaging and having them well defined it is important to reconstruct the image; for different abscissas I defined the 'parameters' dataset (more in point 14). If one is not doing imaging this dataset can be set to an empty array or a single element (we can include this in the definition) * in my idea the "Analyzed_data" group doesn't contain multiple treatments but the result of the fit on the 'final' spectra, which are unique; if you are referring to the 'n' in the 'Shift_n_GHz' that is included in case a multipeak fit is performed. Now, if we want to include the possibility of multiple treatments like you are doing (which I didn't originally consider) we could just add an additional layer to the hierarchy * that is the amplitude of the peak from the fit. I am not sure if you didn't understand what I meant or you think it is not an useful information * The fit error actually contains 2 quantities: R2 and RMSE (as defined in the type). I am not sure how you would calculate a std from a single spectrum * the calibration curves are stored in the 'calibration_spectra' group with the name of the dataset matching the respective 'Calibration_index'. In our VIPA setup we are acquiring multiple calibration curves during a single acquisition to compensate for laser drift, that's why I introduced the possibility of having multiple calibration curves. Note that the 'Calibration_index' is defined as optional exactly because it might not be needed * each spectrum can have its own timestamp if it is acquired from a different camera image or scan of a FP, etc that's why it needs to be a dataset. Note that it is an optional dataset * good point, we can rename it to PSD * that is exactly to account for the general case of the abscissa not being a spatial coordinate and it contains the values for the parameters (e.g. the angles in an angle resolved measurement). It is a dataset whose dimensions are defined in the description (happy to elaborate more if it is not clear) * float is the type of each element; it is a dataset whose dimensions are defined in the description; the way to define the frequency axis in general for setups which don't have an absolute frequency (like VIPAs) is tricky and would be good to brainstorm about possibile solutions * as for the name we can change it, but the problem on how to deal with the situation when one doesn't have the frequency in GHz remains. My idea here was to leave the possibility of different units because the fit and most of the data analysis can be performed even if the x-axis is not in GHz and the actual conversion of the shift to GHz can be done at the end and requires the calibration data. As in my previous point, I am happy to brainstorm different solutions to this problem * it is indeed redundant with 'Analyzed_data' and I pushed a change on GitHub to correct this * see point 11; also note that the group is optional (in case people don't need it) and I introduced the attribute "same_as" to avoid repeating it multiple times if it is always the same for all the 'tn' As you see we agree with some of the points or we could find a common solution, for others it was mainly a misunderstanding on what were my intentions (probably my bad in expressing them, but you could have asked if it was not clear). Hope this helps claryfing my reasoning in the file definition and I am happy to discuss all the open points. I will look in details at your newest definition that you shared in the next days. Best, Carlo On Thu, Feb 20, 2025 at 18:25, Pierre Bouvet via Software wrote: Hi, My goal with this project is to unify the treatment of BLS spectra, to then allow us to address fundamental biophysical questions with BLS as a community in the mid-long term. Therefore my principal concern for this format is simplicity: measure are datasets called “Raw_data”, if they need one or more abscissa to be understood, this/these abscissa are called “Abscissa_i” and they are placed in groups called “Data_i” where we can store their attributes in the group’s attributes. From there, I can put groups in groups to store an experiment with different ... (e.g. : samples, time points, positions, techniques, wavelengths, patients, …). This structure is trivial but lacks usability so I added an attribute called “Name” to all groups that the user can define as he wants without impacting the structure. Now here are a few critics on Carlo’s approach. I didn’t want to share them because I hate criticizing anyone’s work, and I do think that what Carlo presented is great, but I don’t want you to think that I just trashed what he did, to the contrary, it’s because I see limitations in his approach that I tried developing another, simpler one. So here are the points I have problems with in Carlo’s approach: * The preferred type of the information on an experiment should be text as we’ll likely see new devices (like your super nice FT approach) appear in the next months/years that will require new parameters to be defined to describe them. I think we should really try not to use anything else than strings in the attributes. * The experiment information should not be defined by the HDF5 file structure but rather by a spreadsheet because everyone knows how to use Excel, and it’s way easier to edit an Excel file than an HDF5 file. * Experiment information should apply to measures and not to files, because they might vary from experiment to experiment, I think their preferred allocation is thus the attributes of the groups storing individual measures (in my approach) * The characterization of the instrument might also be experiment-dependent (if for some reason you change the tilt of a VIPA during the experiment for example), therefore having a dedicated group for it might not work for some experiments * The groups are named “tn” and the structure does not present the nomenclature of sub-groups, this is a big problem if we want to store in the same format say different samples measured at different times (the logic patch would be to have sub-groups follow the same structure so tn/tm/tl/… but it should be mentioned in the definition of the structure) * The dataset “index” in Analyzed_data is difficult to understand, what is it used for? I think it’s not useful, I would delete it. * The "spatial position" in Analyzed_data supposes that we are doing mappings. This is too restrictive for no reason, it’s better to generalize the abscissa and allow the user to specify a non-limiting parameter (the “Name” attribute for example) with whatever value he wants (position, temperature, concentration of whatever, …). A concrete example of a limit here: angle measurements, I want my data to be dependent on the angle, not the position. * Having different datasets in the same “Analyzed_data” group corresponding to the result of different treatments raises the question of where the process followed to treat the data is stored. A better approach would be to create n groups “Analyzed_data_n” with only one dataset of treated values, allowing for the process to be stored in the attributes of the group Analyzed_data_n * I don’t understand why store an array of amplitude in “Analyzed_data”, is it for the SNR? Then maybe we could name this array “SNR”? * The array “Fit_error_n” is super important but ill defined. I’d rather choose a statistical quantity like the variance, standard deviation (what I think is best), least-square error… and have it apply to both the Shift and Linewidth array as so: “Shift_std” and “Linewidth_std" * I don’t understand “Calibration_index”: where are the calibration curves? Are they in “experiment_info”? If so, we expect people to already process their calibration curves to create an array before adding them to the hdf5 file? I’m not very familiar with all devices, so I might not see the limitations here but do we ever have more than one calibration curve per measure? Could we not add it to the group as a “Calibration” dataset? Or just have one group with the calibration curve? * Timestamp is typically an attribute, it shouldn’t be present inside the group as an element. * In tn/Spectra_n , “Amplitude” is the PSD so I would call it PSD because there are other “Amplitude” datasets so it’s confusing. If it’s not the PSD, I would call it “Raw_data”. * I don’t understand what “Parameters” is meant to do in tn/Spectra_n, plus it’s not a dataset so I would put it in attributes or most likely not use it as I don’t understand what it does. * Frequency is a dataset, not a float (I think). We also need to have a place where to store the process to obtain it. In VIPA spectrometers for instance this is likely a big (the main even I think) source of error. I would put this process in attributes (as a text). * I don’t think “Unit” is useful, if we have a frequency axis, then we should define it directly in GHz, and if it’s a pixel axis, then for one we should not call it “Frequency” and then it’s better not to put anything since by default we will consider the abscissa (in absence of Frequency) as a simple range of the size of the “Amplitude” dataset. * /tn/Images: it’s a good idea, but I believe this is redundant with “Analyzed_data” (?) If it’s not then I don’t understand how we get the datasets inside it. * “Calibration_spectra” is a separate group, wouldn’t it be better to have it in “Experiment_info” in the presented structure? Also might scare off people that might not want to store a calibration file every time they create a HDF5 file (I might or might not be one of them) Like I said before, I don’t want this to be taken as more than what lead me to defining a new approach to the format. I want to state once again that Carlo's structure is complete, only it’s useful for specific instruments and applications, and difficultly applicable to other techniques and scenarios (and more lazy people like myself). Following Carlo’s mail, I’ve also completed the PDF I made to describe the structure I use in the HDF5_BLS library, I’m joining it to this email and pushing its code to GitHub (https://github.com/bio-brillouin/HDF5_BLS/blob/GUI_development/guides/Projec...), feel free to edit it and criticize it at length (I feel like I deserve it after this email I really tried not to write). Best, Pierre Pierre Bouvet, PhD Post-doctoral Fellow Medical University Vienna Department of Anatomy and Cell Biology Wahringer Straße 13, 1090 Wien, Austria On 20/2/25, at 16:12, Robert Prevedel via Software wrote: Dear all, great to see all this discussion in this thread, and thanks to especially Pierre and Carlo for driving this forward. I’ve been following the various emails and arguments closely but simply didn’t have any time to chip in due to some important committments in the past days. I understand that there was a bit of a disagreement about what the focus of this effort should be, so maybe it just helps to highlight my lab's view on this (which I just discussed in depth with Carlo and Sebastian): Our original motivation was to come up with and define a common file-format, as we regard this to be key to unify the processing and visualization of Brillouin data by the community. In this respect, we would be happy to focus our efforts on defining this format and taking care of implementing the necessary processing/visualization software and interface that allows anyone to look at the data in the same way. We also regard this to be crucial if we want to standardize the reporting of Brillouin data from diverse setups/users/applications. Therefore, at this stage it would be extremely important to agree on the structure of the file format. Carlo has proposed a very well thought-through structure for this, and it would be great to get your concrete feedback on this, as I understand this hasn’t really happened yet. To aid in this, e.g. Pierre and/or Sal could try to convert or save your standard data into this structure, and report on any difficulties or ambiguities that he encounters. Based on this I agree it’s best to meet and discuss and iron this out as a next step, however it either has to be next week (ideally Fri?), or after March 12 as I am travelling back-to-back in the meantime. Of course feel free to also meet without me for more technical discussions if this speeds up things. Either way we could then also discuss the file format etc. for the ‘raw’ data that Pierre proposed (and which is indeed very valuable as well). Let me know your thoughts, and let’s keep up the great momentum and excitement on this work! Best, Robert -- Dr. Robert Prevedel Group Leader Cell Biology and Biophysics Unit European Molecular Biology Laboratory Meyerhofstr. 1 69117 Heidelberg, Germany Phone: +49 6221 387-8722 Email: robert.prevedel@embl.de (mailto:robert.prevedel@embl.de) http://www.prevedel.embl.de (http://www.prevedel.embl.de/) On 20.02.2025, at 10:29, Carlo Bevilacqua via Software wrote: Hi Kareem, thanks for the suggestion, I agree that it is a good (and easy) way to divide the tasks! Just to be clear, it is not that I don't see the need/advantage of providing some standard treatment going from raw data to standard spectra, it is just that was not my priority when proposing the idea of a unified file format. Regarding the file format, splitting the one containing the raw data and the treatments from the one containing the spectra and the image in a standard format might be a good solution and we can always merge them at a later stage. As for the file containing the "standard" spectra, it would be very helpful if you can give some feedback on the structure I originally proposed (https://github.com/prevedel-lab/Brillouin-standard-file/blob/main/docs/Bh5_f...). Keep in mind that the idea is to be able to associate spectrum/spectra to each pixel in the image, in a way that is independent of the scanning strategy and underlaying technique. I tried to find a solution that works for the techniques I am aware of, considering the peculiarities (e.g. for most VIPA setups there is no absolute frequency axis but only relative to water). If am happy to discuss why I made some specific choices and if you see a better way to achieve the same or see things differently. Both the 3rd and the 4th of March work for me. Best, Carlo On Thu, Feb 20, 2025 at 02:50, Kareem Elsayad via Software wrote: Dear All, (and I guess especially Carlo & Pierre 😊) I understand both your (main) points concerning what this all should be, and I think this is actually perfect for dividing tasks. The format of the hf or bh5 file being where things meet and what needs to be agreed on. The thing with raw data is ofcourse that it is variable between instruments and labs, and the conversion to “standard spectra” that can then be fitted etc. is going to be unique (maybe even between experiments in same project). That said, asking people to create some complex file from their data that works with a developed software is also unlikely to get a following. So (the way I see it) there are basically two parts. Getting from raw data to h5 (or bh5) format which contains the spectra in standard format. And then the whole analysis part and visualization (GUI, pretty features, etc.). While the latter may get the spotlight, it obviously relies heavily on the former being done right. Given that there are numerous “standard” BLS setup implementations the development of software for getting from raw data to h5 I think makes sense, since the h5 will no doubt be cryptic, and creating a working h5 is not something everyone will want to program by themselves (it is not an insignificant step given we are also trying to ultimately cater to biologists). As such a software that generates the h5 files, with drag and drop features and entering system parameters, for different setups makes sense and will save many labs a headache if they don’t have a good programmer on hand. So I would suggest that Pierre & Sal lead the work on developing this, while Carlo & Sebastian lead the work on developing the analysis/interface-presentation part. This way things are nicely divided and we just need to agree on the h5 file that is transferred between the two. From the side of Pierre & Sal there could maybe also be a second h5 generated that contains all the raw data and details on how it was converted to the transferred h5 file (for complete transparency this could then also be reported in papers if people wish). These could exist as two separate programs with respective GUIs but also eventually combined to a single one. How does this sound to everyone? To clear up details and try assign tasks going forward how about a Zoom first week of March (I would be free Monday 3rd and Tue 4th after 1pm)? All the best, Kareem From: Carlo Bevilacqua via Software Reply to: Carlo Bevilacqua Date: Wednesday, 19. February 2025 at 20:43 To: Pierre Bouvet Cc: Subject: [Software] Re: [EXTERN] Re: Software manuscript / BLS microscopy Hi Pierre, I realized that we might have slightly different aims. For me the most important part of this project is to have a unified file format that can be read and visualized by a standard software. The file format you are proposing is not sufficient for that in my opinion. For example one of my main motivation was to have an interface where the user can see the reconstructed image, click on a pixel, see the corresponding spectrum to check its quality and maybe try different fitting functions; that would already not be possible with your structure because the software would have no notion on where the spectral data is stored and how to associate it to a specific pixel. I don't see the structure of the file to be too complex as an issue, as long as it is functional: we can always provide an API and/or a GUI that allow people to take their spectra and save them in whatever format we decide without bothering about understanding the actual structure, the same way you can work with HDF5 file without having any understanding on how the data is actually stored on the disk. My idea of making a webapp as a GUI follows directly from there. Typical case: I sent some data to a collaborator and they can just run the app in their browser and check if the outliers they see in the image are real or a bad spectra. Similarly if we make a common database of Brillouin spectra, people can explore it easily using the webapp. From what I understood, you are instead more interested in going from raw data to an actual spectrum, which I don't see so much as a priority because each lab has their own code already and the actual procedure would be different for each lab (apart from standard instruments like the FP). I am not saying this should not be part of the software but not as a priority and rather has a layer where people can easily implement their own code (of course we could already implement code for standard instruments). I think it would be good to cleary define what is our common aim now, so we are sure we are working in the same direction. Let me know if you agree or I misunderstood what is your idea. Best, Carlo On Wed, Feb 19, 2025 at 16:11, Pierre Bouvet wrote: Hi, I think you're trying to go too far too fast. The approach I present here (https://github.com/bio-brillouin/HDF5_BLS/blob/GUI_development/guides/Projec...) is intentionally simple, so that people can very quickly get to storing their data in a HDF5 file format together with the parameters they used to acquire them with minimal effort. The closest to what you did is therefore as follows: - data are datasets with no other restriction and they are stored in groups - each group can have a set of attribute proper to the data they are storing - attributes have a nomenclature imposed by a spreadsheet and are in the form of text - the default name of a data is the name of a raw data: “Raw_data”, other arrays can have whatever name they want (Shift_5GHz, Frequency, ...) - arrays and attributes are hierarchical, so they apply to their groups and all groups under it. This is the bare minimum to meet our needs, so we need to stop here in the definition of the format since it’s already enough to have the GUI working correctly, and therefore the first version of the unified software advertised. Of course we will have to refine things later on, but we don’t want to scare people off by presenting them a file description that for one might not match their measurements and that is extremely hard to conceptually understand. To make my point clearer, take your definition of the format for example: there are 3 different amplitude arrays in your description, two different shift arrays and width arrays that are of different dimension, then we have a calibration group on one side but a spectrometer characterization array in another group that is called “experiment_info”, that’s just too complicated to use correctly. On the other hand, placing your raw data “as is” in a group dedicated to this data is conceptually easy and straightforward. Where you are right, is that should we have hundreds of people using it, we might in a near future want to store abscissa, impulse responses, … in a standardized manner. In that case, the question falls down to either adding sub-groups or storing the data together with the measure. Both are fine and don’t really pose a problem for now, essentially because we are not trying to visualize the results but just trying to unify the way to get them. Now regarding Dash, if I understand correctly, it’s just a way to change the frontend you propose? If that’s so, why not, but then I don’t really see the benefits: if you really want to use dash, you can always embed it inside a Qt app. Also Dash being browser based, you will only have one window for the whole interface, which will be a pain to deal with if you want to use the interface to do everything the GUI is expected to do (inspect an H5 file, convert PSD, treat data, edit parameters, inspect a failed treatment, simulate results using setups with slight changes of parameters…). We agree that at one point when people receive an h5 file, it will be useful to have a web interface that can do what yours or Sal’s GUI do (seeing the mapping results together with the spectrum, eventually the time-domain signal) but here again, it’s going too far too soon: let’s first have a simple and reliable GUI that can convert data from any spectrometer to PSDs and treat them with a unified code. This is the real challenge, visualization and nomenclature of results are both important but secondary. Also keep in mind that, the frontend can easily be generated by anyone really, with Copilot or ChatGPT or whatever AI, but you can’t ask them to develop the function that will correctly read your data and convert them to a PSD nor treat the PSD. This is done on the backend and is the priority since the unification essentially happens there. Best, Pierre Pierre Bouvet, PhD Post-doctoral Fellow Medical University Vienna Department of Anatomy and Cell Biology Wahringer Straße 13, 1090 Wien, Austria On 19/2/25, at 13:21, Carlo Bevilacqua wrote: Hi Pierre, thanks for your reply. Regarding the file structure, what I am still not very clear about is what you define as Raw_data and data, how the actual spectra are stored and how the association to spatial coordinates and parameters is made. That's why I would really appreciate if you could make a document similar to what I did (https://github.com/prevedel-lab/Brillouin-standard-file/blob/main/docs/Bh5_f...), where it is clear what each group should (or can) contain, what is the shape of each dataset, which attributes they have, etc... I am not saying that this should be the final structure of the file but I strongly believe that having it written in a structured way helps defining it and seeing potential issues. Regarding the webapp, it works by separating the frontend, which run in the browser and is responsible of running the GUI, and the backend which is doing the actual computation and that you can structure as you like with multithreading or any optimization you wish. The communication between frontend and backend is handled transparently by the framework, so you don't have to take care of it. When you run Dash locally a local server is created so the data stays on your computer and there is no issue with data transfer/privacy. If we want to move it to a server at a later stage, then you are right about the fact that data needs to be transferred to a server (although there might be solutions that allow you to still run the computation on the local browser, like WebAssembly (https://webassembly.org/), but I think it is too complex to look into this at this stage). Regarding safety and privacy, the data will be stored on the server only for the time that the user is using the app and then deleted (of course we will need to make a disclaimer on the website about this). Regarding space I don't think people at the beginning will load their 1Tb dataset on the webapp but rather look at some small dataset of few tens of Gb; in that case 1Tb of server space is more than enough (remember that the file will be stored only for the time the user is using the app). If people really start to use the webapp and space becomes a limitation, I would be super happy to look into WebAssembly so that the data can be handled locally from the browser without transferring it to the server. To summarize I would agree that, at this stage, there might be no advantage of a webapp over a local GUI (and might actually be a bit more work to develop it). But, if this project really flies, the potential of a webapp is huge, especially in the context of the BioBrillouin society where we want to have a database of spectral data and the webapp could be used to explore that without downloading anything on your computer. My main point is that moving now to a webapp would not be too much work, but if we want to do it at a later stage it will basically entail re-writing everything from scratch. Let me know what are your thoughts about it. Best, Carlo On Wed, Feb 19, 2025 at 08:51, Pierre Bouvet wrote: Hi Carlo, You’re right, the format is still a little fuzzy. The main idea is to have a data-based hierarchy for storage: each data is stored in an individual group. From there, abscissa dependent on the data are stored in the same group and the treated data are stored in sub-groups. The names of the groups and sub-groups are fixed (Data_i), as is the name of the raw data (Raw_data) and abscissa (Abscissa_i). Also, the measure and spectrometer-dependent arguments have a defined nomenclature. To differentiate groups between them, we preferably attribute them a name as an attribute that is not used as an identifier, the identifier being either the path to the data/group from file root (Data_0/Data_42/Data_2/Raw_data) or potentially a hash value (not implemented). This I think allows all possible configurations, and using an hierarchical approach we can also pass common attributes and arrays (parameters of the spectrometer or abscissa arrays for example) on parent to reduce memory complexity. Now regarding the use of server-based GUI, first off, I’ve never used them so I’m just making supposition here but if the platform is able to treat data online, it will have to store the spectra somewhere in memory and it will not be local. My primary concerns with this approach is safety, particularly in terms of intellectual property protection, ethical considerations, and potential security vulnerabilities. Additionally, managing storage space will be a headache. Now, this doesn’t mean that we can’t have a server-based data plotter, or a server-based interface that does treatments locally but I don’t really see the benefits of this over a local software that can have multiple windows, which could at one point be multithreaded, and that could wrap c code to speed regressions for example (some of this might apply to Dash, I’m not super familiar with it). Now regarding memory complexity, having all the data we treat go on a server is a bad idea as it will raise the question of cost which will very rapidly become a real problem. Just an example: for a 100x100 map, I need 10Gb of memory (1Mo/point) with my setup (1To of archive storage is approximately 1euro/month) so this would get out of hands super fast assuming people use it. Now maybe there are solutions I don’t see for these problems and someone can take care of them but for me it’s just not worth the effort when having a local GUI solves all of these issues at once. But if you find a solution, then I’ll be happy to migrate to Dash, it won’t be fast to translate every feature but I can totally join you on the platform. Best, Pierre Pierre Bouvet, PhD Post-doctoral Fellow Medical University Vienna Department of Anatomy and Cell Biology Wahringer Straße 13, 1090 Wien, Austria On 18/2/25, at 20:26, Carlo Bevilacqua wrote: Hi Pierre, regarding the structure of the file, I agree that we should keep it simple. I am not suggesting to make it more complex, rather to have a document where we define it in a clear and structured way rather than as a general description, to make sure that we are all on the same page. I am saying this because, to be honest, I am not sure I fully understand how you are structuring the HDF5 and I think it is important to agree on this now, rather than finding at a later stage that we had different ideas. Ideally if the GUI should be part of a single application, we should write it using a unified framework. The reasons why, after considering it for a bit, I lean towards Dash rather than Qt are: * it can run in a web browser so it will be easy to eventually move it to a website, thus people can use it without installing it (which will hopefully help in promoting its use) * it is based on plotly (https://plotly.com/python/) which is a graphical library with very good plotting capabilites and highly customizable, that would make the data visualization easier/more appealing Let me know what you think about it and if you see any advantage of Qt over a web app which I am not considering. Also, if we agree that Dash might be a better option, would you consider migrating to Dash? It might not be too much work if most of the code you wrote is for data processing rather that for the GUI itself and I could help you with that. Alternatively one workaround is to have a QtWebEngine (https://doc.qt.io/qtforpython-6/overviews/qtwebengine-overview.html) in your Qt app and have the Dash app run inside that, but that would make only the Dash part portable to a server later on. Best, Carlo On Tue, Feb 18, 2025 at 10:24, Pierre Bouvet wrote: Hi, Thanks, More than merge them later, just keep them separate in the process and rather than trying to build "one code to do it all", build one library and GUI that encapsulate codes to do everything. Having a structure is a must but it needs to be kept as simple as possible else we’ll rapidly find situations where we need to change the structure. The middle ground I think is to force the use of hierarchies and impose nomenclatures where problem are expected to appear: each dataset has its own group, each group can encapsulate other groups, each parameter of a group applies to all its sub-groups if the subgroup does not change its value, each array of a group applies to all of its sub-groups if the sub-group does not redefine an array with same name, the names of the groups are held as parameters and their ID are managed by the software. For the Plotly interface, I don’t know how to integrate it to Qt but if you find a way to do it, that’s perfect with me :) My vision of the GUI is something that unifies the format and can then execute scripts on the data stored in this format. I have pushed the application of the GUI to my data up to the point where I can do the whole information extraction process from it (add data, convert to PSD, fit curves). I think this could be super interesting if we implement it for all techniques. I think we could formalize the project in milestones, in particular define the minimal denominator that will allow us to have the paper. The milestone I reached for my spectro encompasses the following points: - Being able to add data to the file easily (by dragging & dropping to the GUI) - Being able to assign properties to these data easily (again by dragging & dropping) - Being able to structure the added data in groups/folders/containers/however we want to call it - Making it easy for new data types to be loaded - Allowing data from same type but different structure to be added (e.g. .dat files) - Execute scripts on the data easily and allowing parameters of these scripts to be defined from the GUI (e.g. select a peak on a curve to fit this peak) - Make it easy to add scripts for treating or extracting PSD from raw data. - Allow the export of a Python code to access the data from the file (we cans see them as “break points” in the treatment pipeline) - Edit of properties inside the GUI In any case I think we could build a spec sheet for the project with what we want to have in it based on what we want to advertise in the paper. We can always add things later on but if we agree on a strict minimum to have the project advertised, then that will set its first milestone on which we’ll be able to build later on. Best, Pierre Pierre Bouvet, PhD Post-doctoral Fellow Medical University Vienna Department of Anatomy and Cell Biology Wahringer Straße 13, 1090 Wien, Austria On 17/2/25, at 14:53, Carlo Bevilacqua via Software wrote: Hi Pierre, hi Sal, thanks for sharing your thoughts about it. @Pierre I am very sorry that Ren passed away :( As far as I understood you are suggesting to work on the individual aspects separately and then merge them together at a later stage? I am fine with that but I still think it is very important to now agree on what should be in the file format we are defining, because that is kind of the core of the project and will affect a lot of the design choices. I am happy to start working on the GUI for data visualization. In my idea, it will be something similar to this (https://www.nature.com/articles/s41592-023-02054-z/figures/10) but written in dash (https://dash.plotly.com/), so it is a web app that for now can run locally (so no transfer of data to an external server is required) but in the future can easily be uploaded to a website that people can just use without installing anything on their computer. The question is how much of the data processing should be possible to do (or trigger) from the same GUI? I think at least a drop down menu with different fitting functions should be there, so the user can quickly check the results on a spectrum from a specific point in the image. @Pierre how are you envisioning the GUI you are working on? As far as I understood it is mainly to get the raw data and save it to our HDF5 format with some treatment on it. One idea could be to have a shared list of features that we are implementing in the GUI as we work on it, to avoid having the same functionality duplicated (or worst inconsistent) between the GUI for generating our file format and the GUI for visualization. Let me know what you think about it. Best, Carlo On Mon, Feb 17, 2025 at 11:04, Pierre Bouvet via Software wrote: Hi everyone, Sorry for the delayed response, I just went through the loss of Ren (my dog) and wasn’t at all able to answer. First of, Sal, I am making progress and I should have everything you have made on your branch integrated to the GUI branch soon, at which point I will push everything to main. Regarding the project, I think I align with Sal: keep things as simple as possible. My approach was to divide everything in 3 mostly independent layers: - Store data in an organized file that anyone can use, and make it easy to do - Convert these data into something that has physical significance: a Power Spectrum Density - Extract information from this Power Spectrum Density Each layer has its own challenge but they are independent on the challenge of having people using it: personally, if I had someone come to me with a new software to play with my measures, I would most likely only look at it for 1 minute (or less depending who made it) with a lot of apprehension and then based on how simple it looks and how much I understood of it, use it or - what is most likely - discard it. This is why Project.pdf (https://github.com/bio-brillouin/HDF5_BLS/blob/GUI_development/guides/Projec...) is essentially meant to say: we put data arrays in groups and give them attributes written in text, but you can also create groups within groups to organize your data! I believe most of the people in the BioBrillouin society will have the same approach and before having something complex that can do a lot, I think it’s best to have something simple that can just unify the format (which in itself is a lot) and that people can use right away with a minimal impact on their own individual pipelines for data processing. To be honest, I don’t think people will blindly trust our software at first to treat their data, but they will most likely use it at first to organize their raw spectra, and maybe add their own treated data if they are feeling particularly adventurous. But that is not a problem as long as we start a movement. From there yes, we can complexity and create custom file architectures but that is already too complex I think for this first project. If we can all just import our data to the wrapper and specify their attributes, this will already be a success. Then for the paper, if we can all add a custom code to treat these data to obtain a PSD, I think this will be enough. As I said, the current API already allows you to add your data in a variety of format, so it’s just a question of developing the PSD conversion before having something we can publish (and then tell people to use). A few extra points: - Working with my setup, I realized if the user could choose between different algorithms to treat their own data, it would make the overall project much more usable (if an algorithm bugs for whatever reason, you can use another one) so I created 2 bottle necks in the form of functions (for PSD conversion and treatment) that would inspect modules dedicated to either PSD conversion or treatment, and list existing functions. It’s in between classical and modular programming but it makes the development of new PSD conversion code and treatment way way easier - The GUI is developed using oriented-object programming. Therefore I have already made some low-level choices that kind of impact all the GUI. I’m not saying they are the best choices, I’m just saying that they work, so if you want to work on the GUI, I would either recommend getting familiar with these choices, or making sure that all the functionalities are preserved, particularly the ones that are invisible (logging of treatment steps, treatment errors…) I’ll try merging the branches on Git asap and will definitely send you all an email when it’s done :) Best, Pierre Pierre Bouvet, PhD Post-doctoral Fellow Medical University Vienna Department of Anatomy and Cell Biology Wahringer Straße 13, 1090 Wien, Austria On 14/2/25, at 19:36, Sal La Cavera Iii via Software wrote: Hi all, I agree with the things enumerated and points made by Kareem/Carlo! I guess I would advocate for starting from a position of simplicity. We probably don't want to get weighed down by trying to include a bunch of bells and whistles from the start as these can be easily added once there is a minimally viable stable product. As long as data can be loaded to local memory, then treated in various (initially simple) ways through the GUI (and maybe maintain non-GUI compatibility for command-line warriors like myself), then the bh5 formatting stuff can be sorted on the back end? I definitely agree with Carlo's structure set out in the file format document; but all of that data will be floating around the memory in some shape or form and just needs to be wrapped up and packaged (according to Carlo's structure e.g.) when the user is happy and presses the "generate h5 filestore" etc. (?) Definitely agree with the recommendation to create the alpha using mainly requirements that our 3 labs would find useful (import filetypes, treatments, etc), and then we can add on more universal functionality second / get some beta testers in from other labs etc. I'm able to support on whatever jobs need doing and am free to meet in the beginning of March like you mentioned Kareem. Hope you guys have a nice weekend, Cheers, Sal --------------------------------------------------------------- Salvatore La Cavera III Royal Academy of Engineering Research Fellow Nottingham Research Fellow Optics and Photonics Group University of Nottingham Email: salvatore.lacaveraiii@nottingham.ac.uk (mailto:salvatore.lacaveraiii@nottingham.ac.uk) ORCID iD: 0000-0003-0210-3102 (https://outlook.office.com/bookwithme/user/6a3f960a8e89429cb6fc693c01d10119@...) Book a Coffee and Research chat with me! ------------------------------------ From: Carlo Bevilacqua via Software Sent: 12 February 2025 13:31 To: Kareem Elsayad Cc: sebastian.hambura@embl.de (mailto:sebastian.hambura@embl.de) ; software@biobrillouin.org (mailto:software@biobrillouin.org) Subject: [Software] Re: Software manuscript / BLS microscopy You don't often get email from software@biobrillouin.org (mailto:software@biobrillouin.org). Learn why this is important (https://aka.ms/LearnAboutSenderIdentification) Hi Kareem, thanks for restarting this and sorry for my silence, I just came back from US and was planning to start working on this again. Could you also add Sebastian (in CC) to the mailing list? As you outlined, I would split the project into two parts: 1) getting from the raw data to some standard "processed' spectra and 2) do data analysis/visualization on that. For the second part the way I envision it is: * the most updated definition of the file format from Pierre is this one (https://github.com/bio-brillouin/HDF5_BLS/blob/GUI_development/guides/Projec...), correct? In addition to this document I think it would be good to have a more structured description of the file (like this (https://github.com/prevedel-lab/Brillouin-standard-file/blob/main/docs/Bh5_f...)), where each field is clearly defined in terms of data type and dimensions. Sebastian was also suggesting that the document should contain the reasoning behind each specific choice in the specs and also things that we considered but decided had some issues (so in future we can look back at it). I still believe that the file format should contain the "processed" spectra (i.e. after FT and baseline subtraction for impulsive, or after taking a line profile and possibly linearization with VIPA,...) so we can apply standard data processing or visualization which is independent on the actual underlaying technique (e.g. VIPA, FP, stimulated, time domain, ...) * agree on an API to read the data from our file format (most likely a Python class). For that we should: 1) decide on which information is important to extract (spectral information, spatial coordinates, hyper-parameters, metadata,...) 2) implement an interface to read the data (e.g. readSpectrumAtIndex(...), readImage(...), ...) * build a GUI that use the previously defined API to show and process the data. I would say that, once we have a very solid description of the file format as in step 1, step 2 will come naturally and we can divide the actual implementation between us. Step 3 can also easily be implemented and divided between us once we have an API (and I am happy to work on the GUI myself). The first half of the project is the trickiest and I know Pierre has already done a lot of work in that direction. We should definitely agree on which extent we can define a standard to store the raw data, given the variability between labs, (and probably we should do it for common techniques like FP or VIPA) and how to implement the treatments, leaving to possibility to load some custom code in the pipeline to do the conversion. Let me know what you all think about this. If you agree I would start by making a document which clearly defines the file format in a structured way (as in my step 1 before). @Pierre could you write a new document or modify the document I originally made (https://github.com/prevedel-lab/Brillouin-standard-file/blob/main/docs/Bh5_f...) to reflect the latest structure you implemented for the file format? The metadata can still be defined in a separated excel sheet, as long as the data type and format is well defined there. Best regards, Carlo On Wed, Feb 12, 2025 at 02:19, Kareem Elsayad via Software wrote: Hi Robert, Carlo, Sal, Pierre, Think it would be good to follow up on software project. Pierre has made some progress here and would be good to try and define tasks a little bit clearer to make progress… There is always the potential issue of having “too many cooks in the kitchen” (that have different recipes for same thing) to move forward efficiently, something that I noticed can get quite confusing/frustrating when writing software together with people. So would be good to clearly assign tasks. I talked to Pierre today and he would be happy to integrate things in framework we have to try tie things together. What would foremost be needed would be ways of treating data, meaning code that takes a raw spectral image and meta-data and converts it into “standard” format (spectral representation) that can then be fitted. Then also “plugins” that serve a specific purpose in the analysis/rendering that can be included in framework. The way I see it (and please comment if you see differently), there are ~4 steps here: * Take raw data (in .tif,, .dat, txt, etc. format) and meta data (in .cvs, xlsx, .dat, .txt, etc.) and render a standard spectral presentation. Also take provided instrument response in one of these formats and extract key parameters from this * Fit the data with drop-down menu list of functions, that will include different functional dependences and functions corrected for instrument response. * Generate/display a visual representation of results (frequency shift(s) and linewidth(s)), that is ideally interactive to some extent (and maybe has some funky features like looking at spectra at different points. These can be spatial maps and/or evolution with some other parameter (time, temperature, angle, etc.). Also be able to display maps of relative peak intensities in case of multiple peak fits, and whatever else useful you can think of. * Extract “mechanical” parameters given assigned refractive indices and densities I think the idea of fitting modified functions (e.g. corrected based on instrument response) vs. deconvolving spectra makes more sense (as can account for more complex corrections due to non-optical anomalies in future –ultimately even functional variations in vicinity of e.g. phase transitions). It is also less error prone, as systematically doing decon with non-ideal registration data can really throw you off the cliff, so to speak. My understanding is that we kind of agreed on initial meta-data reporting format. Getting from 1 to 2 will no doubt be most challenging as it is very instrument specific. So instructions will need to be written for different BLS implementations. This is a huge project if we want it to be all inclusive.. so I would suggest to focus on making it work for just a couple of modalities first would be good (e.g. crossed VIPA, time-resolved, anisotropy, and maybe some time or temperature course of one of these). Extensions should then be more easy to navigate. At one point think would be good to involve SBS specific considerations also. Think would be good to discuss a while per email to gather thoughts and opinions (and already start to share codes), and then plan a meeting beginning of March -- how does first week of March look for everyone? I created this mailing list (software@biobrillouin.org (mailto:software@biobrillouin.org)) we can use for discussion. You should all be able to post to (and it makes it easier if we bring anyone else in along the way). At moment on this mailing list is Robert, Carlo, Sal, Pierre and myself. Let me know if I should add anyone. All the best, Kareem This message and any attachment are intended solely for the addressee and may contain confidential information. If you have received this message in error, please contact the sender and delete the email and attachment. Any views or opinions expressed by the author of this email do not necessarily reflect the views of the University of Nottingham. Email communications with the University of Nottingham may be monitored where permitted by law. _______________________________________________ Software mailing list -- software@biobrillouin.org (mailto:software@biobrillouin.org) To unsubscribe send an email to software-leave@biobrillouin.org (mailto:software-leave@biobrillouin.org) _______________________________________________ Software mailing list -- software@biobrillouin.org (mailto:software@biobrillouin.org) To unsubscribe send an email to software-leave@biobrillouin.org (mailto:software-leave@biobrillouin.org) _______________________________________________ Software mailing list -- software@biobrillouin.org (mailto:software@biobrillouin.org) To unsubscribe send an email to software-leave@biobrillouin.org (mailto:software-leave@biobrillouin.org) _______________________________________________ Software mailing list -- software@biobrillouin.org (mailto:software@biobrillouin.org) To unsubscribe send an email to software-leave@biobrillouin.org (mailto:software-leave@biobrillouin.org) _______________________________________________ Software mailing list -- software@biobrillouin.org (mailto:software@biobrillouin.org) To unsubscribe send an email to software-leave@biobrillouin.org (mailto:software-leave@biobrillouin.org) _______________________________________________ Software mailing list -- software@biobrillouin.org (mailto:software@biobrillouin.org) To unsubscribe send an email to software-leave@biobrillouin.org (mailto:software-leave@biobrillouin.org)
Hi Carlo, Sounds great! Yes, Fri 28th @3pm still works for me. If it works for others, here is Zoom we can use: https://us02web.zoom.us/j/5191046969?pwd=alpzaldoZEd3N2ZEQ0hYZU1RR1dOdz09 Meeting ID: 519 104 6969 Passcode: jY3zH8 All the best, kareem From: Carlo Bevilacqua via Software <software@biobrillouin.org> Reply to: Carlo Bevilacqua <carlo.bevilacqua@embl.de> Date: Wednesday, 26. February 2025 at 20:43 To: Kareem Elsayad <kareem.elsayad@meduniwien.ac.at> Cc: "software@biobrillouin.org" <software@biobrillouin.org> Subject: [Software] Re: [EXTERN] Re: Software manuscript / BLS microscopy Hi Kareem, thank you for your email. We are discussing with Pierre about the details of the file format and hopefully by our next meeting we will have agreed on a file format and we can divide the tasks. If it is still an option, Friday 28th at 3pm works for me. Best regards, Carlo On Mon, Feb 24, 2025 at 03:17, Kareem Elsayad <kareem.elsayad@meduniwien.ac.at> wrote: Dear All, I (and Robert) were hoping there would be some consensus on this h5 file format. Let us do a Zoom on Fri 28th Feb at 15:00? A couple of points pertaining to arguments… Firstly, the precise structure is not worth getting into big arguments or fuss about…as long as it contains all the information needed for the analysis/representation, and all parties can work with (able to write and read knowing what is what), it ultimately doesn’t matter. In my opinion better put more (optional) stuff in if that is issue, and make it as inclusive as possible. In the end this does not need to be read by analysis/representation side, and when we go through we can decide if and what needs to be stripped. It is after all the “black box” between doing the experiment and having your final plots/images. Take a look at say a Zeiss file and try figure all that’s in it (it is not ideally structured maybe, but no biologist ever cared) – that said, I am sure their team had very similar arguments concerning structure etc.! (you have as many opinions as people). Maybe the issue is that the boundary conditions were not as well defined, but I would say at this point make them more inclusive than they need to be (empty spaces cost little memory) Secondly, and following on from firstly. We need to simply agree and compromise to make any progress asap. Rather than building separate structures we need to add/modify a single existing structure or we might as well be working on independent projects. Carlo’s initially proposed structure seemed reasonable, maybe with some minor changes, and we should just go with that as a basis in my opinion. I would suggest that Pierre and Carlo have a Zoom together and try and come up with something that is acceptable to both. Like everything in life, this will involve making compromises. And then present it on 28th Feb. Quite simply, if there is no agreement we cannot do this project and in the end it doesn’t matter who is right or wrong. Finally, I hope the disagreements from both sides are not seen as negative or personal attacks –it is ok to disagree (that’s why we have so many meetings!) On the plus side we are still more effective than the Austrian government (that is still deciding who should be next prime minister like half a year after elections) 😊 All the best, Kareem From: Pierre Bouvet via Software <software@biobrillouin.org> Reply to: Pierre Bouvet <pierre.bouvet@meduniwien.ac.at> Date: Friday, 21. February 2025 at 11:55 To: Carlo Bevilacqua <carlo.bevilacqua@embl.de> Cc: <software@biobrillouin.org> Subject: [Software] Re: [EXTERN] Re: Software manuscript / BLS microscopy Hi Carlo, Thanks for your reply, here is the next pong of this ping pong series ^^ 1- I was talking indeed about the enums, but also the parameters that are defined as integers or floating point numbers and uint32. I think its easier (and that we already agreed on) having a spreadsheet with the parameters (easy to use, easy to update, easy to store and modify between two experiments using the same setup, allows to impose fixed choices for some parameters with drop-down lists, allows to detail the requirements for the attribute like its format or units and allows examples) and to just import it in the HDF5 file. From there it’s easier to have every attribute as strings both for the import and for the concept of what an attribute is. 2- OK 3- The problem is not necessarily the number of experiments you put in the file but the number of hyper parameters you want to take into account. Let’s take an example with a doubtable sense: I want to study the effect of low-frequency temperature fluctuations on micro mechanics in active samples both eukaryote and prokaryote showing a layered structure (endothelial cells arranged in epidermis, biofilms, …) with different cell types, and as a function of aging. I would then create a file with a first range of groups for the age of the sample, then inside these groups 2 groups for eukaryote and prokaryote samples, then inside these groups N groups for the samples I’m looking at, then inside these groups M groups for the temperature fluctuations I impose, then inside these groups the individual measures I make (this is fictional, I’m scared just to think at the amount of work to have all the samples, let alone measure them), this is simply not possible with your approach I think, and even simpler experiments like to measure the Allan variance on an instrument using 2 samples is not possible with your structure I think. 4- / 5- I think the real question is what we expect to get from a wrapper: for me is to wrap the measures of a given study, to then share, link to papers, treat using new approaches… Having a structure that can wrap both a full study and an experiment is in my opinion better in the long run than forcing the format to be used with only one experiment. 6- Yes, I understand it is an identifier, but why an integer? Why not a tuple? Why not a hash? And what if there’s a bug and instead of 3 you store you store 3.0, or 2, or ‘e'? Do you imagine the amount of work to understand where this bug comes from? Assuming it’s a bug because it might very well be just an inexperienced user making a mistake and then your file is broken. The idea is good but the safer way to have this is to work with nD arrays where the dimensionality is conserved I think, or just have all the information in the same group. 7- Here again, it’s more useful for your application but many people don’t use maps, so why force them to have even an empty array for that? Plus if they need to have a dedicated array for the concentration of crosslinkers (for example), they are faced with a non-trivial solution, which means they won’t use the format. 8- Yes, we could add an additional layer, but then it means that if you don’t need it, your datasets are in plain in the group and if you need it, then you don’t have the same structure. The solution I think is to already have the treated data in a group, if you don’t need more than one group (which will be most of the time the case) then you’ll only have one group of treated data. 9- I think it’s not useful. The SNR on the other hand is useful, because in shot-noise regime it’s a marker of variance, and this is one of the ways to spot outliers from treatment (if the SNR doesn’t match the returned standard deviation on the shift of one peak, there’s a problem somewhere). 10- The std of a fit is obtained by taking the square root of the diagonalized covariant matrix returned by the fit as long as your parameters are independent (it’s super interesting actually and a little bit more complicated but it’s true enough for lorentzian, DHO, Gaussian...) 11- OK but then why not have the calibration curves placed with your measures if they are only applicable to this measure? Once again, I think having indexes that are modifiable by the user is not safe (the technical term is “idiot proof”) 12- I don’t agree, if you are capturing points at a fixed interval, then you can reconstruct the timestamp from the timestamp of the first acquisition and either the delay between two acquisitions or the timestamp of the last acquisition. Most of the time however we don’t even need this as we consider the sample to be time-invariant on the scale of our measure, so a single timestamp for all the measure is enough and is better stored as an attribute. In the special case where we are not time-invariant, then time becomes the abscissa of the measures and in that case yes, it can be a dataset, but then it’s better to not impose a fixed name for this dataset and rather let the user decide what hyper parameter is changed during he’s measure, this way the user is free to use whatever hyper parameters he feels like it. 13- OK 14- Still not clear to me. My approach is to consider an experiment to be a measure of a sample as function of one or more controlled or measured hyper parameter. So my general approach for storing experiments is have 3 files: abscissa (with the hyper parameters that vary), measure and metadata, which translates to “Raw_data”, “Abscissa_i” and attributes for this format. 15- OK, I think more than brainstorming about how to treat correctly a VIPA spectrum, we need to allow people to tell how they do it if we want this project to be used in short term, unification is a goal of this project and we will advertise it in the paper, but to be honest, I doubt people like Giuliano will run with it without second guessing it, particularly with its clinical setups, so there will be some going back and forth before we have something stable, and this means we need to allow for this back and forth to appear somewhere, I propose having it as a parameter. 16- Here I think you allow too much liberty, changing the frequency of an array to GHz is trivial and I think most people do use GHz as the unit of their frequency arrays anyway. We need to make it clear that the frequency axis is in GHz but I think we don’t need a full element for this. If you really want to specify the unit of the Frequency dataset, I would suggest putting it in its attributes in any case, and not as another element in the structure. 17- OK 18- I think it’s one way to do it but it is not intuitive: I won’t have the reflex to go check in the attributes if there is a parameter “sam_as” to see if the calibration applies to all the curves. The way I would expect it to be is using the hierarchical logic of the format: if I’m looking at a dataset in a sub-group of a group containing a calibration dataset, then I know this calibration applies to my data: Data |- Data_0 (group) | |- Calibration (dataset) | |- Data_0 (group) | | |- Raw_data (dataset) | |- Data_1 (group) | | |- Raw_data (dataset) |- Data_1 (group) | |- Calibration (dataset) | |- Data_0 (group) | | |- Raw_data (dataset) I think in this example most people would suppose Data/Data_0/Calibration applies both to Data/Data_0/Data_0/Raw_data and Data/Data_0/Data_1/Raw_data but not Data/Data_1/Data_0/Raw_data whose calibration is intuitively Data/Data_1/Calibration Once again, my approach of the structure is trying to make it intuitive and most of all, simple. For instance if I place myself in the position of someone that is willing to try “just to see how it works”, I would give myself 10s to understand how I could have a file for only one measure that complies with the new (hope to be) standard. It is my opinion as I already told you before, that your approach is too complete and therefore complex, which will inevitably lead to people not using the format unless there’s a GUI to do it for them (and even then they might not use it). I don’t want to impose my vision here, and like you I have put a lot of thinking (and testing) into building the format I propose, but I’m convinced that if we go with your structure, not only will it make it hard for anyone to understand how to use it but we’ll have problems using it ourselves. I want to repeat that I don’t have the solution, I’m just confident that my approach is much easier to conceptually understand and less restrictive than yours. In any case we can agree to disagree on that, but then it’ll be good to have an alternative backend like the one I did with your format to try and use it, and see if indeed it’s better, because if it’s not and people don’t use it, I don’t want to go back to all the trouble I had building the library, docs and GUI just to try. I don’t want to impose you anything but it would be awesome if you took the time to read the document I made and completed for you yesterday. Then you can just tell me where you think I’m missing something and you had a better solution because as you might see, I’m having problems with nearly all your structure and we can’t really use it as a starting point at this stage since most of the backend is written and the front-end is already functional for my setup (and soon Sal’s and the TFP). Best, Pierre Pierre Bouvet, PhD Post-doctoral Fellow Medical University Vienna Department of Anatomy and Cell Biology Wahringer Straße 13, 1090 Wien, Austria On 20/2/25, at 22:55, Carlo Bevilacqua <carlo.bevilacqua@embl.de> wrote: Hi Pierre, thank you for your feedback. I appreciate that you took the time to go through my definition and highlighting the critical points. I much prefer this rather than starting working with a file format where problem might arise in the future. If we understand what are the reasons behind our choices in the definition we can merge the best of the two approaches, rather than defining two "standards" for the same thing with each of them having their limitations. I will provide an answer to each of the points you raised (I gave numbers to the points in your email below, so it is easier to reference): I am not sure to which attribute you are referring specifically, but I am completely fine with text; I defined enums where I felt it makes sense to do so because there is a discrete number of options (one could always add elements at the end of an enum) I defined the attributes before we started working together and I am very much open to changing them so they reflect what you have in the spreadsheet; in the document defining the file format we can just state that the attributes and their type are defined in the excel sheet I did it this way because in my idea an individual HDF5 file corresponds to a single experiment. If you feel there is an advantage in keeping different experiments in the same file I am open to introduce your structure of subgroups; I honestly feel like this will only make the file unnecessarly large and different experiments would mostly not share much (apart from the metadata, which is anyway a small overhead in terms of filesize). Now of course the question is what you define as an 'experiment': for me different timepoints or measurements at different temperatures/angles/etc on the same sample are a single experiment and I defined the file so that it is possible to save them in a single file; measurements on different samples are not the same experiment in my original idea same as the point 3 same as before, I would put different samples in different files but happy to introduce your structure if you feel there is an advantage the index is used to uniquely identify an entry in the 'Analysed_data' table; it is important in the contest of reconstructing the image (see the definition of the 'tn/image' group) in my opinion spatial coordinates have a privileged role since we are doing imaging and having them well defined it is important to reconstruct the image; for different abscissas I defined the 'parameters' dataset (more in point 14). If one is not doing imaging this dataset can be set to an empty array or a single element (we can include this in the definition) in my idea the "Analyzed_data" group doesn't contain multiple treatments but the result of the fit on the 'final' spectra, which are unique; if you are referring to the 'n' in the 'Shift_n_GHz' that is included in case a multipeak fit is performed. Now, if we want to include the possibility of multiple treatments like you are doing (which I didn't originally consider) we could just add an additional layer to the hierarchy that is the amplitude of the peak from the fit. I am not sure if you didn't understand what I meant or you think it is not an useful information The fit error actually contains 2 quantities: R2 and RMSE (as defined in the type). I am not sure how you would calculate a std from a single spectrum the calibration curves are stored in the 'calibration_spectra' group with the name of the dataset matching the respective 'Calibration_index'. In our VIPA setup we are acquiring multiple calibration curves during a single acquisition to compensate for laser drift, that's why I introduced the possibility of having multiple calibration curves. Note that the 'Calibration_index' is defined as optional exactly because it might not be needed each spectrum can have its own timestamp if it is acquired from a different camera image or scan of a FP, etc that's why it needs to be a dataset. Note that it is an optional dataset good point, we can rename it to PSD that is exactly to account for the general case of the abscissa not being a spatial coordinate and it contains the values for the parameters (e.g. the angles in an angle resolved measurement). It is a dataset whose dimensions are defined in the description (happy to elaborate more if it is not clear) float is the type of each element; it is a dataset whose dimensions are defined in the description; the way to define the frequency axis in general for setups which don't have an absolute frequency (like VIPAs) is tricky and would be good to brainstorm about possibile solutions as for the name we can change it, but the problem on how to deal with the situation when one doesn't have the frequency in GHz remains. My idea here was to leave the possibility of different units because the fit and most of the data analysis can be performed even if the x-axis is not in GHz and the actual conversion of the shift to GHz can be done at the end and requires the calibration data. As in my previous point, I am happy to brainstorm different solutions to this problem it is indeed redundant with 'Analyzed_data' and I pushed a change on GitHub to correct this see point 11; also note that the group is optional (in case people don't need it) and I introduced the attribute "same_as" to avoid repeating it multiple times if it is always the same for all the 'tn' As you see we agree with some of the points or we could find a common solution, for others it was mainly a misunderstanding on what were my intentions (probably my bad in expressing them, but you could have asked if it was not clear). Hope this helps claryfing my reasoning in the file definition and I am happy to discuss all the open points. I will look in details at your newest definition that you shared in the next days. Best, Carlo On Thu, Feb 20, 2025 at 18:25, Pierre Bouvet via Software <software@biobrillouin.org> wrote: Hi, My goal with this project is to unify the treatment of BLS spectra, to then allow us to address fundamental biophysical questions with BLS as a community in the mid-long term. Therefore my principal concern for this format is simplicity: measure are datasets called “Raw_data”, if they need one or more abscissa to be understood, this/these abscissa are called “Abscissa_i” and they are placed in groups called “Data_i” where we can store their attributes in the group’s attributes. From there, I can put groups in groups to store an experiment with different ... (e.g. : samples, time points, positions, techniques, wavelengths, patients, …). This structure is trivial but lacks usability so I added an attribute called “Name” to all groups that the user can define as he wants without impacting the structure. Now here are a few critics on Carlo’s approach. I didn’t want to share them because I hate criticizing anyone’s work, and I do think that what Carlo presented is great, but I don’t want you to think that I just trashed what he did, to the contrary, it’s because I see limitations in his approach that I tried developing another, simpler one. So here are the points I have problems with in Carlo’s approach: The preferred type of the information on an experiment should be text as we’ll likely see new devices (like your super nice FT approach) appear in the next months/years that will require new parameters to be defined to describe them. I think we should really try not to use anything else than strings in the attributes. The experiment information should not be defined by the HDF5 file structure but rather by a spreadsheet because everyone knows how to use Excel, and it’s way easier to edit an Excel file than an HDF5 file. Experiment information should apply to measures and not to files, because they might vary from experiment to experiment, I think their preferred allocation is thus the attributes of the groups storing individual measures (in my approach) The characterization of the instrument might also be experiment-dependent (if for some reason you change the tilt of a VIPA during the experiment for example), therefore having a dedicated group for it might not work for some experiments The groups are named “tn” and the structure does not present the nomenclature of sub-groups, this is a big problem if we want to store in the same format say different samples measured at different times (the logic patch would be to have sub-groups follow the same structure so tn/tm/tl/… but it should be mentioned in the definition of the structure) The dataset “index” in Analyzed_data is difficult to understand, what is it used for? I think it’s not useful, I would delete it. The "spatial position" in Analyzed_data supposes that we are doing mappings. This is too restrictive for no reason, it’s better to generalize the abscissa and allow the user to specify a non-limiting parameter (the “Name” attribute for example) with whatever value he wants (position, temperature, concentration of whatever, …). A concrete example of a limit here: angle measurements, I want my data to be dependent on the angle, not the position. Having different datasets in the same “Analyzed_data” group corresponding to the result of different treatments raises the question of where the process followed to treat the data is stored. A better approach would be to create n groups “Analyzed_data_n” with only one dataset of treated values, allowing for the process to be stored in the attributes of the group Analyzed_data_n I don’t understand why store an array of amplitude in “Analyzed_data”, is it for the SNR? Then maybe we could name this array “SNR”? The array “Fit_error_n” is super important but ill defined. I’d rather choose a statistical quantity like the variance, standard deviation (what I think is best), least-square error… and have it apply to both the Shift and Linewidth array as so: “Shift_std” and “Linewidth_std" I don’t understand “Calibration_index”: where are the calibration curves? Are they in “experiment_info”? If so, we expect people to already process their calibration curves to create an array before adding them to the hdf5 file? I’m not very familiar with all devices, so I might not see the limitations here but do we ever have more than one calibration curve per measure? Could we not add it to the group as a “Calibration” dataset? Or just have one group with the calibration curve? Timestamp is typically an attribute, it shouldn’t be present inside the group as an element. In tn/Spectra_n , “Amplitude” is the PSD so I would call it PSD because there are other “Amplitude” datasets so it’s confusing. If it’s not the PSD, I would call it “Raw_data”. I don’t understand what “Parameters” is meant to do in tn/Spectra_n, plus it’s not a dataset so I would put it in attributes or most likely not use it as I don’t understand what it does. Frequency is a dataset, not a float (I think). We also need to have a place where to store the process to obtain it. In VIPA spectrometers for instance this is likely a big (the main even I think) source of error. I would put this process in attributes (as a text). I don’t think “Unit” is useful, if we have a frequency axis, then we should define it directly in GHz, and if it’s a pixel axis, then for one we should not call it “Frequency” and then it’s better not to put anything since by default we will consider the abscissa (in absence of Frequency) as a simple range of the size of the “Amplitude” dataset. /tn/Images: it’s a good idea, but I believe this is redundant with “Analyzed_data” (?) If it’s not then I don’t understand how we get the datasets inside it. “Calibration_spectra” is a separate group, wouldn’t it be better to have it in “Experiment_info” in the presented structure? Also might scare off people that might not want to store a calibration file every time they create a HDF5 file (I might or might not be one of them) Like I said before, I don’t want this to be taken as more than what lead me to defining a new approach to the format. I want to state once again that Carlo's structure is complete, only it’s useful for specific instruments and applications, and difficultly applicable to other techniques and scenarios (and more lazy people like myself). Following Carlo’s mail, I’ve also completed the PDF I made to describe the structure I use in the HDF5_BLS library, I’m joining it to this email and pushing its code to GitHub, feel free to edit it and criticize it at length (I feel like I deserve it after this email I really tried not to write). Best, Pierre Pierre Bouvet, PhD Post-doctoral Fellow Medical University Vienna Department of Anatomy and Cell Biology Wahringer Straße 13, 1090 Wien, Austria On 20/2/25, at 16:12, Robert Prevedel via Software <software@biobrillouin.org> wrote: Dear all, great to see all this discussion in this thread, and thanks to especially Pierre and Carlo for driving this forward. I’ve been following the various emails and arguments closely but simply didn’t have any time to chip in due to some important committments in the past days. I understand that there was a bit of a disagreement about what the focus of this effort should be, so maybe it just helps to highlight my lab's view on this (which I just discussed in depth with Carlo and Sebastian): Our original motivation was to come up with and define a common file-format, as we regard this to be key to unify the processing and visualization of Brillouin data by the community. In this respect, we would be happy to focus our efforts on defining this format and taking care of implementing the necessary processing/visualization software and interface that allows anyone to look at the data in the same way. We also regard this to be crucial if we want to standardize the reporting of Brillouin data from diverse setups/users/applications. Therefore, at this stage it would be extremely important to agree on the structure of the file format. Carlo has proposed a very well thought-through structure for this, and it would be great to get your concrete feedback on this, as I understand this hasn’t really happened yet. To aid in this, e.g. Pierre and/or Sal could try to convert or save your standard data into this structure, and report on any difficulties or ambiguities that he encounters. Based on this I agree it’s best to meet and discuss and iron this out as a next step, however it either has to be next week (ideally Fri?), or after March 12 as I am travelling back-to-back in the meantime. Of course feel free to also meet without me for more technical discussions if this speeds up things. Either way we could then also discuss the file format etc. for the ‘raw’ data that Pierre proposed (and which is indeed very valuable as well). Let me know your thoughts, and let’s keep up the great momentum and excitement on this work! Best, Robert -- Dr. Robert Prevedel Group Leader Cell Biology and Biophysics Unit European Molecular Biology Laboratory Meyerhofstr. 1 69117 Heidelberg, Germany Phone: +49 6221 387-8722 Email: robert.prevedel@embl.de http://www.prevedel.embl.de On 20.02.2025, at 10:29, Carlo Bevilacqua via Software <software@biobrillouin.org> wrote: Hi Kareem, thanks for the suggestion, I agree that it is a good (and easy) way to divide the tasks! Just to be clear, it is not that I don't see the need/advantage of providing some standard treatment going from raw data to standard spectra, it is just that was not my priority when proposing the idea of a unified file format. Regarding the file format, splitting the one containing the raw data and the treatments from the one containing the spectra and the image in a standard format might be a good solution and we can always merge them at a later stage. As for the file containing the "standard" spectra, it would be very helpful if you can give some feedback on the structure I originally proposed. Keep in mind that the idea is to be able to associate spectrum/spectra to each pixel in the image, in a way that is independent of the scanning strategy and underlaying technique. I tried to find a solution that works for the techniques I am aware of, considering the peculiarities (e.g. for most VIPA setups there is no absolute frequency axis but only relative to water). If am happy to discuss why I made some specific choices and if you see a better way to achieve the same or see things differently. Both the 3rd and the 4th of March work for me. Best, Carlo On Thu, Feb 20, 2025 at 02:50, Kareem Elsayad via Software <software@biobrillouin.org> wrote: Dear All, (and I guess especially Carlo & Pierre 😊) I understand both your (main) points concerning what this all should be, and I think this is actually perfect for dividing tasks. The format of the hf or bh5 file being where things meet and what needs to be agreed on. The thing with raw data is ofcourse that it is variable between instruments and labs, and the conversion to “standard spectra” that can then be fitted etc. is going to be unique (maybe even between experiments in same project). That said, asking people to create some complex file from their data that works with a developed software is also unlikely to get a following. So (the way I see it) there are basically two parts. Getting from raw data to h5 (or bh5) format which contains the spectra in standard format. And then the whole analysis part and visualization (GUI, pretty features, etc.). While the latter may get the spotlight, it obviously relies heavily on the former being done right. Given that there are numerous “standard” BLS setup implementations the development of software for getting from raw data to h5 I think makes sense, since the h5 will no doubt be cryptic, and creating a working h5 is not something everyone will want to program by themselves (it is not an insignificant step given we are also trying to ultimately cater to biologists). As such a software that generates the h5 files, with drag and drop features and entering system parameters, for different setups makes sense and will save many labs a headache if they don’t have a good programmer on hand. So I would suggest that Pierre & Sal lead the work on developing this, while Carlo & Sebastian lead the work on developing the analysis/interface-presentation part. This way things are nicely divided and we just need to agree on the h5 file that is transferred between the two. From the side of Pierre & Sal there could maybe also be a second h5 generated that contains all the raw data and details on how it was converted to the transferred h5 file (for complete transparency this could then also be reported in papers if people wish). These could exist as two separate programs with respective GUIs but also eventually combined to a single one. How does this sound to everyone? To clear up details and try assign tasks going forward how about a Zoom first week of March (I would be free Monday 3rd and Tue 4th after 1pm)? All the best, Kareem From: Carlo Bevilacqua via Software <software@biobrillouin.org> Reply to: Carlo Bevilacqua <carlo.bevilacqua@embl.de> Date: Wednesday, 19. February 2025 at 20:43 To: Pierre Bouvet <pierre.bouvet@meduniwien.ac.at> Cc: <software@biobrillouin.org> Subject: [Software] Re: [EXTERN] Re: Software manuscript / BLS microscopy Hi Pierre, I realized that we might have slightly different aims. For me the most important part of this project is to have a unified file format that can be read and visualized by a standard software. The file format you are proposing is not sufficient for that in my opinion. For example one of my main motivation was to have an interface where the user can see the reconstructed image, click on a pixel, see the corresponding spectrum to check its quality and maybe try different fitting functions; that would already not be possible with your structure because the software would have no notion on where the spectral data is stored and how to associate it to a specific pixel. I don't see the structure of the file to be too complex as an issue, as long as it is functional: we can always provide an API and/or a GUI that allow people to take their spectra and save them in whatever format we decide without bothering about understanding the actual structure, the same way you can work with HDF5 file without having any understanding on how the data is actually stored on the disk. My idea of making a webapp as a GUI follows directly from there. Typical case: I sent some data to a collaborator and they can just run the app in their browser and check if the outliers they see in the image are real or a bad spectra. Similarly if we make a common database of Brillouin spectra, people can explore it easily using the webapp. From what I understood, you are instead more interested in going from raw data to an actual spectrum, which I don't see so much as a priority because each lab has their own code already and the actual procedure would be different for each lab (apart from standard instruments like the FP). I am not saying this should not be part of the software but not as a priority and rather has a layer where people can easily implement their own code (of course we could already implement code for standard instruments). I think it would be good to cleary define what is our common aim now, so we are sure we are working in the same direction. Let me know if you agree or I misunderstood what is your idea. Best, Carlo On Wed, Feb 19, 2025 at 16:11, Pierre Bouvet <pierre.bouvet@meduniwien.ac.at> wrote: Hi, I think you're trying to go too far too fast. The approach I present here is intentionally simple, so that people can very quickly get to storing their data in a HDF5 file format together with the parameters they used to acquire them with minimal effort. The closest to what you did is therefore as follows: - data are datasets with no other restriction and they are stored in groups - each group can have a set of attribute proper to the data they are storing - attributes have a nomenclature imposed by a spreadsheet and are in the form of text - the default name of a data is the name of a raw data: “Raw_data”, other arrays can have whatever name they want (Shift_5GHz, Frequency, ...) - arrays and attributes are hierarchical, so they apply to their groups and all groups under it. This is the bare minimum to meet our needs, so we need to stop here in the definition of the format since it’s already enough to have the GUI working correctly, and therefore the first version of the unified software advertised. Of course we will have to refine things later on, but we don’t want to scare people off by presenting them a file description that for one might not match their measurements and that is extremely hard to conceptually understand. To make my point clearer, take your definition of the format for example: there are 3 different amplitude arrays in your description, two different shift arrays and width arrays that are of different dimension, then we have a calibration group on one side but a spectrometer characterization array in another group that is called “experiment_info”, that’s just too complicated to use correctly. On the other hand, placing your raw data “as is” in a group dedicated to this data is conceptually easy and straightforward. Where you are right, is that should we have hundreds of people using it, we might in a near future want to store abscissa, impulse responses, … in a standardized manner. In that case, the question falls down to either adding sub-groups or storing the data together with the measure. Both are fine and don’t really pose a problem for now, essentially because we are not trying to visualize the results but just trying to unify the way to get them. Now regarding Dash, if I understand correctly, it’s just a way to change the frontend you propose? If that’s so, why not, but then I don’t really see the benefits: if you really want to use dash, you can always embed it inside a Qt app. Also Dash being browser based, you will only have one window for the whole interface, which will be a pain to deal with if you want to use the interface to do everything the GUI is expected to do (inspect an H5 file, convert PSD, treat data, edit parameters, inspect a failed treatment, simulate results using setups with slight changes of parameters…). We agree that at one point when people receive an h5 file, it will be useful to have a web interface that can do what yours or Sal’s GUI do (seeing the mapping results together with the spectrum, eventually the time-domain signal) but here again, it’s going too far too soon: let’s first have a simple and reliable GUI that can convert data from any spectrometer to PSDs and treat them with a unified code. This is the real challenge, visualization and nomenclature of results are both important but secondary. Also keep in mind that, the frontend can easily be generated by anyone really, with Copilot or ChatGPT or whatever AI, but you can’t ask them to develop the function that will correctly read your data and convert them to a PSD nor treat the PSD. This is done on the backend and is the priority since the unification essentially happens there. Best, Pierre Pierre Bouvet, PhD Post-doctoral Fellow Medical University Vienna Department of Anatomy and Cell Biology Wahringer Straße 13, 1090 Wien, Austria On 19/2/25, at 13:21, Carlo Bevilacqua <carlo.bevilacqua@embl.de> wrote: Hi Pierre, thanks for your reply. Regarding the file structure, what I am still not very clear about is what you define as Raw_data and data, how the actual spectra are stored and how the association to spatial coordinates and parameters is made. That's why I would really appreciate if you could make a document similar to what I did, where it is clear what each group should (or can) contain, what is the shape of each dataset, which attributes they have, etc... I am not saying that this should be the final structure of the file but I strongly believe that having it written in a structured way helps defining it and seeing potential issues. Regarding the webapp, it works by separating the frontend, which run in the browser and is responsible of running the GUI, and the backend which is doing the actual computation and that you can structure as you like with multithreading or any optimization you wish. The communication between frontend and backend is handled transparently by the framework, so you don't have to take care of it. When you run Dash locally a local server is created so the data stays on your computer and there is no issue with data transfer/privacy. If we want to move it to a server at a later stage, then you are right about the fact that data needs to be transferred to a server (although there might be solutions that allow you to still run the computation on the local browser, like WebAssembly, but I think it is too complex to look into this at this stage). Regarding safety and privacy, the data will be stored on the server only for the time that the user is using the app and then deleted (of course we will need to make a disclaimer on the website about this). Regarding space I don't think people at the beginning will load their 1Tb dataset on the webapp but rather look at some small dataset of few tens of Gb; in that case 1Tb of server space is more than enough (remember that the file will be stored only for the time the user is using the app). If people really start to use the webapp and space becomes a limitation, I would be super happy to look into WebAssembly so that the data can be handled locally from the browser without transferring it to the server. To summarize I would agree that, at this stage, there might be no advantage of a webapp over a local GUI (and might actually be a bit more work to develop it). But, if this project really flies, the potential of a webapp is huge, especially in the context of the BioBrillouin society where we want to have a database of spectral data and the webapp could be used to explore that without downloading anything on your computer. My main point is that moving now to a webapp would not be too much work, but if we want to do it at a later stage it will basically entail re-writing everything from scratch. Let me know what are your thoughts about it. Best, Carlo On Wed, Feb 19, 2025 at 08:51, Pierre Bouvet <pierre.bouvet@meduniwien.ac.at> wrote: Hi Carlo, You’re right, the format is still a little fuzzy. The main idea is to have a data-based hierarchy for storage: each data is stored in an individual group. From there, abscissa dependent on the data are stored in the same group and the treated data are stored in sub-groups. The names of the groups and sub-groups are fixed (Data_i), as is the name of the raw data (Raw_data) and abscissa (Abscissa_i). Also, the measure and spectrometer-dependent arguments have a defined nomenclature. To differentiate groups between them, we preferably attribute them a name as an attribute that is not used as an identifier, the identifier being either the path to the data/group from file root (Data_0/Data_42/Data_2/Raw_data) or potentially a hash value (not implemented). This I think allows all possible configurations, and using an hierarchical approach we can also pass common attributes and arrays (parameters of the spectrometer or abscissa arrays for example) on parent to reduce memory complexity. Now regarding the use of server-based GUI, first off, I’ve never used them so I’m just making supposition here but if the platform is able to treat data online, it will have to store the spectra somewhere in memory and it will not be local. My primary concerns with this approach is safety, particularly in terms of intellectual property protection, ethical considerations, and potential security vulnerabilities. Additionally, managing storage space will be a headache. Now, this doesn’t mean that we can’t have a server-based data plotter, or a server-based interface that does treatments locally but I don’t really see the benefits of this over a local software that can have multiple windows, which could at one point be multithreaded, and that could wrap c code to speed regressions for example (some of this might apply to Dash, I’m not super familiar with it). Now regarding memory complexity, having all the data we treat go on a server is a bad idea as it will raise the question of cost which will very rapidly become a real problem. Just an example: for a 100x100 map, I need 10Gb of memory (1Mo/point) with my setup (1To of archive storage is approximately 1euro/month) so this would get out of hands super fast assuming people use it. Now maybe there are solutions I don’t see for these problems and someone can take care of them but for me it’s just not worth the effort when having a local GUI solves all of these issues at once. But if you find a solution, then I’ll be happy to migrate to Dash, it won’t be fast to translate every feature but I can totally join you on the platform. Best, Pierre Pierre Bouvet, PhD Post-doctoral Fellow Medical University Vienna Department of Anatomy and Cell Biology Wahringer Straße 13, 1090 Wien, Austria On 18/2/25, at 20:26, Carlo Bevilacqua <carlo.bevilacqua@embl.de> wrote: Hi Pierre, regarding the structure of the file, I agree that we should keep it simple. I am not suggesting to make it more complex, rather to have a document where we define it in a clear and structured way rather than as a general description, to make sure that we are all on the same page. I am saying this because, to be honest, I am not sure I fully understand how you are structuring the HDF5 and I think it is important to agree on this now, rather than finding at a later stage that we had different ideas. Ideally if the GUI should be part of a single application, we should write it using a unified framework. The reasons why, after considering it for a bit, I lean towards Dash rather than Qt are: it can run in a web browser so it will be easy to eventually move it to a website, thus people can use it without installing it (which will hopefully help in promoting its use) it is based on plotly which is a graphical library with very good plotting capabilites and highly customizable, that would make the data visualization easier/more appealing Let me know what you think about it and if you see any advantage of Qt over a web app which I am not considering. Also, if we agree that Dash might be a better option, would you consider migrating to Dash? It might not be too much work if most of the code you wrote is for data processing rather that for the GUI itself and I could help you with that. Alternatively one workaround is to have a QtWebEngine in your Qt app and have the Dash app run inside that, but that would make only the Dash part portable to a server later on. Best, Carlo On Tue, Feb 18, 2025 at 10:24, Pierre Bouvet <pierre.bouvet@meduniwien.ac.at> wrote: Hi, Thanks, More than merge them later, just keep them separate in the process and rather than trying to build "one code to do it all", build one library and GUI that encapsulate codes to do everything. Having a structure is a must but it needs to be kept as simple as possible else we’ll rapidly find situations where we need to change the structure. The middle ground I think is to force the use of hierarchies and impose nomenclatures where problem are expected to appear: each dataset has its own group, each group can encapsulate other groups, each parameter of a group applies to all its sub-groups if the subgroup does not change its value, each array of a group applies to all of its sub-groups if the sub-group does not redefine an array with same name, the names of the groups are held as parameters and their ID are managed by the software. For the Plotly interface, I don’t know how to integrate it to Qt but if you find a way to do it, that’s perfect with me :) My vision of the GUI is something that unifies the format and can then execute scripts on the data stored in this format. I have pushed the application of the GUI to my data up to the point where I can do the whole information extraction process from it (add data, convert to PSD, fit curves). I think this could be super interesting if we implement it for all techniques. I think we could formalize the project in milestones, in particular define the minimal denominator that will allow us to have the paper. The milestone I reached for my spectro encompasses the following points: - Being able to add data to the file easily (by dragging & dropping to the GUI) - Being able to assign properties to these data easily (again by dragging & dropping) - Being able to structure the added data in groups/folders/containers/however we want to call it - Making it easy for new data types to be loaded - Allowing data from same type but different structure to be added (e.g. .dat files) - Execute scripts on the data easily and allowing parameters of these scripts to be defined from the GUI (e.g. select a peak on a curve to fit this peak) - Make it easy to add scripts for treating or extracting PSD from raw data. - Allow the export of a Python code to access the data from the file (we cans see them as “break points” in the treatment pipeline) - Edit of properties inside the GUI In any case I think we could build a spec sheet for the project with what we want to have in it based on what we want to advertise in the paper. We can always add things later on but if we agree on a strict minimum to have the project advertised, then that will set its first milestone on which we’ll be able to build later on. Best, Pierre Pierre Bouvet, PhD Post-doctoral Fellow Medical University Vienna Department of Anatomy and Cell Biology Wahringer Straße 13, 1090 Wien, Austria On 17/2/25, at 14:53, Carlo Bevilacqua via Software <software@biobrillouin.org> wrote: Hi Pierre, hi Sal, thanks for sharing your thoughts about it. @Pierre I am very sorry that Ren passed away :( As far as I understood you are suggesting to work on the individual aspects separately and then merge them together at a later stage? I am fine with that but I still think it is very important to now agree on what should be in the file format we are defining, because that is kind of the core of the project and will affect a lot of the design choices. I am happy to start working on the GUI for data visualization. In my idea, it will be something similar to this but written in dash, so it is a web app that for now can run locally (so no transfer of data to an external server is required) but in the future can easily be uploaded to a website that people can just use without installing anything on their computer. The question is how much of the data processing should be possible to do (or trigger) from the same GUI? I think at least a drop down menu with different fitting functions should be there, so the user can quickly check the results on a spectrum from a specific point in the image. @Pierre how are you envisioning the GUI you are working on? As far as I understood it is mainly to get the raw data and save it to our HDF5 format with some treatment on it. One idea could be to have a shared list of features that we are implementing in the GUI as we work on it, to avoid having the same functionality duplicated (or worst inconsistent) between the GUI for generating our file format and the GUI for visualization. Let me know what you think about it. Best, Carlo On Mon, Feb 17, 2025 at 11:04, Pierre Bouvet via Software <software@biobrillouin.org> wrote: Hi everyone, Sorry for the delayed response, I just went through the loss of Ren (my dog) and wasn’t at all able to answer. First of, Sal, I am making progress and I should have everything you have made on your branch integrated to the GUI branch soon, at which point I will push everything to main. Regarding the project, I think I align with Sal: keep things as simple as possible. My approach was to divide everything in 3 mostly independent layers: - Store data in an organized file that anyone can use, and make it easy to do - Convert these data into something that has physical significance: a Power Spectrum Density - Extract information from this Power Spectrum Density Each layer has its own challenge but they are independent on the challenge of having people using it: personally, if I had someone come to me with a new software to play with my measures, I would most likely only look at it for 1 minute (or less depending who made it) with a lot of apprehension and then based on how simple it looks and how much I understood of it, use it or - what is most likely - discard it. This is why Project.pdf is essentially meant to say: we put data arrays in groups and give them attributes written in text, but you can also create groups within groups to organize your data! I believe most of the people in the BioBrillouin society will have the same approach and before having something complex that can do a lot, I think it’s best to have something simple that can just unify the format (which in itself is a lot) and that people can use right away with a minimal impact on their own individual pipelines for data processing. To be honest, I don’t think people will blindly trust our software at first to treat their data, but they will most likely use it at first to organize their raw spectra, and maybe add their own treated data if they are feeling particularly adventurous. But that is not a problem as long as we start a movement. From there yes, we can complexity and create custom file architectures but that is already too complex I think for this first project. If we can all just import our data to the wrapper and specify their attributes, this will already be a success. Then for the paper, if we can all add a custom code to treat these data to obtain a PSD, I think this will be enough. As I said, the current API already allows you to add your data in a variety of format, so it’s just a question of developing the PSD conversion before having something we can publish (and then tell people to use). A few extra points: - Working with my setup, I realized if the user could choose between different algorithms to treat their own data, it would make the overall project much more usable (if an algorithm bugs for whatever reason, you can use another one) so I created 2 bottle necks in the form of functions (for PSD conversion and treatment) that would inspect modules dedicated to either PSD conversion or treatment, and list existing functions. It’s in between classical and modular programming but it makes the development of new PSD conversion code and treatment way way easier - The GUI is developed using oriented-object programming. Therefore I have already made some low-level choices that kind of impact all the GUI. I’m not saying they are the best choices, I’m just saying that they work, so if you want to work on the GUI, I would either recommend getting familiar with these choices, or making sure that all the functionalities are preserved, particularly the ones that are invisible (logging of treatment steps, treatment errors…) I’ll try merging the branches on Git asap and will definitely send you all an email when it’s done :) Best, Pierre Pierre Bouvet, PhD Post-doctoral Fellow Medical University Vienna Department of Anatomy and Cell Biology Wahringer Straße 13, 1090 Wien, Austria On 14/2/25, at 19:36, Sal La Cavera Iii via Software <software@biobrillouin.org> wrote: Hi all, I agree with the things enumerated and points made by Kareem/Carlo! I guess I would advocate for starting from a position of simplicity. We probably don't want to get weighed down by trying to include a bunch of bells and whistles from the start as these can be easily added once there is a minimally viable stable product. As long as data can be loaded to local memory, then treated in various (initially simple) ways through the GUI (and maybe maintain non-GUI compatibility for command-line warriors like myself), then the bh5 formatting stuff can be sorted on the back end? I definitely agree with Carlo's structure set out in the file format document; but all of that data will be floating around the memory in some shape or form and just needs to be wrapped up and packaged (according to Carlo's structure e.g.) when the user is happy and presses the "generate h5 filestore" etc. (?) Definitely agree with the recommendation to create the alpha using mainly requirements that our 3 labs would find useful (import filetypes, treatments, etc), and then we can add on more universal functionality second / get some beta testers in from other labs etc. I'm able to support on whatever jobs need doing and am free to meet in the beginning of March like you mentioned Kareem. Hope you guys have a nice weekend, Cheers, Sal --------------------------------------------------------------- Salvatore La Cavera III Royal Academy of Engineering Research Fellow Nottingham Research Fellow Optics and Photonics Group University of Nottingham Email: salvatore.lacaveraiii@nottingham.ac.uk ORCID iD: 0000-0003-0210-3102 <Outlook-tygjxucs.png> Book a Coffee and Research chat with me! From: Carlo Bevilacqua via Software <software@biobrillouin.org> Sent: 12 February 2025 13:31 To: Kareem Elsayad <kareem.elsayad@meduniwien.ac.at> Cc: sebastian.hambura@embl.de <sebastian.hambura@embl.de>; software@biobrillouin.org <software@biobrillouin.org> Subject: [Software] Re: Software manuscript / BLS microscopy You don't often get email from software@biobrillouin.org. Learn why this is important Hi Kareem, thanks for restarting this and sorry for my silence, I just came back from US and was planning to start working on this again. Could you also add Sebastian (in CC) to the mailing list? As you outlined, I would split the project into two parts: 1) getting from the raw data to some standard "processed' spectra and 2) do data analysis/visualization on that. For the second part the way I envision it is: the most updated definition of the file format from Pierre is this one, correct? In addition to this document I think it would be good to have a more structured description of the file (like this), where each field is clearly defined in terms of data type and dimensions. Sebastian was also suggesting that the document should contain the reasoning behind each specific choice in the specs and also things that we considered but decided had some issues (so in future we can look back at it). I still believe that the file format should contain the "processed" spectra (i.e. after FT and baseline subtraction for impulsive, or after taking a line profile and possibly linearization with VIPA,...) so we can apply standard data processing or visualization which is independent on the actual underlaying technique (e.g. VIPA, FP, stimulated, time domain, ...) agree on an API to read the data from our file format (most likely a Python class). For that we should: 1) decide on which information is important to extract (spectral information, spatial coordinates, hyper-parameters, metadata,...) 2) implement an interface to read the data (e.g. readSpectrumAtIndex(...), readImage(...), ...) build a GUI that use the previously defined API to show and process the data. I would say that, once we have a very solid description of the file format as in step 1, step 2 will come naturally and we can divide the actual implementation between us. Step 3 can also easily be implemented and divided between us once we have an API (and I am happy to work on the GUI myself). The first half of the project is the trickiest and I know Pierre has already done a lot of work in that direction. We should definitely agree on which extent we can define a standard to store the raw data, given the variability between labs, (and probably we should do it for common techniques like FP or VIPA) and how to implement the treatments, leaving to possibility to load some custom code in the pipeline to do the conversion. Let me know what you all think about this. If you agree I would start by making a document which clearly defines the file format in a structured way (as in my step 1 before). @Pierre could you write a new document or modify the document I originally made to reflect the latest structure you implemented for the file format? The metadata can still be defined in a separated excel sheet, as long as the data type and format is well defined there. Best regards, Carlo On Wed, Feb 12, 2025 at 02:19, Kareem Elsayad via Software <software@biobrillouin.org> wrote: Hi Robert, Carlo, Sal, Pierre, Think it would be good to follow up on software project. Pierre has made some progress here and would be good to try and define tasks a little bit clearer to make progress… There is always the potential issue of having “too many cooks in the kitchen” (that have different recipes for same thing) to move forward efficiently, something that I noticed can get quite confusing/frustrating when writing software together with people. So would be good to clearly assign tasks. I talked to Pierre today and he would be happy to integrate things in framework we have to try tie things together. What would foremost be needed would be ways of treating data, meaning code that takes a raw spectral image and meta-data and converts it into “standard” format (spectral representation) that can then be fitted. Then also “plugins” that serve a specific purpose in the analysis/rendering that can be included in framework. The way I see it (and please comment if you see differently), there are ~4 steps here: Take raw data (in .tif,, .dat, txt, etc. format) and meta data (in .cvs, xlsx, .dat, .txt, etc.) and render a standard spectral presentation. Also take provided instrument response in one of these formats and extract key parameters from this Fit the data with drop-down menu list of functions, that will include different functional dependences and functions corrected for instrument response. Generate/display a visual representation of results (frequency shift(s) and linewidth(s)), that is ideally interactive to some extent (and maybe has some funky features like looking at spectra at different points. These can be spatial maps and/or evolution with some other parameter (time, temperature, angle, etc.). Also be able to display maps of relative peak intensities in case of multiple peak fits, and whatever else useful you can think of. Extract “mechanical” parameters given assigned refractive indices and densities I think the idea of fitting modified functions (e.g. corrected based on instrument response) vs. deconvolving spectra makes more sense (as can account for more complex corrections due to non-optical anomalies in future –ultimately even functional variations in vicinity of e.g. phase transitions). It is also less error prone, as systematically doing decon with non-ideal registration data can really throw you off the cliff, so to speak. My understanding is that we kind of agreed on initial meta-data reporting format. Getting from 1 to 2 will no doubt be most challenging as it is very instrument specific. So instructions will need to be written for different BLS implementations. This is a huge project if we want it to be all inclusive.. so I would suggest to focus on making it work for just a couple of modalities first would be good (e.g. crossed VIPA, time-resolved, anisotropy, and maybe some time or temperature course of one of these). Extensions should then be more easy to navigate. At one point think would be good to involve SBS specific considerations also. Think would be good to discuss a while per email to gather thoughts and opinions (and already start to share codes), and then plan a meeting beginning of March -- how does first week of March look for everyone? I created this mailing list (software@biobrillouin.org) we can use for discussion. You should all be able to post to (and it makes it easier if we bring anyone else in along the way). At moment on this mailing list is Robert, Carlo, Sal, Pierre and myself. Let me know if I should add anyone. All the best, Kareem This message and any attachment are intended solely for the addressee and may contain confidential information. If you have received this message in error, please contact the sender and delete the email and attachment. Any views or opinions expressed by the author of this email do not necessarily reflect the views of the University of Nottingham. Email communications with the University of Nottingham may be monitored where permitted by law. _______________________________________________ Software mailing list -- software@biobrillouin.org To unsubscribe send an email to software-leave@biobrillouin.org _______________________________________________ Software mailing list -- software@biobrillouin.org To unsubscribe send an email to software-leave@biobrillouin.org _______________________________________________ Software mailing list -- software@biobrillouin.org To unsubscribe send an email to software-leave@biobrillouin.org _______________________________________________ Software mailing list -- software@biobrillouin.org To unsubscribe send an email to software-leave@biobrillouin.org _______________________________________________ Software mailing list -- software@biobrillouin.org To unsubscribe send an email to software-leave@biobrillouin.org _______________________________________________ Software mailing list -- software@biobrillouin.org To unsubscribe send an email to software-leave@biobrillouin.org
Perfect :) See you tomorrow, Pierre Pierre Bouvet, PhD Post-doctoral Fellow Medical University Vienna Department of Anatomy and Cell Biology Wahringer Straße 13, 1090 Wien, Austria
On 26/2/25, at 23:56, Kareem Elsayad via Software <software@biobrillouin.org> wrote:
Hi Carlo,
Sounds great!
Yes, Fri 28th @3pm still works for me. If it works for others, here is Zoom we can use:
https://us02web.zoom.us/j/5191046969?pwd=alpzaldoZEd3N2ZEQ0hYZU1RR1dOdz09 Meeting ID: 519 104 6969 Passcode: jY3zH8
All the best, kareem
From: Carlo Bevilacqua via Software <software@biobrillouin.org <mailto:software@biobrillouin.org>> Reply to: Carlo Bevilacqua <carlo.bevilacqua@embl.de <mailto:carlo.bevilacqua@embl.de>> Date: Wednesday, 26. February 2025 at 20:43 To: Kareem Elsayad <kareem.elsayad@meduniwien.ac.at> Cc: "software@biobrillouin.org" <software@biobrillouin.org> Subject: [Software] Re: [EXTERN] Re: Software manuscript / BLS microscopy
Hi Kareem, thank you for your email.
We are discussing with Pierre about the details of the file format and hopefully by our next meeting we will have agreed on a file format and we can divide the tasks.
If it is still an option, Friday 28th at 3pm works for me.
Best regards, Carlo
On Mon, Feb 24, 2025 at 03:17, Kareem Elsayad <kareem.elsayad@meduniwien.ac.at> wrote:
Dear All,
I (and Robert) were hoping there would be some consensus on this h5 file format. Let us do a Zoom on Fri 28th Feb at 15:00?
A couple of points pertaining to arguments…
Firstly, the precise structure is not worth getting into big arguments or fuss about…as long as it contains all the information needed for the analysis/representation, and all parties can work with (able to write and read knowing what is what), it ultimately doesn’t matter. In my opinion better put more (optional) stuff in if that is issue, and make it as inclusive as possible. In the end this does not need to be read by analysis/representation side, and when we go through we can decide if and what needs to be stripped. It is after all the “black box” between doing the experiment and having your final plots/images. Take a look at say a Zeiss file and try figure all that’s in it (it is not ideally structured maybe, but no biologist ever cared) – that said, I am sure their team had very similar arguments concerning structure etc.! (you have as many opinions as people). Maybe the issue is that the boundary conditions were not as well defined, but I would say at this point make them more inclusive than they need to be (empty spaces cost little memory)
Secondly, and following on from firstly. We need to simply agree and compromise to make any progress asap. Rather than building separate structures we need to add/modify a single existing structure or we might as well be working on independent projects. Carlo’s initially proposed structure seemed reasonable, maybe with some minor changes, and we should just go with that as a basis in my opinion. I would suggest that Pierre and Carlo have a Zoom together and try and come up with something that is acceptable to both. Like everything in life, this will involve making compromises. And then present it on 28th Feb. Quite simply, if there is no agreement we cannot do this project and in the end it doesn’t matter who is right or wrong.
Finally, I hope the disagreements from both sides are not seen as negative or personal attacks –it is ok to disagree (that’s why we have so many meetings!) On the plus side we are still more effective than the Austrian government (that is still deciding who should be next prime minister like half a year after elections) 😊
All the best,
Kareem
From: Pierre Bouvet via Software <software@biobrillouin.org <mailto:software@biobrillouin.org>> Reply to: Pierre Bouvet <pierre.bouvet@meduniwien.ac.at <mailto:pierre.bouvet@meduniwien.ac.at>> Date: Friday, 21. February 2025 at 11:55 To: Carlo Bevilacqua <carlo.bevilacqua@embl.de <mailto:carlo.bevilacqua@embl.de>> Cc: <software@biobrillouin.org <mailto:software@biobrillouin.org>> Subject: [Software] Re: [EXTERN] Re: Software manuscript / BLS microscopy
Hi Carlo,
Thanks for your reply, here is the next pong of this ping pong series ^^
1- I was talking indeed about the enums, but also the parameters that are defined as integers or floating point numbers and uint32. I think its easier (and that we already agreed on) having a spreadsheet with the parameters (easy to use, easy to update, easy to store and modify between two experiments using the same setup, allows to impose fixed choices for some parameters with drop-down lists, allows to detail the requirements for the attribute like its format or units and allows examples) and to just import it in the HDF5 file. From there it’s easier to have every attribute as strings both for the import and for the concept of what an attribute is.
2- OK
3- The problem is not necessarily the number of experiments you put in the file but the number of hyper parameters you want to take into account. Let’s take an example with a doubtable sense: I want to study the effect of low-frequency temperature fluctuations on micro mechanics in active samples both eukaryote and prokaryote showing a layered structure (endothelial cells arranged in epidermis, biofilms, …) with different cell types, and as a function of aging. I would then create a file with a first range of groups for the age of the sample, then inside these groups 2 groups for eukaryote and prokaryote samples, then inside these groups N groups for the samples I’m looking at, then inside these groups M groups for the temperature fluctuations I impose, then inside these groups the individual measures I make (this is fictional, I’m scared just to think at the amount of work to have all the samples, let alone measure them), this is simply not possible with your approach I think, and even simpler experiments like to measure the Allan variance on an instrument using 2 samples is not possible with your structure I think.
4- /
5- I think the real question is what we expect to get from a wrapper: for me is to wrap the measures of a given study, to then share, link to papers, treat using new approaches… Having a structure that can wrap both a full study and an experiment is in my opinion better in the long run than forcing the format to be used with only one experiment.
6- Yes, I understand it is an identifier, but why an integer? Why not a tuple? Why not a hash? And what if there’s a bug and instead of 3 you store you store 3.0, or 2, or ‘e'? Do you imagine the amount of work to understand where this bug comes from? Assuming it’s a bug because it might very well be just an inexperienced user making a mistake and then your file is broken. The idea is good but the safer way to have this is to work with nD arrays where the dimensionality is conserved I think, or just have all the information in the same group.
7- Here again, it’s more useful for your application but many people don’t use maps, so why force them to have even an empty array for that? Plus if they need to have a dedicated array for the concentration of crosslinkers (for example), they are faced with a non-trivial solution, which means they won’t use the format.
8- Yes, we could add an additional layer, but then it means that if you don’t need it, your datasets are in plain in the group and if you need it, then you don’t have the same structure. The solution I think is to already have the treated data in a group, if you don’t need more than one group (which will be most of the time the case) then you’ll only have one group of treated data.
9- I think it’s not useful. The SNR on the other hand is useful, because in shot-noise regime it’s a marker of variance, and this is one of the ways to spot outliers from treatment (if the SNR doesn’t match the returned standard deviation on the shift of one peak, there’s a problem somewhere).
10- The std of a fit is obtained by taking the square root of the diagonalized covariant matrix returned by the fit as long as your parameters are independent (it’s super interesting actually and a little bit more complicated but it’s true enough for lorentzian, DHO, Gaussian...)
11- OK but then why not have the calibration curves placed with your measures if they are only applicable to this measure? Once again, I think having indexes that are modifiable by the user is not safe (the technical term is “idiot proof”)
12- I don’t agree, if you are capturing points at a fixed interval, then you can reconstruct the timestamp from the timestamp of the first acquisition and either the delay between two acquisitions or the timestamp of the last acquisition. Most of the time however we don’t even need this as we consider the sample to be time-invariant on the scale of our measure, so a single timestamp for all the measure is enough and is better stored as an attribute. In the special case where we are not time-invariant, then time becomes the abscissa of the measures and in that case yes, it can be a dataset, but then it’s better to not impose a fixed name for this dataset and rather let the user decide what hyper parameter is changed during he’s measure, this way the user is free to use whatever hyper parameters he feels like it.
13- OK
14- Still not clear to me. My approach is to consider an experiment to be a measure of a sample as function of one or more controlled or measured hyper parameter. So my general approach for storing experiments is have 3 files: abscissa (with the hyper parameters that vary), measure and metadata, which translates to “Raw_data”, “Abscissa_i” and attributes for this format.
15- OK, I think more than brainstorming about how to treat correctly a VIPA spectrum, we need to allow people to tell how they do it if we want this project to be used in short term, unification is a goal of this project and we will advertise it in the paper, but to be honest, I doubt people like Giuliano will run with it without second guessing it, particularly with its clinical setups, so there will be some going back and forth before we have something stable, and this means we need to allow for this back and forth to appear somewhere, I propose having it as a parameter.
16- Here I think you allow too much liberty, changing the frequency of an array to GHz is trivial and I think most people do use GHz as the unit of their frequency arrays anyway. We need to make it clear that the frequency axis is in GHz but I think we don’t need a full element for this. If you really want to specify the unit of the Frequency dataset, I would suggest putting it in its attributes in any case, and not as another element in the structure.
17- OK
18- I think it’s one way to do it but it is not intuitive: I won’t have the reflex to go check in the attributes if there is a parameter “sam_as” to see if the calibration applies to all the curves. The way I would expect it to be is using the hierarchical logic of the format: if I’m looking at a dataset in a sub-group of a group containing a calibration dataset, then I know this calibration applies to my data:
Data
|- Data_0 (group)
| |- Calibration (dataset)
| |- Data_0 (group) | | |- Raw_data (dataset)
| |- Data_1 (group) | | |- Raw_data (dataset)
|- Data_1 (group)
| |- Calibration (dataset)
| |- Data_0 (group)
| | |- Raw_data (dataset)
I think in this example most people would suppose Data/Data_0/Calibration applies both to Data/Data_0/Data_0/Raw_data and Data/Data_0/Data_1/Raw_data but not Data/Data_1/Data_0/Raw_data whose calibration is intuitively Data/Data_1/Calibration
Once again, my approach of the structure is trying to make it intuitive and most of all, simple. For instance if I place myself in the position of someone that is willing to try “just to see how it works”, I would give myself 10s to understand how I could have a file for only one measure that complies with the new (hope to be) standard. It is my opinion as I already told you before, that your approach is too complete and therefore complex, which will inevitably lead to people not using the format unless there’s a GUI to do it for them (and even then they might not use it). I don’t want to impose my vision here, and like you I have put a lot of thinking (and testing) into building the format I propose, but I’m convinced that if we go with your structure, not only will it make it hard for anyone to understand how to use it but we’ll have problems using it ourselves. I want to repeat that I don’t have the solution, I’m just confident that my approach is much easier to conceptually understand and less restrictive than yours. In any case we can agree to disagree on that, but then it’ll be good to have an alternative backend like the one I did with your format to try and use it, and see if indeed it’s better, because if it’s not and people don’t use it, I don’t want to go back to all the trouble I had building the library, docs and GUI just to try.
I don’t want to impose you anything but it would be awesome if you took the time to read the document I made and completed for you yesterday. Then you can just tell me where you think I’m missing something and you had a better solution because as you might see, I’m having problems with nearly all your structure and we can’t really use it as a starting point at this stage since most of the backend is written and the front-end is already functional for my setup (and soon Sal’s and the TFP).
Best,
Pierre
Pierre Bouvet, PhD
Post-doctoral Fellow
Medical University Vienna
Department of Anatomy and Cell Biology
Wahringer Straße 13, 1090 Wien, Austria
On 20/2/25, at 22:55, Carlo Bevilacqua <carlo.bevilacqua@embl.de <mailto:carlo.bevilacqua@embl.de>> wrote:
Hi Pierre,
thank you for your feedback. I appreciate that you took the time to go through my definition and highlighting the critical points.
I much prefer this rather than starting working with a file format where problem might arise in the future. If we understand what are the reasons behind our choices in the definition we can merge the best of the two approaches, rather than defining two "standards" for the same thing with each of them having their limitations.
I will provide an answer to each of the points you raised (I gave numbers to the points in your email below, so it is easier to reference):
I am not sure to which attribute you are referring specifically, but I am completely fine with text; I defined enums where I felt it makes sense to do so because there is a discrete number of options (one could always add elements at the end of an enum) I defined the attributes before we started working together and I am very much open to changing them so they reflect what you have in the spreadsheet; in the document defining the file format we can just state that the attributes and their type are defined in the excel sheet I did it this way because in my idea an individual HDF5 file corresponds to a single experiment. If you feel there is an advantage in keeping different experiments in the same file I am open to introduce your structure of subgroups; I honestly feel like this will only make the file unnecessarly large and different experiments would mostly not share much (apart from the metadata, which is anyway a small overhead in terms of filesize). Now of course the question is what you define as an 'experiment': for me different timepoints or measurements at different temperatures/angles/etc on the same sample are a single experiment and I defined the file so that it is possible to save them in a single file; measurements on different samples are not the same experiment in my original idea same as the point 3 same as before, I would put different samples in different files but happy to introduce your structure if you feel there is an advantage the index is used to uniquely identify an entry in the 'Analysed_data' table; it is important in the contest of reconstructing the image (see the definition of the 'tn/image' group) in my opinion spatial coordinates have a privileged role since we are doing imaging and having them well defined it is important to reconstruct the image; for different abscissas I defined the 'parameters' dataset (more in point 14). If one is not doing imaging this dataset can be set to an empty array or a single element (we can include this in the definition) in my idea the "Analyzed_data" group doesn't contain multiple treatments but the result of the fit on the 'final' spectra, which are unique; if you are referring to the 'n' in the 'Shift_n_GHz' that is included in case a multipeak fit is performed. Now, if we want to include the possibility of multiple treatments like you are doing (which I didn't originally consider) we could just add an additional layer to the hierarchy that is the amplitude of the peak from the fit. I am not sure if you didn't understand what I meant or you think it is not an useful information The fit error actually contains 2 quantities: R2 and RMSE (as defined in the type). I am not sure how you would calculate a std from a single spectrum the calibration curves are stored in the 'calibration_spectra' group with the name of the dataset matching the respective 'Calibration_index'. In our VIPA setup we are acquiring multiple calibration curves during a single acquisition to compensate for laser drift, that's why I introduced the possibility of having multiple calibration curves. Note that the 'Calibration_index' is defined as optional exactly because it might not be needed each spectrum can have its own timestamp if it is acquired from a different camera image or scan of a FP, etc that's why it needs to be a dataset. Note that it is an optional dataset good point, we can rename it to PSD that is exactly to account for the general case of the abscissa not being a spatial coordinate and it contains the values for the parameters (e.g. the angles in an angle resolved measurement). It is a dataset whose dimensions are defined in the description (happy to elaborate more if it is not clear) float is the type of each element; it is a dataset whose dimensions are defined in the description; the way to define the frequency axis in general for setups which don't have an absolute frequency (like VIPAs) is tricky and would be good to brainstorm about possibile solutions as for the name we can change it, but the problem on how to deal with the situation when one doesn't have the frequency in GHz remains. My idea here was to leave the possibility of different units because the fit and most of the data analysis can be performed even if the x-axis is not in GHz and the actual conversion of the shift to GHz can be done at the end and requires the calibration data. As in my previous point, I am happy to brainstorm different solutions to this problem it is indeed redundant with 'Analyzed_data' and I pushed a change on GitHub to correct this see point 11; also note that the group is optional (in case people don't need it) and I introduced the attribute "same_as" to avoid repeating it multiple times if it is always the same for all the 'tn' As you see we agree with some of the points or we could find a common solution, for others it was mainly a misunderstanding on what were my intentions (probably my bad in expressing them, but you could have asked if it was not clear).
Hope this helps claryfing my reasoning in the file definition and I am happy to discuss all the open points.
I will look in details at your newest definition that you shared in the next days.
Best,
Carlo
On Thu, Feb 20, 2025 at 18:25, Pierre Bouvet via Software <software@biobrillouin.org <mailto:software@biobrillouin.org>> wrote:
Hi,
My goal with this project is to unify the treatment of BLS spectra, to then allow us to address fundamental biophysical questions with BLS as a community in the mid-long term. Therefore my principal concern for this format is simplicity: measure are datasets called “Raw_data”, if they need one or more abscissa to be understood, this/these abscissa are called “Abscissa_i” and they are placed in groups called “Data_i” where we can store their attributes in the group’s attributes. From there, I can put groups in groups to store an experiment with different ... (e.g. : samples, time points, positions, techniques, wavelengths, patients, …). This structure is trivial but lacks usability so I added an attribute called “Name” to all groups that the user can define as he wants without impacting the structure.
Now here are a few critics on Carlo’s approach. I didn’t want to share them because I hate criticizing anyone’s work, and I do think that what Carlo presented is great, but I don’t want you to think that I just trashed what he did, to the contrary, it’s because I see limitations in his approach that I tried developing another, simpler one. So here are the points I have problems with in Carlo’s approach:
The preferred type of the information on an experiment should be text as we’ll likely see new devices (like your super nice FT approach) appear in the next months/years that will require new parameters to be defined to describe them. I think we should really try not to use anything else than strings in the attributes. The experiment information should not be defined by the HDF5 file structure but rather by a spreadsheet because everyone knows how to use Excel, and it’s way easier to edit an Excel file than an HDF5 file. Experiment information should apply to measures and not to files, because they might vary from experiment to experiment, I think their preferred allocation is thus the attributes of the groups storing individual measures (in my approach) The characterization of the instrument might also be experiment-dependent (if for some reason you change the tilt of a VIPA during the experiment for example), therefore having a dedicated group for it might not work for some experiments The groups are named “tn” and the structure does not present the nomenclature of sub-groups, this is a big problem if we want to store in the same format say different samples measured at different times (the logic patch would be to have sub-groups follow the same structure so tn/tm/tl/… but it should be mentioned in the definition of the structure) The dataset “index” in Analyzed_data is difficult to understand, what is it used for? I think it’s not useful, I would delete it. The "spatial position" in Analyzed_data supposes that we are doing mappings. This is too restrictive for no reason, it’s better to generalize the abscissa and allow the user to specify a non-limiting parameter (the “Name” attribute for example) with whatever value he wants (position, temperature, concentration of whatever, …). A concrete example of a limit here: angle measurements, I want my data to be dependent on the angle, not the position. Having different datasets in the same “Analyzed_data” group corresponding to the result of different treatments raises the question of where the process followed to treat the data is stored. A better approach would be to create n groups “Analyzed_data_n” with only one dataset of treated values, allowing for the process to be stored in the attributes of the group Analyzed_data_n I don’t understand why store an array of amplitude in “Analyzed_data”, is it for the SNR? Then maybe we could name this array “SNR”? The array “Fit_error_n” is super important but ill defined. I’d rather choose a statistical quantity like the variance, standard deviation (what I think is best), least-square error… and have it apply to both the Shift and Linewidth array as so: “Shift_std” and “Linewidth_std" I don’t understand “Calibration_index”: where are the calibration curves? Are they in “experiment_info”? If so, we expect people to already process their calibration curves to create an array before adding them to the hdf5 file? I’m not very familiar with all devices, so I might not see the limitations here but do we ever have more than one calibration curve per measure? Could we not add it to the group as a “Calibration” dataset? Or just have one group with the calibration curve? Timestamp is typically an attribute, it shouldn’t be present inside the group as an element. In tn/Spectra_n , “Amplitude” is the PSD so I would call it PSD because there are other “Amplitude” datasets so it’s confusing. If it’s not the PSD, I would call it “Raw_data”. I don’t understand what “Parameters” is meant to do in tn/Spectra_n, plus it’s not a dataset so I would put it in attributes or most likely not use it as I don’t understand what it does. Frequency is a dataset, not a float (I think). We also need to have a place where to store the process to obtain it. In VIPA spectrometers for instance this is likely a big (the main even I think) source of error. I would put this process in attributes (as a text). I don’t think “Unit” is useful, if we have a frequency axis, then we should define it directly in GHz, and if it’s a pixel axis, then for one we should not call it “Frequency” and then it’s better not to put anything since by default we will consider the abscissa (in absence of Frequency) as a simple range of the size of the “Amplitude” dataset. /tn/Images: it’s a good idea, but I believe this is redundant with “Analyzed_data” (?) If it’s not then I don’t understand how we get the datasets inside it. “Calibration_spectra” is a separate group, wouldn’t it be better to have it in “Experiment_info” in the presented structure? Also might scare off people that might not want to store a calibration file every time they create a HDF5 file (I might or might not be one of them) Like I said before, I don’t want this to be taken as more than what lead me to defining a new approach to the format. I want to state once again that Carlo's structure is complete, only it’s useful for specific instruments and applications, and difficultly applicable to other techniques and scenarios (and more lazy people like myself).
Following Carlo’s mail, I’ve also completed the PDF I made to describe the structure I use in the HDF5_BLS library, I’m joining it to this email and pushing its code to GitHub <https://github.com/bio-brillouin/HDF5_BLS/blob/GUI_development/guides/Projec...>, feel free to edit it and criticize it at length (I feel like I deserve it after this email I really tried not to write).
Best,
Pierre
Pierre Bouvet, PhD
Post-doctoral Fellow
Medical University Vienna
Department of Anatomy and Cell Biology
Wahringer Straße 13, 1090 Wien, Austria
On 20/2/25, at 16:12, Robert Prevedel via Software <software@biobrillouin.org <mailto:software@biobrillouin.org>> wrote:
Dear all,
great to see all this discussion in this thread, and thanks to especially Pierre and Carlo for driving this forward. I’ve been following the various emails and arguments closely but simply didn’t have any time to chip in due to some important committments in the past days.
I understand that there was a bit of a disagreement about what the focus of this effort should be, so maybe it just helps to highlight my lab's view on this (which I just discussed in depth with Carlo and Sebastian):
Our original motivation was to come up with and define a common file-format, as we regard this to be key to unify the processing and visualization of Brillouin data by the community. In this respect, we would be happy to focus our efforts on defining this format and taking care of implementing the necessary processing/visualization software and interface that allows anyone to look at the data in the same way. We also regard this to be crucial if we want to standardize the reporting of Brillouin data from diverse setups/users/applications.
Therefore, at this stage it would be extremely important to agree on the structure of the file format. Carlo has proposed a very well thought-through structure for this, and it would be great to get your concrete feedback on this, as I understand this hasn’t really happened yet. To aid in this, e.g. Pierre and/or Sal could try to convert or save your standard data into this structure, and report on any difficulties or ambiguities that he encounters.
Based on this I agree it’s best to meet and discuss and iron this out as a next step, however it either has to be next week (ideally Fri?), or after March 12 as I am travelling back-to-back in the meantime. Of course feel free to also meet without me for more technical discussions if this speeds up things. Either way we could then also discuss the file format etc. for the ‘raw’ data that Pierre proposed (and which is indeed very valuable as well).
Let me know your thoughts, and let’s keep up the great momentum and excitement on this work!
Best,
Robert
--
Dr. Robert Prevedel
Group Leader
Cell Biology and Biophysics Unit
European Molecular Biology Laboratory
Meyerhofstr. 1
69117 Heidelberg, Germany
Phone: +49 6221 387-8722
Email: robert.prevedel@embl.de <mailto:robert.prevedel@embl.de>
http://www.prevedel.embl.de <http://www.prevedel.embl.de/>
On 20.02.2025, at 10:29, Carlo Bevilacqua via Software <software@biobrillouin.org <mailto:software@biobrillouin.org>> wrote:
Hi Kareem,
thanks for the suggestion, I agree that it is a good (and easy) way to divide the tasks! Just to be clear, it is not that I don't see the need/advantage of providing some standard treatment going from raw data to standard spectra, it is just that was not my priority when proposing the idea of a unified file format.
Regarding the file format, splitting the one containing the raw data and the treatments from the one containing the spectra and the image in a standard format might be a good solution and we can always merge them at a later stage.
As for the file containing the "standard" spectra, it would be very helpful if you can give some feedback on the structure I originally proposed <https://github.com/prevedel-lab/Brillouin-standard-file/blob/main/docs/Bh5_f...>. Keep in mind that the idea is to be able to associate spectrum/spectra to each pixel in the image, in a way that is independent of the scanning strategy and underlaying technique. I tried to find a solution that works for the techniques I am aware of, considering the peculiarities (e.g. for most VIPA setups there is no absolute frequency axis but only relative to water). If am happy to discuss why I made some specific choices and if you see a better way to achieve the same or see things differently.
Both the 3rd and the 4th of March work for me.
Best,
Carlo
On Thu, Feb 20, 2025 at 02:50, Kareem Elsayad via Software <software@biobrillouin.org <mailto:software@biobrillouin.org>> wrote:
> Dear All, (and I guess especially Carlo & Pierre 😊) > > > > > > I understand both your (main) points concerning what this all should be, and I think this is actually perfect for dividing tasks. The format of the hf or bh5 file being where things meet and what needs to be agreed on. > > > > > > The thing with raw data is ofcourse that it is variable between instruments and labs, and the conversion to “standard spectra” that can then be fitted etc. is going to be unique (maybe even between experiments in same project). That said, asking people to create some complex file from their data that works with a developed software is also unlikely to get a following. > > > > > > So (the way I see it) there are basically two parts. Getting from raw data to h5 (or bh5) format which contains the spectra in standard format. And then the whole analysis part and visualization (GUI, pretty features, etc.). > > > While the latter may get the spotlight, it obviously relies heavily on the former being done right. Given that there are numerous “standard” BLS setup implementations the development of software for getting from raw data to h5 I think makes sense, since the h5 will no doubt be cryptic, and creating a working h5 is not something everyone will want to program by themselves (it is not an insignificant step given we are also trying to ultimately cater to biologists). As such a software that generates the h5 files, with drag and drop features and entering system parameters, for different setups makes sense and will save many labs a headache if they don’t have a good programmer on hand. > > > > > > So I would suggest that Pierre & Sal lead the work on developing this, while Carlo & Sebastian lead the work on developing the analysis/interface-presentation part. This way things are nicely divided and we just need to agree on the h5 file that is transferred between the two. From the side of Pierre & Sal there could maybe also be a second h5 generated that contains all the raw data and details on how it was converted to the transferred h5 file (for complete transparency this could then also be reported in papers if people wish). These could exist as two separate programs with respective GUIs but also eventually combined to a single one. > > > How does this sound to everyone? > > > > > > To clear up details and try assign tasks going forward how about a Zoom first week of March (I would be free Monday 3rd and Tue 4th after 1pm)? > > > > > > All the best, > > > Kareem > > > > > > > > > > From: Carlo Bevilacqua via Software <software@biobrillouin.org <mailto:software@biobrillouin.org>> > Reply to: Carlo Bevilacqua <carlo.bevilacqua@embl.de <mailto:carlo.bevilacqua@embl.de>> > Date: Wednesday, 19. February 2025 at 20:43 > To: Pierre Bouvet <pierre.bouvet@meduniwien.ac.at <mailto:pierre.bouvet@meduniwien.ac.at>> > Cc: <software@biobrillouin.org <mailto:software@biobrillouin.org>> > Subject: [Software] Re: [EXTERN] Re: Software manuscript / BLS microscopy > > > > > > > > > Hi Pierre, > > > > > > > > > I realized that we might have slightly different aims. > > > > > > > > > For me the most important part of this project is to have a unified file format that can be read and visualized by a standard software. The file format you are proposing is not sufficient for that in my opinion. For example one of my main motivation was to have an interface where the user can see the reconstructed image, click on a pixel, see the corresponding spectrum to check its quality and maybe try different fitting functions; that would already not be possible with your structure because the software would have no notion on where the spectral data is stored and how to associate it to a specific pixel. > > > > > I don't see the structure of the file to be too complex as an issue, as long as it is functional: we can always provide an API and/or a GUI that allow people to take their spectra and save them in whatever format we decide without bothering about understanding the actual structure, the same way you can work with HDF5 file without having any understanding on how the data is actually stored on the disk. > > > > > > > > > My idea of making a webapp as a GUI follows directly from there. Typical case: I sent some data to a collaborator and they can just run the app in their browser and check if the outliers they see in the image are real or a bad spectra. Similarly if we make a common database of Brillouin spectra, people can explore it easily using the webapp. > > > > > > From what I understood, you are instead more interested in going from raw data to an actual spectrum, which I don't see so much as a priority because each lab has their own code already and the actual procedure would be different for each lab (apart from standard instruments like the FP). I am not saying this should not be part of the software but not as a priority and rather has a layer where people can easily implement their own code (of course we could already implement code for standard instruments). > > > > > > > > > I think it would be good to cleary define what is our common aim now, so we are sure we are working in the same direction. > > > > > > > > > Let me know if you agree or I misunderstood what is your idea. > > > > > > > > > Best, > > > > > Carlo > > > > > > > On Wed, Feb 19, 2025 at 16:11, Pierre Bouvet <pierre.bouvet@meduniwien.ac.at <mailto:pierre.bouvet@meduniwien.ac.at>> wrote: > > > > >> Hi, >> >> >> >> >> >> >> >> >> I think you're trying to go too far too fast. The approach I present here <https://github.com/bio-brillouin/HDF5_BLS/blob/GUI_development/guides/Projec...> is intentionally simple, so that people can very quickly get to storing their data in a HDF5 file format together with the parameters they used to acquire them with minimal effort. The closest to what you did is therefore as follows: >> >> >> >> >> - data are datasets with no other restriction and they are stored in groups >> >> >> >> >> - each group can have a set of attribute proper to the data they are storing >> >> >> >> >> - attributes have a nomenclature imposed by a spreadsheet and are in the form of text >> >> >> >> >> - the default name of a data is the name of a raw data: “Raw_data”, other arrays can have whatever name they want (Shift_5GHz, Frequency, ...) >> >> >> >> >> - arrays and attributes are hierarchical, so they apply to their groups and all groups under it. >> >> >> >> >> This is the bare minimum to meet our needs, so we need to stop here in the definition of the format since it’s already enough to have the GUI working correctly, and therefore the first version of the unified software advertised. Of course we will have to refine things later on, but we don’t want to scare people off by presenting them a file description that for one might not match their measurements and that is extremely hard to conceptually understand. To make my point clearer, take your definition of the format for example: there are 3 different amplitude arrays in your description, two different shift arrays and width arrays that are of different dimension, then we have a calibration group on one side but a spectrometer characterization array in another group that is called “experiment_info”, that’s just too complicated to use correctly. On the other hand, placing your raw data “as is” in a group dedicated to this data is conceptually easy and straightforward. >> >> >> >> >> Where you are right, is that should we have hundreds of people using it, we might in a near future want to store abscissa, impulse responses, … in a standardized manner. In that case, the question falls down to either adding sub-groups or storing the data together with the measure. Both are fine and don’t really pose a problem for now, essentially because we are not trying to visualize the results but just trying to unify the way to get them. >> >> >> >> >> Now regarding Dash, if I understand correctly, it’s just a way to change the frontend you propose? If that’s so, why not, but then I don’t really see the benefits: if you really want to use dash, you can always embed it inside a Qt app. Also Dash being browser based, you will only have one window for the whole interface, which will be a pain to deal with if you want to use the interface to do everything the GUI is expected to do (inspect an H5 file, convert PSD, treat data, edit parameters, inspect a failed treatment, simulate results using setups with slight changes of parameters…). We agree that at one point when people receive an h5 file, it will be useful to have a web interface that can do what yours or Sal’s GUI do (seeing the mapping results together with the spectrum, eventually the time-domain signal) but here again, it’s going too far too soon: let’s first have a simple and reliable GUI that can convert data from any spectrometer to PSDs and treat them with a unified code. This is the real challenge, visualization and nomenclature of results are both important but secondary. Also keep in mind that, the frontend can easily be generated by anyone really, with Copilot or ChatGPT or whatever AI, but you can’t ask them to develop the function that will correctly read your data and convert them to a PSD nor treat the PSD. This is done on the backend and is the priority since the unification essentially happens there. >> >> >> >> >> >> >> >> >> Best, >> >> >> >> >> >> >> >> >> Pierre >> >> >> >> >> >> >> >> >> Pierre Bouvet, PhD >> >> >> >> >> Post-doctoral Fellow >> >> >> >> >> Medical University Vienna >> >> >> >> >> Department of Anatomy and Cell Biology >> >> >> >> >> Wahringer Straße 13, 1090 Wien, Austria >> >> >> >> >> >> >> >> >> >> >> >> >> >> >> >> >> >> >> >> >> >> >> >>> On 19/2/25, at 13:21, Carlo Bevilacqua <carlo.bevilacqua@embl.de <mailto:carlo.bevilacqua@embl.de>> wrote: >>> >>> >>> >>> >>> >>> >>> >>> >>> Hi Pierre, >>> >>> >>> >>> >>> thanks for your reply. >>> >>> >>> >>> >>> >>> >>> >>> >>> Regarding the file structure, what I am still not very clear about is what you define as Raw_data and data, how the actual spectra are stored and how the association to spatial coordinates and parameters is made. That's why I would really appreciate if you could make a document similar to what I did <https://github.com/prevedel-lab/Brillouin-standard-file/blob/main/docs/Bh5_f...>, where it is clear what each group should (or can) contain, what is the shape of each dataset, which attributes they have, etc... >>> >>> >>> >>> >>> I am not saying that this should be the final structure of the file but I strongly believe that having it written in a structured way helps defining it and seeing potential issues. >>> >>> >>> >>> >>> >>> >>> >>> >>> Regarding the webapp, it works by separating the frontend, which run in the browser and is responsible of running the GUI, and the backend which is doing the actual computation and that you can structure as you like with multithreading or any optimization you wish. The communication between frontend and backend is handled transparently by the framework, so you don't have to take care of it. >>> >>> >>> >>> >>> When you run Dash locally a local server is created so the data stays on your computer and there is no issue with data transfer/privacy. >>> >>> >>> >>> >>> If we want to move it to a server at a later stage, then you are right about the fact that data needs to be transferred to a server (although there might be solutions that allow you to still run the computation on the local browser, like WebAssembly <https://webassembly.org/>, but I think it is too complex to look into this at this stage). Regarding safety and privacy, the data will be stored on the server only for the time that the user is using the app and then deleted (of course we will need to make a disclaimer on the website about this). Regarding space I don't think people at the beginning will load their 1Tb dataset on the webapp but rather look at some small dataset of few tens of Gb; in that case 1Tb of server space is more than enough (remember that the file will be stored only for the time the user is using the app). If people really start to use the webapp and space becomes a limitation, I would be super happy to look into WebAssembly so that the data can be handled locally from the browser without transferring it to the server. >>> >>> >>> >>> >>> >>> >>> >>> >>> To summarize I would agree that, at this stage, there might be no advantage of a webapp over a local GUI (and might actually be a bit more work to develop it). But, if this project really flies, the potential of a webapp is huge, especially in the context of the BioBrillouin society where we want to have a database of spectral data and the webapp could be used to explore that without downloading anything on your computer. My main point is that moving now to a webapp would not be too much work, but if we want to do it at a later stage it will basically entail re-writing everything from scratch. >>> >>> >>> >>> >>> >>> >>> >>> >>> Let me know what are your thoughts about it. >>> >>> >>> >>> >>> >>> >>> >>> >>> Best, >>> >>> >>> >>> >>> Carlo >>> >>> >>> >>> >>> >>> >>> >>> >>> >>> >>> >>> On Wed, Feb 19, 2025 at 08:51, Pierre Bouvet <pierre.bouvet@meduniwien.ac.at <mailto:pierre.bouvet@meduniwien.ac.at>> wrote: >>> >>> >>> >>> >>>> Hi Carlo, >>>> >>>> >>>> >>>> >>>> >>>> >>>> >>>> >>>> You’re right, the format is still a little fuzzy. The main idea is to have a data-based hierarchy for storage: each data is stored in an individual group. From there, abscissa dependent on the data are stored in the same group and the treated data are stored in sub-groups. The names of the groups and sub-groups are fixed (Data_i), as is the name of the raw data (Raw_data) and abscissa (Abscissa_i). Also, the measure and spectrometer-dependent arguments have a defined nomenclature. To differentiate groups between them, we preferably attribute them a name as an attribute that is not used as an identifier, the identifier being either the path to the data/group from file root (Data_0/Data_42/Data_2/Raw_data) or potentially a hash value (not implemented). This I think allows all possible configurations, and using an hierarchical approach we can also pass common attributes and arrays (parameters of the spectrometer or abscissa arrays for example) on parent to reduce memory complexity. >>>> >>>> >>>> >>>> >>>> Now regarding the use of server-based GUI, first off, I’ve never used them so I’m just making supposition here but if the platform is able to treat data online, it will have to store the spectra somewhere in memory and it will not be local. My primary concerns with this approach is safety, particularly in terms of intellectual property protection, ethical considerations, and potential security vulnerabilities. Additionally, managing storage space will be a headache. >>>> >>>> >>>> >>>> >>>> Now, this doesn’t mean that we can’t have a server-based data plotter, or a server-based interface that does treatments locally but I don’t really see the benefits of this over a local software that can have multiple windows, which could at one point be multithreaded, and that could wrap c code to speed regressions for example (some of this might apply to Dash, I’m not super familiar with it). Now regarding memory complexity, having all the data we treat go on a server is a bad idea as it will raise the question of cost which will very rapidly become a real problem. Just an example: for a 100x100 map, I need 10Gb of memory (1Mo/point) with my setup (1To of archive storage is approximately 1euro/month) so this would get out of hands super fast assuming people use it. >>>> >>>> >>>> >>>> >>>> Now maybe there are solutions I don’t see for these problems and someone can take care of them but for me it’s just not worth the effort when having a local GUI solves all of these issues at once. But if you find a solution, then I’ll be happy to migrate to Dash, it won’t be fast to translate every feature but I can totally join you on the platform. >>>> >>>> >>>> >>>> >>>> >>>> >>>> >>>> >>>> Best, >>>> >>>> >>>> >>>> >>>> >>>> >>>> >>>> >>>> Pierre >>>> >>>> >>>> >>>> >>>> >>>> >>>> >>>> >>>> Pierre Bouvet, PhD >>>> >>>> >>>> >>>> >>>> Post-doctoral Fellow >>>> >>>> >>>> >>>> >>>> Medical University Vienna >>>> >>>> >>>> >>>> >>>> Department of Anatomy and Cell Biology >>>> >>>> >>>> >>>> >>>> Wahringer Straße 13, 1090 Wien, Austria >>>> >>>> >>>> >>>> >>>> >>>> >>>> >>>> >>>> >>>> >>>> >>>> >>>> >>>> >>>> >>>> >>>> >>>> >>>> >>>> >>>> >>>> >>>> >>>>> On 18/2/25, at 20:26, Carlo Bevilacqua <carlo.bevilacqua@embl.de <mailto:carlo.bevilacqua@embl.de>> wrote: >>>>> >>>>> >>>>> >>>>> >>>>> >>>>> >>>>> >>>>> >>>>> Hi Pierre, >>>>> >>>>> >>>>> >>>>> >>>>> >>>>> >>>>> >>>>> >>>>> regarding the structure of the file, I agree that we should keep it simple. I am not suggesting to make it more complex, rather to have a document where we define it in a clear and structured way rather than as a general description, to make sure that we are all on the same page. >>>>> >>>>> >>>>> >>>>> >>>>> I am saying this because, to be honest, I am not sure I fully understand how you are structuring the HDF5 and I think it is important to agree on this now, rather than finding at a later stage that we had different ideas. >>>>> >>>>> >>>>> >>>>> >>>>> >>>>> >>>>> >>>>> >>>>> Ideally if the GUI should be part of a single application, we should write it using a unified framework. >>>>> >>>>> >>>>> >>>>> >>>>> The reasons why, after considering it for a bit, I lean towards Dash rather than Qt are: >>>>> >>>>> >>>>> >>>>> >>>>> it can run in a web browser so it will be easy to eventually move it to a website, thus people can use it without installing it (which will hopefully help in promoting its use) >>>>> it is based on plotly <https://plotly.com/python/>which is a graphical library with very good plotting capabilites and highly customizable, that would make the data visualization easier/more appealing >>>>> Let me know what you think about it and if you see any advantage of Qt over a web app which I am not considering. Also, if we agree that Dash might be a better option, would you consider migrating to Dash? It might not be too much work if most of the code you wrote is for data processing rather that for the GUI itself and I could help you with that. Alternatively one workaround is to have a QtWebEngine <https://doc.qt.io/qtforpython-6/overviews/qtwebengine-overview.html> in your Qt app and have the Dash app run inside that, but that would make only the Dash part portable to a server later on. >>>>> >>>>> >>>>> >>>>> >>>>> >>>>> >>>>> >>>>> >>>>> Best, >>>>> >>>>> >>>>> >>>>> >>>>> Carlo >>>>> >>>>> >>>>> >>>>> >>>>> >>>>> >>>>> >>>>> >>>>> >>>>> >>>>> >>>>> On Tue, Feb 18, 2025 at 10:24, Pierre Bouvet <pierre.bouvet@meduniwien.ac.at <mailto:pierre.bouvet@meduniwien.ac.at>> wrote: >>>>> >>>>> >>>>> >>>>> >>>>>> Hi, >>>>>> >>>>>> >>>>>> >>>>>> >>>>>> >>>>>> >>>>>> >>>>>> >>>>>> Thanks, >>>>>> >>>>>> >>>>>> >>>>>> >>>>>> >>>>>> >>>>>> >>>>>> >>>>>> More than merge them later, just keep them separate in the process and rather than trying to build "one code to do it all", build one library and GUI that encapsulate codes to do everything. >>>>>> >>>>>> >>>>>> >>>>>> >>>>>> Having a structure is a must but it needs to be kept as simple as possible else we’ll rapidly find situations where we need to change the structure. The middle ground I think is to force the use of hierarchies and impose nomenclatures where problem are expected to appear: each dataset has its own group, each group can encapsulate other groups, each parameter of a group applies to all its sub-groups if the subgroup does not change its value, each array of a group applies to all of its sub-groups if the sub-group does not redefine an array with same name, the names of the groups are held as parameters and their ID are managed by the software. >>>>>> >>>>>> >>>>>> >>>>>> >>>>>> For the Plotly interface, I don’t know how to integrate it to Qt but if you find a way to do it, that’s perfect with me :) >>>>>> >>>>>> >>>>>> >>>>>> >>>>>> My vision of the GUI is something that unifies the format and can then execute scripts on the data stored in this format. I have pushed the application of the GUI to my data up to the point where I can do the whole information extraction process from it (add data, convert to PSD, fit curves). I think this could be super interesting if we implement it for all techniques. >>>>>> >>>>>> >>>>>> >>>>>> >>>>>> I think we could formalize the project in milestones, in particular define the minimal denominator that will allow us to have the paper. The milestone I reached for my spectro encompasses the following points: >>>>>> >>>>>> >>>>>> >>>>>> >>>>>> - Being able to add data to the file easily (by dragging & dropping to the GUI) >>>>>> >>>>>> >>>>>> >>>>>> >>>>>> - Being able to assign properties to these data easily (again by dragging & dropping) >>>>>> >>>>>> >>>>>> >>>>>> >>>>>> - Being able to structure the added data in groups/folders/containers/however we want to call it >>>>>> >>>>>> >>>>>> >>>>>> >>>>>> - Making it easy for new data types to be loaded >>>>>> >>>>>> >>>>>> >>>>>> >>>>>> - Allowing data from same type but different structure to be added (e.g. .dat files) >>>>>> >>>>>> >>>>>> >>>>>> >>>>>> - Execute scripts on the data easily and allowing parameters of these scripts to be defined from the GUI (e.g. select a peak on a curve to fit this peak) >>>>>> >>>>>> >>>>>> >>>>>> >>>>>> - Make it easy to add scripts for treating or extracting PSD from raw data. >>>>>> >>>>>> >>>>>> >>>>>> >>>>>> - Allow the export of a Python code to access the data from the file (we cans see them as “break points” in the treatment pipeline) >>>>>> >>>>>> >>>>>> >>>>>> >>>>>> - Edit of properties inside the GUI >>>>>> >>>>>> >>>>>> >>>>>> >>>>>> In any case I think we could build a spec sheet for the project with what we want to have in it based on what we want to advertise in the paper. We can always add things later on but if we agree on a strict minimum to have the project advertised, then that will set its first milestone on which we’ll be able to build later on. >>>>>> >>>>>> >>>>>> >>>>>> >>>>>> >>>>>> >>>>>> >>>>>> >>>>>> Best, >>>>>> >>>>>> >>>>>> >>>>>> >>>>>> >>>>>> >>>>>> >>>>>> >>>>>> Pierre >>>>>> >>>>>> >>>>>> >>>>>> >>>>>> >>>>>> >>>>>> >>>>>> >>>>>> >>>>>> >>>>>> >>>>>> >>>>>> Pierre Bouvet, PhD >>>>>> >>>>>> >>>>>> >>>>>> >>>>>> Post-doctoral Fellow >>>>>> >>>>>> >>>>>> >>>>>> >>>>>> Medical University Vienna >>>>>> >>>>>> >>>>>> >>>>>> >>>>>> Department of Anatomy and Cell Biology >>>>>> >>>>>> >>>>>> >>>>>> >>>>>> Wahringer Straße 13, 1090 Wien, Austria >>>>>> >>>>>> >>>>>> >>>>>> >>>>>> >>>>>> >>>>>> >>>>>> >>>>>> >>>>>> >>>>>> >>>>>> >>>>>> >>>>>> >>>>>> >>>>>> >>>>>> >>>>>> >>>>>> >>>>>> >>>>>> >>>>>> >>>>>> >>>>>>> On 17/2/25, at 14:53, Carlo Bevilacqua via Software <software@biobrillouin.org <mailto:software@biobrillouin.org>> wrote: >>>>>>> >>>>>>> >>>>>>> >>>>>>> >>>>>>> >>>>>>> >>>>>>> >>>>>>> >>>>>>> Hi Pierre, hi Sal, >>>>>>> >>>>>>> >>>>>>> >>>>>>> >>>>>>> thanks for sharing your thoughts about it. >>>>>>> >>>>>>> >>>>>>> >>>>>>> >>>>>>> @Pierre I am very sorry that Ren passed away :( >>>>>>> >>>>>>> >>>>>>> >>>>>>> >>>>>>> >>>>>>> >>>>>>> >>>>>>> >>>>>>> As far as I understood you are suggesting to work on the individual aspects separately and then merge them together at a later stage? I am fine with that but I still think it is very important to now agree on what should be in the file format we are defining, because that is kind of the core of the project and will affect a lot of the design choices. >>>>>>> >>>>>>> >>>>>>> >>>>>>> >>>>>>> >>>>>>> >>>>>>> >>>>>>> >>>>>>> I am happy to start working on the GUI for data visualization. In my idea, it will be something similar to this <https://www.nature.com/articles/s41592-023-02054-z/figures/10>but written in dash <https://dash.plotly.com/>, so it is a web app that for now can run locally (so no transfer of data to an external server is required) but in the future can easily be uploaded to a website that people can just use without installing anything on their computer. >>>>>>> >>>>>>> >>>>>>> >>>>>>> >>>>>>> The question is how much of the data processing should be possible to do (or trigger) from the same GUI? I think at least a drop down menu with different fitting functions should be there, so the user can quickly check the results on a spectrum from a specific point in the image. >>>>>>> >>>>>>> >>>>>>> >>>>>>> >>>>>>> @Pierre how are you envisioning the GUI you are working on? As far as I understood it is mainly to get the raw data and save it to our HDF5 format with some treatment on it. >>>>>>> >>>>>>> >>>>>>> >>>>>>> >>>>>>> One idea could be to have a shared list of features that we are implementing in the GUI as we work on it, to avoid having the same functionality duplicated (or worst inconsistent) between the GUI for generating our file format and the GUI for visualization. >>>>>>> >>>>>>> >>>>>>> >>>>>>> >>>>>>> >>>>>>> >>>>>>> >>>>>>> >>>>>>> Let me know what you think about it. >>>>>>> >>>>>>> >>>>>>> >>>>>>> >>>>>>> >>>>>>> >>>>>>> >>>>>>> >>>>>>> Best, >>>>>>> >>>>>>> >>>>>>> >>>>>>> >>>>>>> Carlo >>>>>>> >>>>>>> >>>>>>> >>>>>>> >>>>>>> >>>>>>> >>>>>>> On Mon, Feb 17, 2025 at 11:04, Pierre Bouvet via Software <software@biobrillouin.org <mailto:software@biobrillouin.org>> wrote: >>>>>>> >>>>>>> >>>>>>> >>>>>>> >>>>>>>> Hi everyone, >>>>>>>> >>>>>>>> >>>>>>>> >>>>>>>> >>>>>>>> >>>>>>>> >>>>>>>> >>>>>>>> >>>>>>>> Sorry for the delayed response, I just went through the loss of Ren (my dog) and wasn’t at all able to answer. >>>>>>>> >>>>>>>> >>>>>>>> >>>>>>>> >>>>>>>> First of, Sal, I am making progress and I should have everything you have made on your branch integrated to the GUI branch soon, at which point I will push everything to main. >>>>>>>> >>>>>>>> >>>>>>>> >>>>>>>> >>>>>>>> Regarding the project, I think I align with Sal: keep things as simple as possible. My approach was to divide everything in 3 mostly independent layers: >>>>>>>> >>>>>>>> >>>>>>>> >>>>>>>> >>>>>>>> - Store data in an organized file that anyone can use, and make it easy to do >>>>>>>> >>>>>>>> >>>>>>>> >>>>>>>> >>>>>>>> - Convert these data into something that has physical significance: a Power Spectrum Density >>>>>>>> >>>>>>>> >>>>>>>> >>>>>>>> >>>>>>>> - Extract information from this Power Spectrum Density >>>>>>>> >>>>>>>> >>>>>>>> >>>>>>>> >>>>>>>> Each layer has its own challenge but they are independent on the challenge of having people using it: personally, if I had someone come to me with a new software to play with my measures, I would most likely only look at it for 1 minute (or less depending who made it) with a lot of apprehension and then based on how simple it looks and how much I understood of it, use it or - what is most likely - discard it. This is why Project.pdf <https://github.com/bio-brillouin/HDF5_BLS/blob/GUI_development/guides/Projec...> is essentially meant to say: we put data arrays in groups and give them attributes written in text, but you can also create groups within groups to organize your data! >>>>>>>> >>>>>>>> >>>>>>>> >>>>>>>> >>>>>>>> I believe most of the people in the BioBrillouin society will have the same approach and before having something complex that can do a lot, I think it’s best to have something simple that can just unify the format (which in itself is a lot) and that people can use right away with a minimal impact on their own individual pipelines for data processing. >>>>>>>> >>>>>>>> >>>>>>>> >>>>>>>> >>>>>>>> To be honest, I don’t think people will blindly trust our software at first to treat their data, but they will most likely use it at first to organize their raw spectra, and maybe add their own treated data if they are feeling particularly adventurous. But that is not a problem as long as we start a movement. From there yes, we can complexity and create custom file architectures but that is already too complex I think for this first project. >>>>>>>> >>>>>>>> >>>>>>>> >>>>>>>> >>>>>>>> If we can all just import our data to the wrapper and specify their attributes, this will already be a success. Then for the paper, if we can all add a custom code to treat these data to obtain a PSD, I think this will be enough. As I said, the current API already allows you to add your data in a variety of format, so it’s just a question of developing the PSD conversion before having something we can publish (and then tell people to use). >>>>>>>> >>>>>>>> >>>>>>>> >>>>>>>> >>>>>>>> >>>>>>>> >>>>>>>> >>>>>>>> >>>>>>>> A few extra points: >>>>>>>> >>>>>>>> >>>>>>>> >>>>>>>> >>>>>>>> - Working with my setup, I realized if the user could choose between different algorithms to treat their own data, it would make the overall project much more usable (if an algorithm bugs for whatever reason, you can use another one) so I created 2 bottle necks in the form of functions (for PSD conversion and treatment) that would inspect modules dedicated to either PSD conversion or treatment, and list existing functions. It’s in between classical and modular programming but it makes the development of new PSD conversion code and treatment way way easier >>>>>>>> >>>>>>>> >>>>>>>> >>>>>>>> >>>>>>>> - The GUI is developed using oriented-object programming. Therefore I have already made some low-level choices that kind of impact all the GUI. I’m not saying they are the best choices, I’m just saying that they work, so if you want to work on the GUI, I would either recommend getting familiar with these choices, or making sure that all the functionalities are preserved, particularly the ones that are invisible (logging of treatment steps, treatment errors…) >>>>>>>> >>>>>>>> >>>>>>>> >>>>>>>> >>>>>>>> >>>>>>>> >>>>>>>> >>>>>>>> >>>>>>>> I’ll try merging the branches on Git asap and will definitely send you all an email when it’s done :) >>>>>>>> >>>>>>>> >>>>>>>> >>>>>>>> >>>>>>>> >>>>>>>> >>>>>>>> >>>>>>>> >>>>>>>> Best, >>>>>>>> >>>>>>>> >>>>>>>> >>>>>>>> >>>>>>>> >>>>>>>> >>>>>>>> >>>>>>>> >>>>>>>> Pierre >>>>>>>> >>>>>>>> >>>>>>>> >>>>>>>> >>>>>>>> >>>>>>>> >>>>>>>> >>>>>>>> >>>>>>>> Pierre Bouvet, PhD >>>>>>>> >>>>>>>> >>>>>>>> >>>>>>>> >>>>>>>> Post-doctoral Fellow >>>>>>>> >>>>>>>> >>>>>>>> >>>>>>>> >>>>>>>> Medical University Vienna >>>>>>>> >>>>>>>> >>>>>>>> >>>>>>>> >>>>>>>> Department of Anatomy and Cell Biology >>>>>>>> >>>>>>>> >>>>>>>> >>>>>>>> >>>>>>>> Wahringer Straße 13, 1090 Wien, Austria >>>>>>>> >>>>>>>> >>>>>>>> >>>>>>>> >>>>>>>> >>>>>>>> >>>>>>>> >>>>>>>> >>>>>>>> >>>>>>>> >>>>>>>> >>>>>>>> >>>>>>>> >>>>>>>> >>>>>>>> >>>>>>>> >>>>>>>> >>>>>>>> >>>>>>>> >>>>>>>> >>>>>>>> >>>>>>>> >>>>>>>> >>>>>>>>> On 14/2/25, at 19:36, Sal La Cavera Iii via Software <software@biobrillouin.org <mailto:software@biobrillouin.org>> wrote: >>>>>>>>> >>>>>>>>> >>>>>>>>> >>>>>>>>> >>>>>>>>> >>>>>>>>> >>>>>>>>> >>>>>>>>> >>>>>>>>> Hi all, >>>>>>>>> >>>>>>>>> >>>>>>>>> >>>>>>>>> >>>>>>>>> >>>>>>>>> >>>>>>>>> >>>>>>>>> >>>>>>>>> I agree with the things enumerated and points made by Kareem/Carlo! I guess I would advocate for starting from a position of simplicity. We probably don't want to get weighed down by trying to include a bunch of bells and whistles from the start as these can be easily added once there is a minimally viable stable product. >>>>>>>>> >>>>>>>>> >>>>>>>>> >>>>>>>>> >>>>>>>>> >>>>>>>>> >>>>>>>>> >>>>>>>>> >>>>>>>>> As long as data can be loaded to local memory, then treated in various (initially simple) ways through the GUI (and maybe maintain non-GUI compatibility for command-line warriors like myself), then the bh5 formatting stuff can be sorted on the back end? I definitely agree with Carlo's structure set out in the file format document; but all of that data will be floating around the memory in some shape or form and just needs to be wrapped up and packaged (according to Carlo's structure e.g.) when the user is happy and presses the "generate h5 filestore" etc. (?) >>>>>>>>> >>>>>>>>> >>>>>>>>> >>>>>>>>> >>>>>>>>> >>>>>>>>> >>>>>>>>> >>>>>>>>> >>>>>>>>> Definitely agree with the recommendation to create the alpha using mainly requirements that our 3 labs would find useful (import filetypes, treatments, etc), and then we can add on more universal functionality second / get some beta testers in from other labs etc. >>>>>>>>> >>>>>>>>> >>>>>>>>> >>>>>>>>> >>>>>>>>> >>>>>>>>> >>>>>>>>> >>>>>>>>> >>>>>>>>> I'm able to support on whatever jobs need doing and am free to meet in the beginning of March like you mentioned Kareem. >>>>>>>>> >>>>>>>>> >>>>>>>>> >>>>>>>>> >>>>>>>>> >>>>>>>>> >>>>>>>>> >>>>>>>>> >>>>>>>>> Hope you guys have a nice weekend, >>>>>>>>> >>>>>>>>> >>>>>>>>> >>>>>>>>> >>>>>>>>> >>>>>>>>> >>>>>>>>> >>>>>>>>> >>>>>>>>> Cheers, >>>>>>>>> >>>>>>>>> >>>>>>>>> >>>>>>>>> >>>>>>>>> >>>>>>>>> >>>>>>>>> >>>>>>>>> >>>>>>>>> Sal >>>>>>>>> >>>>>>>>> >>>>>>>>> >>>>>>>>> >>>>>>>>> >>>>>>>>> >>>>>>>>> >>>>>>>>> >>>>>>>>> --------------------------------------------------------------- >>>>>>>>> >>>>>>>>> >>>>>>>>> >>>>>>>>> >>>>>>>>> Salvatore La Cavera III >>>>>>>>> >>>>>>>>> >>>>>>>>> Royal Academy of Engineering Research Fellow >>>>>>>>> >>>>>>>>> >>>>>>>>> Nottingham Research Fellow >>>>>>>>> >>>>>>>>> >>>>>>>>> Optics and Photonics Group >>>>>>>>> >>>>>>>>> >>>>>>>>> University of Nottingham >>>>>>>>> Email: salvatore.lacaveraiii@nottingham.ac.uk <mailto:salvatore.lacaveraiii@nottingham.ac.uk> >>>>>>>>> ORCID iD: 0000-0003-0210-3102 >>>>>>>>> >>>>>>>>> >>>>>>>>> >>>>>>>>> >>>>>>>>> <Outlook-tygjxucs.png> <https://outlook.office.com/bookwithme/user/6a3f960a8e89429cb6fc693c01d10119@...> >>>>>>>>> >>>>>>>>> >>>>>>>>> >>>>>>>>> Book a Coffee and Research chat with me! >>>>>>>>> >>>>>>>>> >>>>>>>>> >>>>>>>>> >>>>>>>>> From: Carlo Bevilacqua via Software <software@biobrillouin.org <mailto:software@biobrillouin.org>> >>>>>>>>> Sent: 12 February 2025 13:31 >>>>>>>>> To: Kareem Elsayad <kareem.elsayad@meduniwien.ac.at <mailto:kareem.elsayad@meduniwien.ac.at>> >>>>>>>>> Cc: sebastian.hambura@embl.de <mailto:sebastian.hambura@embl.de> <sebastian.hambura@embl.de <mailto:sebastian.hambura@embl.de>>; software@biobrillouin.org <mailto:software@biobrillouin.org> <software@biobrillouin.org <mailto:software@biobrillouin.org>> >>>>>>>>> Subject: [Software] Re: Software manuscript / BLS microscopy >>>>>>>>> >>>>>>>>> >>>>>>>>> >>>>>>>>> >>>>>>>>> >>>>>>>>> >>>>>>>>> >>>>>>>>> >>>>>>>>> >>>>>>>>> You don't often get email from software@biobrillouin.org <mailto:software@biobrillouin.org>. Learn why this is important <https://aka.ms/LearnAboutSenderIdentification> >>>>>>>>> >>>>>>>>> >>>>>>>>> >>>>>>>>> Hi Kareem, >>>>>>>>> >>>>>>>>> >>>>>>>>> >>>>>>>>> >>>>>>>>> thanks for restarting this and sorry for my silence, I just came back from US and was planning to start working on this again. >>>>>>>>> >>>>>>>>> >>>>>>>>> >>>>>>>>> >>>>>>>>> Could you also add Sebastian (in CC) to the mailing list? >>>>>>>>> >>>>>>>>> >>>>>>>>> >>>>>>>>> >>>>>>>>> >>>>>>>>> >>>>>>>>> >>>>>>>>> >>>>>>>>> As you outlined, I would split the project into two parts: 1) getting from the raw data to some standard "processed' spectra and 2) do data analysis/visualization on that. For the second part the way I envision it is: >>>>>>>>> >>>>>>>>> >>>>>>>>> >>>>>>>>> >>>>>>>>> the most updated definition of the file format from Pierre is this one <https://github.com/bio-brillouin/HDF5_BLS/blob/GUI_development/guides/Projec...>, correct? In addition to this document I think it would be good to have a more structured description of the file (like this <https://github.com/prevedel-lab/Brillouin-standard-file/blob/main/docs/Bh5_f...>), where each field is clearly defined in terms of data type and dimensions. Sebastian was also suggesting that the document should contain the reasoning behind each specific choice in the specs and also things that we considered but decided had some issues (so in future we can look back at it). I still believe that the file format should contain the "processed" spectra (i.e. after FT and baseline subtraction for impulsive, or after taking a line profile and possibly linearization with VIPA,...) so we can apply standard data processing or visualization which is independent on the actual underlaying technique (e.g. VIPA, FP, stimulated, time domain, ...) >>>>>>>>> agree on an API to read the data from our file format (most likely a Python class). For that we should: 1) decide on which information is important to extract (spectral information, spatial coordinates, hyper-parameters, metadata,...) 2) implement an interface to read the data (e.g. readSpectrumAtIndex(...), readImage(...), ...) >>>>>>>>> build a GUI that use the previously defined API to show and process the data. >>>>>>>>> I would say that, once we have a very solid description of the file format as in step 1, step 2 will come naturally and we can divide the actual implementation between us. Step 3 can also easily be implemented and divided between us once we have an API (and I am happy to work on the GUI myself). >>>>>>>>> >>>>>>>>> >>>>>>>>> >>>>>>>>> >>>>>>>>> >>>>>>>>> >>>>>>>>> >>>>>>>>> >>>>>>>>> The first half of the project is the trickiest and I know Pierre has already done a lot of work in that direction. We should definitely agree on which extent we can define a standard to store the raw data, given the variability between labs, (and probably we should do it for common techniques like FP or VIPA) and how to implement the treatments, leaving to possibility to load some custom code in the pipeline to do the conversion. >>>>>>>>> >>>>>>>>> >>>>>>>>> >>>>>>>>> >>>>>>>>> >>>>>>>>> >>>>>>>>> >>>>>>>>> >>>>>>>>> Let me know what you all think about this. >>>>>>>>> >>>>>>>>> >>>>>>>>> >>>>>>>>> >>>>>>>>> If you agree I would start by making a document which clearly defines the file format in a structured way (as in my step 1 before). @Pierre could you write a new document or modify the document I originally made <https://github.com/prevedel-lab/Brillouin-standard-file/blob/main/docs/Bh5_f...> to reflect the latest structure you implemented for the file format? The metadata can still be defined in a separated excel sheet, as long as the data type and format is well defined there. >>>>>>>>> >>>>>>>>> >>>>>>>>> >>>>>>>>> >>>>>>>>> >>>>>>>>> >>>>>>>>> >>>>>>>>> >>>>>>>>> Best regards, >>>>>>>>> >>>>>>>>> >>>>>>>>> >>>>>>>>> >>>>>>>>> Carlo >>>>>>>>> >>>>>>>>> >>>>>>>>> >>>>>>>>> >>>>>>>>> >>>>>>>>> >>>>>>>>> On Wed, Feb 12, 2025 at 02:19, Kareem Elsayad via Software <software@biobrillouin.org <mailto:software@biobrillouin.org>> wrote: >>>>>>>>> >>>>>>>>> >>>>>>>>> >>>>>>>>> >>>>>>>>>> Hi Robert, Carlo, Sal, Pierre, >>>>>>>>>> >>>>>>>>>> >>>>>>>>>> >>>>>>>>>> >>>>>>>>>> >>>>>>>>>> Think it would be good to follow up on software project. Pierre has made some progress here and would be good to try and define tasks a little bit clearer to make progress… >>>>>>>>>> >>>>>>>>>> >>>>>>>>>> >>>>>>>>>> >>>>>>>>>> >>>>>>>>>> There is always the potential issue of having “too many cooks in the kitchen” (that have different recipes for same thing) to move forward efficiently, something that I noticed can get quite confusing/frustrating when writing software together with people. So would be good to clearly assign tasks. I talked to Pierre today and he would be happy to integrate things in framework we have to try tie things together. What would foremost be needed would be ways of treating data, meaning code that takes a raw spectral image and meta-data and converts it into “standard” format (spectral representation) that can then be fitted. Then also “plugins” that serve a specific purpose in the analysis/rendering that can be included in framework. >>>>>>>>>> >>>>>>>>>> >>>>>>>>>> >>>>>>>>>> >>>>>>>>>> >>>>>>>>>> The way I see it (and please comment if you see differently), there are ~4 steps here: >>>>>>>>>> >>>>>>>>>> >>>>>>>>>> >>>>>>>>>> >>>>>>>>>> >>>>>>>>>> >>>>>>>>>> >>>>>>>>>> >>>>>>>>>> Take raw data (in .tif,, .dat, txt, etc. format) and meta data (in .cvs, xlsx, .dat, .txt, etc.) and render a standard spectral presentation. Also take provided instrument response in one of these formats and extract key parameters from this >>>>>>>>>> Fit the data with drop-down menu list of functions, that will include different functional dependences and functions corrected for instrument response. >>>>>>>>>> Generate/display a visual representation of results (frequency shift(s) and linewidth(s)), that is ideally interactive to some extent (and maybe has some funky features like looking at spectra at different points. These can be spatial maps and/or evolution with some other parameter (time, temperature, angle, etc.). Also be able to display maps of relative peak intensities in case of multiple peak fits, and whatever else useful you can think of. >>>>>>>>>> Extract “mechanical” parameters given assigned refractive indices and densities >>>>>>>>>> >>>>>>>>>> >>>>>>>>>> >>>>>>>>>> I think the idea of fitting modified functions (e.g. corrected based on instrument response) vs. deconvolving spectra makes more sense (as can account for more complex corrections due to non-optical anomalies in future –ultimately even functional variations in vicinity of e.g. phase transitions). It is also less error prone, as systematically doing decon with non-ideal registration data can really throw you off the cliff, so to speak. >>>>>>>>>> >>>>>>>>>> >>>>>>>>>> >>>>>>>>>> >>>>>>>>>> >>>>>>>>>> My understanding is that we kind of agreed on initial meta-data reporting format. Getting from 1 to 2 will no doubt be most challenging as it is very instrument specific. So instructions will need to be written for different BLS implementations. >>>>>>>>>> >>>>>>>>>> >>>>>>>>>> >>>>>>>>>> >>>>>>>>>> >>>>>>>>>> This is a huge project if we want it to be all inclusive.. so I would suggest to focus on making it work for just a couple of modalities first would be good (e.g. crossed VIPA, time-resolved, anisotropy, and maybe some time or temperature course of one of these). Extensions should then be more easy to navigate. At one point think would be good to involve SBS specific considerations also. >>>>>>>>>> >>>>>>>>>> >>>>>>>>>> >>>>>>>>>> >>>>>>>>>> >>>>>>>>>> Think would be good to discuss a while per email to gather thoughts and opinions (and already start to share codes), and then plan a meeting beginning of March -- how does first week of March look for everyone? >>>>>>>>>> >>>>>>>>>> >>>>>>>>>> >>>>>>>>>> >>>>>>>>>> >>>>>>>>>> I created this mailing list (software@biobrillouin.org <mailto:software@biobrillouin.org>) we can use for discussion. You should all be able to post to (and it makes it easier if we bring anyone else in along the way). >>>>>>>>>> >>>>>>>>>> >>>>>>>>>> At moment on this mailing list is Robert, Carlo, Sal, Pierre and myself. Let me know if I should add anyone. >>>>>>>>>> >>>>>>>>>> >>>>>>>>>> >>>>>>>>>> >>>>>>>>>> >>>>>>>>>> All the best, >>>>>>>>>> >>>>>>>>>> >>>>>>>>>> Kareem >>>>>>>>>> >>>>>>>>>> >>>>>>>>>> >>>>>>>>>> >>>>>>>>>> >>>>>>>>>> >>>>>>>>>> >>>>>>>>>> >>>>>>>>>> >>>>>>>>>> >>>>>>>>>> >>>>>>>>> >>>>>>>>> This message and any attachment are intended solely for the addressee and may contain confidential information. If you have received this message in error, please contact the sender and delete the email and attachment. Any views or opinions expressed by the author of this email do not necessarily reflect the views of the University of Nottingham. Email communications with the University of Nottingham may be monitored where permitted by law. _______________________________________________ >>>>>>>>> Software mailing list -- software@biobrillouin.org <mailto:software@biobrillouin.org> >>>>>>>>> To unsubscribe send an email to software-leave@biobrillouin.org <mailto:software-leave@biobrillouin.org> >>>>>>>>> >>>>>>>>> >>>>>>>>> >>>>>>>> >>>>>>>> >>>>>>>> >>>>>>>> >>>>>>>> >>>>>>> >>>>>>> _______________________________________________ >>>>>>> Software mailing list -- software@biobrillouin.org <mailto:software@biobrillouin.org> >>>>>>> To unsubscribe send an email to software-leave@biobrillouin.org <mailto:software-leave@biobrillouin.org> >>>>>>> >>>>>>> >>>>>>> >>>>>> >>>>>> >>>>>> >>>>>> >>>>>> >>>> >>>> >>>> >>>> >>>> >> >> >> >> >> > > _______________________________________________ Software mailing list -- software@biobrillouin.org <mailto:software@biobrillouin.org> To unsubscribe send an email to software-leave@biobrillouin.org <mailto:software-leave@biobrillouin.org> > > >
_______________________________________________ Software mailing list -- software@biobrillouin.org <mailto:software@biobrillouin.org> To unsubscribe send an email to software-leave@biobrillouin.org <mailto:software-leave@biobrillouin.org>
_______________________________________________ Software mailing list -- software@biobrillouin.org <mailto:software@biobrillouin.org> To unsubscribe send an email to software-leave@biobrillouin.org <mailto:software-leave@biobrillouin.org>
_______________________________________________ Software mailing list -- software@biobrillouin.org <mailto:software@biobrillouin.org> To unsubscribe send an email to software-leave@biobrillouin.org <mailto:software-leave@biobrillouin.org>
_______________________________________________ Software mailing list -- software@biobrillouin.org To unsubscribe send an email to software-leave@biobrillouin.org
Hi all, I made a file describing the file format, you can find it here (https://github.com/bio-brillouin/HDF5_BLS/blob/main/Bh5_file_spec.md). I think that attributes are easy to add and names of groups/datasets can be changed (if they are unclear now), so these are details that we don't need to discuss now. What I find most important to agree on now is the general structure. In that sense that are still some points under discussion between me and Pierre, but hopefully we can iron them out during the meeting. Talk to you in a bit, Carlo On Wed, Feb 26, 2025 at 23:56, Kareem Elsayad wrote: Hi Carlo, Sounds great! Yes, Fri 28th @3pm still works for me. If it works for others, here is Zoom we can use: https://us02web.zoom.us/j/5191046969?pwd=alpzaldoZEd3N2ZEQ0hYZU1RR1dOdz09 (https://us02web.zoom.us/j/5191046969?pwd=alpzaldoZEd3N2ZEQ0hYZU1RR1dOdz09) Meeting ID: 519 104 6969 Passcode: jY3zH8 All the best, kareem From: Carlo Bevilacqua via Software Reply to: Carlo Bevilacqua Date: Wednesday, 26. February 2025 at 20:43 To: Kareem Elsayad Cc: "software@biobrillouin.org (mailto:software@biobrillouin.org)" Subject: [Software] Re: [EXTERN] Re: Software manuscript / BLS microscopy Hi Kareem, thank you for your email. We are discussing with Pierre about the details of the file format and hopefully by our next meeting we will have agreed on a file format and we can divide the tasks. If it is still an option, Friday 28th at 3pm works for me. Best regards, Carlo On Mon, Feb 24, 2025 at 03:17, Kareem Elsayad wrote: Dear All, I (and Robert) were hoping there would be some consensus on this h5 file format. Let us do a Zoom on Fri 28th Feb at 15:00? A couple of points pertaining to arguments… Firstly, the precise structure is not worth getting into big arguments or fuss about…as long as it contains all the information needed for the analysis/representation, and all parties can work with (able to write and read knowing what is what), it ultimately doesn’t matter. In my opinion better put more (optional) stuff in if that is issue, and make it as inclusive as possible. In the end this does not need to be read by analysis/representation side, and when we go through we can decide if and what needs to be stripped. It is after all the “black box” between doing the experiment and having your final plots/images. Take a look at say a Zeiss file and try figure all that’s in it (it is not ideally structured maybe, but no biologist ever cared) – that said, I am sure their team had very similar arguments concerning structure etc.! (you have as many opinions as people). Maybe the issue is that the boundary conditions were not as well defined, but I would say at this point make them more inclusive than they need to be (empty spaces cost little memory) Secondly, and following on from firstly. We need to simply agree and compromise to make any progress asap. Rather than building separate structures we need to add/modify a single existing structure or we might as well be working on independent projects. Carlo’s initially proposed structure seemed reasonable, maybe with some minor changes, and we should just go with that as a basis in my opinion. I would suggest that Pierre and Carlo have a Zoom together and try and come up with something that is acceptable to both. Like everything in life, this will involve making compromises. And then present it on 28th Feb. Quite simply, if there is no agreement we cannot do this project and in the end it doesn’t matter who is right or wrong. Finally, I hope the disagreements from both sides are not seen as negative or personal attacks –it is ok to disagree (that’s why we have so many meetings!) On the plus side we are still more effective than the Austrian government (that is still deciding who should be next prime minister like half a year after elections) 😊 All the best, Kareem From: Pierre Bouvet via Software Reply to: Pierre Bouvet Date: Friday, 21. February 2025 at 11:55 To: Carlo Bevilacqua Cc: Subject: [Software] Re: [EXTERN] Re: Software manuscript / BLS microscopy Hi Carlo, Thanks for your reply, here is the next pong of this ping pong series ^^ 1- I was talking indeed about the enums, but also the parameters that are defined as integers or floating point numbers and uint32. I think its easier (and that we already agreed on) having a spreadsheet with the parameters (easy to use, easy to update, easy to store and modify between two experiments using the same setup, allows to impose fixed choices for some parameters with drop-down lists, allows to detail the requirements for the attribute like its format or units and allows examples) and to just import it in the HDF5 file. From there it’s easier to have every attribute as strings both for the import and for the concept of what an attribute is. 2- OK 3- The problem is not necessarily the number of experiments you put in the file but the number of hyper parameters you want to take into account. Let’s take an example with a doubtable sense: I want to study the effect of low-frequency temperature fluctuations on micro mechanics in active samples both eukaryote and prokaryote showing a layered structure (endothelial cells arranged in epidermis, biofilms, …) with different cell types, and as a function of aging. I would then create a file with a first range of groups for the age of the sample, then inside these groups 2 groups for eukaryote and prokaryote samples, then inside these groups N groups for the samples I’m looking at, then inside these groups M groups for the temperature fluctuations I impose, then inside these groups the individual measures I make (this is fictional, I’m scared just to think at the amount of work to have all the samples, let alone measure them), this is simply not possible with your approach I think, and even simpler experiments like to measure the Allan variance on an instrument using 2 samples is not possible with your structure I think. 4- / 5- I think the real question is what we expect to get from a wrapper: for me is to wrap the measures of a given study, to then share, link to papers, treat using new approaches… Having a structure that can wrap both a full study and an experiment is in my opinion better in the long run than forcing the format to be used with only one experiment. 6- Yes, I understand it is an identifier, but why an integer? Why not a tuple? Why not a hash? And what if there’s a bug and instead of 3 you store you store 3.0, or 2, or ‘e'? Do you imagine the amount of work to understand where this bug comes from? Assuming it’s a bug because it might very well be just an inexperienced user making a mistake and then your file is broken. The idea is good but the safer way to have this is to work with nD arrays where the dimensionality is conserved I think, or just have all the information in the same group. 7- Here again, it’s more useful for your application but many people don’t use maps, so why force them to have even an empty array for that? Plus if they need to have a dedicated array for the concentration of crosslinkers (for example), they are faced with a non-trivial solution, which means they won’t use the format. 8- Yes, we could add an additional layer, but then it means that if you don’t need it, your datasets are in plain in the group and if you need it, then you don’t have the same structure. The solution I think is to already have the treated data in a group, if you don’t need more than one group (which will be most of the time the case) then you’ll only have one group of treated data. 9- I think it’s not useful. The SNR on the other hand is useful, because in shot-noise regime it’s a marker of variance, and this is one of the ways to spot outliers from treatment (if the SNR doesn’t match the returned standard deviation on the shift of one peak, there’s a problem somewhere). 10- The std of a fit is obtained by taking the square root of the diagonalized covariant matrix returned by the fit as long as your parameters are independent (it’s super interesting actually and a little bit more complicated but it’s true enough for lorentzian, DHO, Gaussian...) 11- OK but then why not have the calibration curves placed with your measures if they are only applicable to this measure? Once again, I think having indexes that are modifiable by the user is not safe (the technical term is “idiot proof”) 12- I don’t agree, if you are capturing points at a fixed interval, then you can reconstruct the timestamp from the timestamp of the first acquisition and either the delay between two acquisitions or the timestamp of the last acquisition. Most of the time however we don’t even need this as we consider the sample to be time-invariant on the scale of our measure, so a single timestamp for all the measure is enough and is better stored as an attribute. In the special case where we are not time-invariant, then time becomes the abscissa of the measures and in that case yes, it can be a dataset, but then it’s better to not impose a fixed name for this dataset and rather let the user decide what hyper parameter is changed during he’s measure, this way the user is free to use whatever hyper parameters he feels like it. 13- OK 14- Still not clear to me. My approach is to consider an experiment to be a measure of a sample as function of one or more controlled or measured hyper parameter. So my general approach for storing experiments is have 3 files: abscissa (with the hyper parameters that vary), measure and metadata, which translates to “Raw_data”, “Abscissa_i” and attributes for this format. 15- OK, I think more than brainstorming about how to treat correctly a VIPA spectrum, we need to allow people to tell how they do it if we want this project to be used in short term, unification is a goal of this project and we will advertise it in the paper, but to be honest, I doubt people like Giuliano will run with it without second guessing it, particularly with its clinical setups, so there will be some going back and forth before we have something stable, and this means we need to allow for this back and forth to appear somewhere, I propose having it as a parameter. 16- Here I think you allow too much liberty, changing the frequency of an array to GHz is trivial and I think most people do use GHz as the unit of their frequency arrays anyway. We need to make it clear that the frequency axis is in GHz but I think we don’t need a full element for this. If you really want to specify the unit of the Frequency dataset, I would suggest putting it in its attributes in any case, and not as another element in the structure. 17- OK 18- I think it’s one way to do it but it is not intuitive: I won’t have the reflex to go check in the attributes if there is a parameter “sam_as” to see if the calibration applies to all the curves. The way I would expect it to be is using the hierarchical logic of the format: if I’m looking at a dataset in a sub-group of a group containing a calibration dataset, then I know this calibration applies to my data: Data |- Data_0 (group) | |- Calibration (dataset) | |- Data_0 (group) | | |- Raw_data (dataset) | |- Data_1 (group) | | |- Raw_data (dataset) |- Data_1 (group) | |- Calibration (dataset) | |- Data_0 (group) | | |- Raw_data (dataset) I think in this example most people would suppose Data/Data_0/Calibration applies both to Data/Data_0/Data_0/Raw_data and Data/Data_0/Data_1/Raw_data but not Data/Data_1/Data_0/Raw_data whose calibration is intuitively Data/Data_1/Calibration Once again, my approach of the structure is trying to make it intuitive and most of all, simple. For instance if I place myself in the position of someone that is willing to try “just to see how it works”, I would give myself 10s to understand how I could have a file for only one measure that complies with the new (hope to be) standard. It is my opinion as I already told you before, that your approach is too complete and therefore complex, which will inevitably lead to people not using the format unless there’s a GUI to do it for them (and even then they might not use it). I don’t want to impose my vision here, and like you I have put a lot of thinking (and testing) into building the format I propose, but I’m convinced that if we go with your structure, not only will it make it hard for anyone to understand how to use it but we’ll have problems using it ourselves. I want to repeat that I don’t have the solution, I’m just confident that my approach is much easier to conceptually understand and less restrictive than yours. In any case we can agree to disagree on that, but then it’ll be good to have an alternative backend like the one I did with your format to try and use it, and see if indeed it’s better, because if it’s not and people don’t use it, I don’t want to go back to all the trouble I had building the library, docs and GUI just to try. I don’t want to impose you anything but it would be awesome if you took the time to read the document I made and completed for you yesterday. Then you can just tell me where you think I’m missing something and you had a better solution because as you might see, I’m having problems with nearly all your structure and we can’t really use it as a starting point at this stage since most of the backend is written and the front-end is already functional for my setup (and soon Sal’s and the TFP). Best, Pierre Pierre Bouvet, PhD Post-doctoral Fellow Medical University Vienna Department of Anatomy and Cell Biology Wahringer Straße 13, 1090 Wien, Austria On 20/2/25, at 22:55, Carlo Bevilacqua wrote: Hi Pierre, thank you for your feedback. I appreciate that you took the time to go through my definition and highlighting the critical points. I much prefer this rather than starting working with a file format where problem might arise in the future. If we understand what are the reasons behind our choices in the definition we can merge the best of the two approaches, rather than defining two "standards" for the same thing with each of them having their limitations. I will provide an answer to each of the points you raised (I gave numbers to the points in your email below, so it is easier to reference): * I am not sure to which attribute you are referring specifically, but I am completely fine with text; I defined enums where I felt it makes sense to do so because there is a discrete number of options (one could always add elements at the end of an enum) * I defined the attributes before we started working together and I am very much open to changing them so they reflect what you have in the spreadsheet; in the document defining the file format we can just state that the attributes and their type are defined in the excel sheet * I did it this way because in my idea an individual HDF5 file corresponds to a single experiment. If you feel there is an advantage in keeping different experiments in the same file I am open to introduce your structure of subgroups; I honestly feel like this will only make the file unnecessarly large and different experiments would mostly not share much (apart from the metadata, which is anyway a small overhead in terms of filesize). Now of course the question is what you define as an 'experiment': for me different timepoints or measurements at different temperatures/angles/etc on the same sample are a single experiment and I defined the file so that it is possible to save them in a single file; measurements on different samples are not the same experiment in my original idea * same as the point 3 * same as before, I would put different samples in different files but happy to introduce your structure if you feel there is an advantage * the index is used to uniquely identify an entry in the 'Analysed_data' table; it is important in the contest of reconstructing the image (see the definition of the 'tn/image' group) * in my opinion spatial coordinates have a privileged role since we are doing imaging and having them well defined it is important to reconstruct the image; for different abscissas I defined the 'parameters' dataset (more in point 14). If one is not doing imaging this dataset can be set to an empty array or a single element (we can include this in the definition) * in my idea the "Analyzed_data" group doesn't contain multiple treatments but the result of the fit on the 'final' spectra, which are unique; if you are referring to the 'n' in the 'Shift_n_GHz' that is included in case a multipeak fit is performed. Now, if we want to include the possibility of multiple treatments like you are doing (which I didn't originally consider) we could just add an additional layer to the hierarchy * that is the amplitude of the peak from the fit. I am not sure if you didn't understand what I meant or you think it is not an useful information * The fit error actually contains 2 quantities: R2 and RMSE (as defined in the type). I am not sure how you would calculate a std from a single spectrum * the calibration curves are stored in the 'calibration_spectra' group with the name of the dataset matching the respective 'Calibration_index'. In our VIPA setup we are acquiring multiple calibration curves during a single acquisition to compensate for laser drift, that's why I introduced the possibility of having multiple calibration curves. Note that the 'Calibration_index' is defined as optional exactly because it might not be needed * each spectrum can have its own timestamp if it is acquired from a different camera image or scan of a FP, etc that's why it needs to be a dataset. Note that it is an optional dataset * good point, we can rename it to PSD * that is exactly to account for the general case of the abscissa not being a spatial coordinate and it contains the values for the parameters (e.g. the angles in an angle resolved measurement). It is a dataset whose dimensions are defined in the description (happy to elaborate more if it is not clear) * float is the type of each element; it is a dataset whose dimensions are defined in the description; the way to define the frequency axis in general for setups which don't have an absolute frequency (like VIPAs) is tricky and would be good to brainstorm about possibile solutions * as for the name we can change it, but the problem on how to deal with the situation when one doesn't have the frequency in GHz remains. My idea here was to leave the possibility of different units because the fit and most of the data analysis can be performed even if the x-axis is not in GHz and the actual conversion of the shift to GHz can be done at the end and requires the calibration data. As in my previous point, I am happy to brainstorm different solutions to this problem * it is indeed redundant with 'Analyzed_data' and I pushed a change on GitHub to correct this * see point 11; also note that the group is optional (in case people don't need it) and I introduced the attribute "same_as" to avoid repeating it multiple times if it is always the same for all the 'tn' As you see we agree with some of the points or we could find a common solution, for others it was mainly a misunderstanding on what were my intentions (probably my bad in expressing them, but you could have asked if it was not clear). Hope this helps claryfing my reasoning in the file definition and I am happy to discuss all the open points. I will look in details at your newest definition that you shared in the next days. Best, Carlo On Thu, Feb 20, 2025 at 18:25, Pierre Bouvet via Software wrote: Hi, My goal with this project is to unify the treatment of BLS spectra, to then allow us to address fundamental biophysical questions with BLS as a community in the mid-long term. Therefore my principal concern for this format is simplicity: measure are datasets called “Raw_data”, if they need one or more abscissa to be understood, this/these abscissa are called “Abscissa_i” and they are placed in groups called “Data_i” where we can store their attributes in the group’s attributes. From there, I can put groups in groups to store an experiment with different ... (e.g. : samples, time points, positions, techniques, wavelengths, patients, …). This structure is trivial but lacks usability so I added an attribute called “Name” to all groups that the user can define as he wants without impacting the structure. Now here are a few critics on Carlo’s approach. I didn’t want to share them because I hate criticizing anyone’s work, and I do think that what Carlo presented is great, but I don’t want you to think that I just trashed what he did, to the contrary, it’s because I see limitations in his approach that I tried developing another, simpler one. So here are the points I have problems with in Carlo’s approach: * The preferred type of the information on an experiment should be text as we’ll likely see new devices (like your super nice FT approach) appear in the next months/years that will require new parameters to be defined to describe them. I think we should really try not to use anything else than strings in the attributes. * The experiment information should not be defined by the HDF5 file structure but rather by a spreadsheet because everyone knows how to use Excel, and it’s way easier to edit an Excel file than an HDF5 file. * Experiment information should apply to measures and not to files, because they might vary from experiment to experiment, I think their preferred allocation is thus the attributes of the groups storing individual measures (in my approach) * The characterization of the instrument might also be experiment-dependent (if for some reason you change the tilt of a VIPA during the experiment for example), therefore having a dedicated group for it might not work for some experiments * The groups are named “tn” and the structure does not present the nomenclature of sub-groups, this is a big problem if we want to store in the same format say different samples measured at different times (the logic patch would be to have sub-groups follow the same structure so tn/tm/tl/… but it should be mentioned in the definition of the structure) * The dataset “index” in Analyzed_data is difficult to understand, what is it used for? I think it’s not useful, I would delete it. * The "spatial position" in Analyzed_data supposes that we are doing mappings. This is too restrictive for no reason, it’s better to generalize the abscissa and allow the user to specify a non-limiting parameter (the “Name” attribute for example) with whatever value he wants (position, temperature, concentration of whatever, …). A concrete example of a limit here: angle measurements, I want my data to be dependent on the angle, not the position. * Having different datasets in the same “Analyzed_data” group corresponding to the result of different treatments raises the question of where the process followed to treat the data is stored. A better approach would be to create n groups “Analyzed_data_n” with only one dataset of treated values, allowing for the process to be stored in the attributes of the group Analyzed_data_n * I don’t understand why store an array of amplitude in “Analyzed_data”, is it for the SNR? Then maybe we could name this array “SNR”? * The array “Fit_error_n” is super important but ill defined. I’d rather choose a statistical quantity like the variance, standard deviation (what I think is best), least-square error… and have it apply to both the Shift and Linewidth array as so: “Shift_std” and “Linewidth_std" * I don’t understand “Calibration_index”: where are the calibration curves? Are they in “experiment_info”? If so, we expect people to already process their calibration curves to create an array before adding them to the hdf5 file? I’m not very familiar with all devices, so I might not see the limitations here but do we ever have more than one calibration curve per measure? Could we not add it to the group as a “Calibration” dataset? Or just have one group with the calibration curve? * Timestamp is typically an attribute, it shouldn’t be present inside the group as an element. * In tn/Spectra_n , “Amplitude” is the PSD so I would call it PSD because there are other “Amplitude” datasets so it’s confusing. If it’s not the PSD, I would call it “Raw_data”. * I don’t understand what “Parameters” is meant to do in tn/Spectra_n, plus it’s not a dataset so I would put it in attributes or most likely not use it as I don’t understand what it does. * Frequency is a dataset, not a float (I think). We also need to have a place where to store the process to obtain it. In VIPA spectrometers for instance this is likely a big (the main even I think) source of error. I would put this process in attributes (as a text). * I don’t think “Unit” is useful, if we have a frequency axis, then we should define it directly in GHz, and if it’s a pixel axis, then for one we should not call it “Frequency” and then it’s better not to put anything since by default we will consider the abscissa (in absence of Frequency) as a simple range of the size of the “Amplitude” dataset. * /tn/Images: it’s a good idea, but I believe this is redundant with “Analyzed_data” (?) If it’s not then I don’t understand how we get the datasets inside it. * “Calibration_spectra” is a separate group, wouldn’t it be better to have it in “Experiment_info” in the presented structure? Also might scare off people that might not want to store a calibration file every time they create a HDF5 file (I might or might not be one of them) Like I said before, I don’t want this to be taken as more than what lead me to defining a new approach to the format. I want to state once again that Carlo's structure is complete, only it’s useful for specific instruments and applications, and difficultly applicable to other techniques and scenarios (and more lazy people like myself). Following Carlo’s mail, I’ve also completed the PDF I made to describe the structure I use in the HDF5_BLS library, I’m joining it to this email and pushing its code to GitHub (https://github.com/bio-brillouin/HDF5_BLS/blob/GUI_development/guides/Projec...), feel free to edit it and criticize it at length (I feel like I deserve it after this email I really tried not to write). Best, Pierre Pierre Bouvet, PhD Post-doctoral Fellow Medical University Vienna Department of Anatomy and Cell Biology Wahringer Straße 13, 1090 Wien, Austria On 20/2/25, at 16:12, Robert Prevedel via Software wrote: Dear all, great to see all this discussion in this thread, and thanks to especially Pierre and Carlo for driving this forward. I’ve been following the various emails and arguments closely but simply didn’t have any time to chip in due to some important committments in the past days. I understand that there was a bit of a disagreement about what the focus of this effort should be, so maybe it just helps to highlight my lab's view on this (which I just discussed in depth with Carlo and Sebastian): Our original motivation was to come up with and define a common file-format, as we regard this to be key to unify the processing and visualization of Brillouin data by the community. In this respect, we would be happy to focus our efforts on defining this format and taking care of implementing the necessary processing/visualization software and interface that allows anyone to look at the data in the same way. We also regard this to be crucial if we want to standardize the reporting of Brillouin data from diverse setups/users/applications. Therefore, at this stage it would be extremely important to agree on the structure of the file format. Carlo has proposed a very well thought-through structure for this, and it would be great to get your concrete feedback on this, as I understand this hasn’t really happened yet. To aid in this, e.g. Pierre and/or Sal could try to convert or save your standard data into this structure, and report on any difficulties or ambiguities that he encounters. Based on this I agree it’s best to meet and discuss and iron this out as a next step, however it either has to be next week (ideally Fri?), or after March 12 as I am travelling back-to-back in the meantime. Of course feel free to also meet without me for more technical discussions if this speeds up things. Either way we could then also discuss the file format etc. for the ‘raw’ data that Pierre proposed (and which is indeed very valuable as well). Let me know your thoughts, and let’s keep up the great momentum and excitement on this work! Best, Robert -- Dr. Robert Prevedel Group Leader Cell Biology and Biophysics Unit European Molecular Biology Laboratory Meyerhofstr. 1 69117 Heidelberg, Germany Phone: +49 6221 387-8722 Email: robert.prevedel@embl.de (mailto:robert.prevedel@embl.de) http://www.prevedel.embl.de (http://www.prevedel.embl.de/) On 20.02.2025, at 10:29, Carlo Bevilacqua via Software wrote: Hi Kareem, thanks for the suggestion, I agree that it is a good (and easy) way to divide the tasks! Just to be clear, it is not that I don't see the need/advantage of providing some standard treatment going from raw data to standard spectra, it is just that was not my priority when proposing the idea of a unified file format. Regarding the file format, splitting the one containing the raw data and the treatments from the one containing the spectra and the image in a standard format might be a good solution and we can always merge them at a later stage. As for the file containing the "standard" spectra, it would be very helpful if you can give some feedback on the structure I originally proposed (https://github.com/prevedel-lab/Brillouin-standard-file/blob/main/docs/Bh5_f...). Keep in mind that the idea is to be able to associate spectrum/spectra to each pixel in the image, in a way that is independent of the scanning strategy and underlaying technique. I tried to find a solution that works for the techniques I am aware of, considering the peculiarities (e.g. for most VIPA setups there is no absolute frequency axis but only relative to water). If am happy to discuss why I made some specific choices and if you see a better way to achieve the same or see things differently. Both the 3rd and the 4th of March work for me. Best, Carlo On Thu, Feb 20, 2025 at 02:50, Kareem Elsayad via Software wrote: Dear All, (and I guess especially Carlo & Pierre 😊) I understand both your (main) points concerning what this all should be, and I think this is actually perfect for dividing tasks. The format of the hf or bh5 file being where things meet and what needs to be agreed on. The thing with raw data is ofcourse that it is variable between instruments and labs, and the conversion to “standard spectra” that can then be fitted etc. is going to be unique (maybe even between experiments in same project). That said, asking people to create some complex file from their data that works with a developed software is also unlikely to get a following. So (the way I see it) there are basically two parts. Getting from raw data to h5 (or bh5) format which contains the spectra in standard format. And then the whole analysis part and visualization (GUI, pretty features, etc.). While the latter may get the spotlight, it obviously relies heavily on the former being done right. Given that there are numerous “standard” BLS setup implementations the development of software for getting from raw data to h5 I think makes sense, since the h5 will no doubt be cryptic, and creating a working h5 is not something everyone will want to program by themselves (it is not an insignificant step given we are also trying to ultimately cater to biologists). As such a software that generates the h5 files, with drag and drop features and entering system parameters, for different setups makes sense and will save many labs a headache if they don’t have a good programmer on hand. So I would suggest that Pierre & Sal lead the work on developing this, while Carlo & Sebastian lead the work on developing the analysis/interface-presentation part. This way things are nicely divided and we just need to agree on the h5 file that is transferred between the two. From the side of Pierre & Sal there could maybe also be a second h5 generated that contains all the raw data and details on how it was converted to the transferred h5 file (for complete transparency this could then also be reported in papers if people wish). These could exist as two separate programs with respective GUIs but also eventually combined to a single one. How does this sound to everyone? To clear up details and try assign tasks going forward how about a Zoom first week of March (I would be free Monday 3rd and Tue 4th after 1pm)? All the best, Kareem From: Carlo Bevilacqua via Software Reply to: Carlo Bevilacqua Date: Wednesday, 19. February 2025 at 20:43 To: Pierre Bouvet Cc: Subject: [Software] Re: [EXTERN] Re: Software manuscript / BLS microscopy Hi Pierre, I realized that we might have slightly different aims. For me the most important part of this project is to have a unified file format that can be read and visualized by a standard software. The file format you are proposing is not sufficient for that in my opinion. For example one of my main motivation was to have an interface where the user can see the reconstructed image, click on a pixel, see the corresponding spectrum to check its quality and maybe try different fitting functions; that would already not be possible with your structure because the software would have no notion on where the spectral data is stored and how to associate it to a specific pixel. I don't see the structure of the file to be too complex as an issue, as long as it is functional: we can always provide an API and/or a GUI that allow people to take their spectra and save them in whatever format we decide without bothering about understanding the actual structure, the same way you can work with HDF5 file without having any understanding on how the data is actually stored on the disk. My idea of making a webapp as a GUI follows directly from there. Typical case: I sent some data to a collaborator and they can just run the app in their browser and check if the outliers they see in the image are real or a bad spectra. Similarly if we make a common database of Brillouin spectra, people can explore it easily using the webapp. From what I understood, you are instead more interested in going from raw data to an actual spectrum, which I don't see so much as a priority because each lab has their own code already and the actual procedure would be different for each lab (apart from standard instruments like the FP). I am not saying this should not be part of the software but not as a priority and rather has a layer where people can easily implement their own code (of course we could already implement code for standard instruments). I think it would be good to cleary define what is our common aim now, so we are sure we are working in the same direction. Let me know if you agree or I misunderstood what is your idea. Best, Carlo On Wed, Feb 19, 2025 at 16:11, Pierre Bouvet wrote: Hi, I think you're trying to go too far too fast. The approach I present here (https://github.com/bio-brillouin/HDF5_BLS/blob/GUI_development/guides/Projec...) is intentionally simple, so that people can very quickly get to storing their data in a HDF5 file format together with the parameters they used to acquire them with minimal effort. The closest to what you did is therefore as follows: - data are datasets with no other restriction and they are stored in groups - each group can have a set of attribute proper to the data they are storing - attributes have a nomenclature imposed by a spreadsheet and are in the form of text - the default name of a data is the name of a raw data: “Raw_data”, other arrays can have whatever name they want (Shift_5GHz, Frequency, ...) - arrays and attributes are hierarchical, so they apply to their groups and all groups under it. This is the bare minimum to meet our needs, so we need to stop here in the definition of the format since it’s already enough to have the GUI working correctly, and therefore the first version of the unified software advertised. Of course we will have to refine things later on, but we don’t want to scare people off by presenting them a file description that for one might not match their measurements and that is extremely hard to conceptually understand. To make my point clearer, take your definition of the format for example: there are 3 different amplitude arrays in your description, two different shift arrays and width arrays that are of different dimension, then we have a calibration group on one side but a spectrometer characterization array in another group that is called “experiment_info”, that’s just too complicated to use correctly. On the other hand, placing your raw data “as is” in a group dedicated to this data is conceptually easy and straightforward. Where you are right, is that should we have hundreds of people using it, we might in a near future want to store abscissa, impulse responses, … in a standardized manner. In that case, the question falls down to either adding sub-groups or storing the data together with the measure. Both are fine and don’t really pose a problem for now, essentially because we are not trying to visualize the results but just trying to unify the way to get them. Now regarding Dash, if I understand correctly, it’s just a way to change the frontend you propose? If that’s so, why not, but then I don’t really see the benefits: if you really want to use dash, you can always embed it inside a Qt app. Also Dash being browser based, you will only have one window for the whole interface, which will be a pain to deal with if you want to use the interface to do everything the GUI is expected to do (inspect an H5 file, convert PSD, treat data, edit parameters, inspect a failed treatment, simulate results using setups with slight changes of parameters…). We agree that at one point when people receive an h5 file, it will be useful to have a web interface that can do what yours or Sal’s GUI do (seeing the mapping results together with the spectrum, eventually the time-domain signal) but here again, it’s going too far too soon: let’s first have a simple and reliable GUI that can convert data from any spectrometer to PSDs and treat them with a unified code. This is the real challenge, visualization and nomenclature of results are both important but secondary. Also keep in mind that, the frontend can easily be generated by anyone really, with Copilot or ChatGPT or whatever AI, but you can’t ask them to develop the function that will correctly read your data and convert them to a PSD nor treat the PSD. This is done on the backend and is the priority since the unification essentially happens there. Best, Pierre Pierre Bouvet, PhD Post-doctoral Fellow Medical University Vienna Department of Anatomy and Cell Biology Wahringer Straße 13, 1090 Wien, Austria On 19/2/25, at 13:21, Carlo Bevilacqua wrote: Hi Pierre, thanks for your reply. Regarding the file structure, what I am still not very clear about is what you define as Raw_data and data, how the actual spectra are stored and how the association to spatial coordinates and parameters is made. That's why I would really appreciate if you could make a document similar to what I did (https://github.com/prevedel-lab/Brillouin-standard-file/blob/main/docs/Bh5_f...), where it is clear what each group should (or can) contain, what is the shape of each dataset, which attributes they have, etc... I am not saying that this should be the final structure of the file but I strongly believe that having it written in a structured way helps defining it and seeing potential issues. Regarding the webapp, it works by separating the frontend, which run in the browser and is responsible of running the GUI, and the backend which is doing the actual computation and that you can structure as you like with multithreading or any optimization you wish. The communication between frontend and backend is handled transparently by the framework, so you don't have to take care of it. When you run Dash locally a local server is created so the data stays on your computer and there is no issue with data transfer/privacy. If we want to move it to a server at a later stage, then you are right about the fact that data needs to be transferred to a server (although there might be solutions that allow you to still run the computation on the local browser, like WebAssembly (https://webassembly.org/), but I think it is too complex to look into this at this stage). Regarding safety and privacy, the data will be stored on the server only for the time that the user is using the app and then deleted (of course we will need to make a disclaimer on the website about this). Regarding space I don't think people at the beginning will load their 1Tb dataset on the webapp but rather look at some small dataset of few tens of Gb; in that case 1Tb of server space is more than enough (remember that the file will be stored only for the time the user is using the app). If people really start to use the webapp and space becomes a limitation, I would be super happy to look into WebAssembly so that the data can be handled locally from the browser without transferring it to the server. To summarize I would agree that, at this stage, there might be no advantage of a webapp over a local GUI (and might actually be a bit more work to develop it). But, if this project really flies, the potential of a webapp is huge, especially in the context of the BioBrillouin society where we want to have a database of spectral data and the webapp could be used to explore that without downloading anything on your computer. My main point is that moving now to a webapp would not be too much work, but if we want to do it at a later stage it will basically entail re-writing everything from scratch. Let me know what are your thoughts about it. Best, Carlo On Wed, Feb 19, 2025 at 08:51, Pierre Bouvet wrote: Hi Carlo, You’re right, the format is still a little fuzzy. The main idea is to have a data-based hierarchy for storage: each data is stored in an individual group. From there, abscissa dependent on the data are stored in the same group and the treated data are stored in sub-groups. The names of the groups and sub-groups are fixed (Data_i), as is the name of the raw data (Raw_data) and abscissa (Abscissa_i). Also, the measure and spectrometer-dependent arguments have a defined nomenclature. To differentiate groups between them, we preferably attribute them a name as an attribute that is not used as an identifier, the identifier being either the path to the data/group from file root (Data_0/Data_42/Data_2/Raw_data) or potentially a hash value (not implemented). This I think allows all possible configurations, and using an hierarchical approach we can also pass common attributes and arrays (parameters of the spectrometer or abscissa arrays for example) on parent to reduce memory complexity. Now regarding the use of server-based GUI, first off, I’ve never used them so I’m just making supposition here but if the platform is able to treat data online, it will have to store the spectra somewhere in memory and it will not be local. My primary concerns with this approach is safety, particularly in terms of intellectual property protection, ethical considerations, and potential security vulnerabilities. Additionally, managing storage space will be a headache. Now, this doesn’t mean that we can’t have a server-based data plotter, or a server-based interface that does treatments locally but I don’t really see the benefits of this over a local software that can have multiple windows, which could at one point be multithreaded, and that could wrap c code to speed regressions for example (some of this might apply to Dash, I’m not super familiar with it). Now regarding memory complexity, having all the data we treat go on a server is a bad idea as it will raise the question of cost which will very rapidly become a real problem. Just an example: for a 100x100 map, I need 10Gb of memory (1Mo/point) with my setup (1To of archive storage is approximately 1euro/month) so this would get out of hands super fast assuming people use it. Now maybe there are solutions I don’t see for these problems and someone can take care of them but for me it’s just not worth the effort when having a local GUI solves all of these issues at once. But if you find a solution, then I’ll be happy to migrate to Dash, it won’t be fast to translate every feature but I can totally join you on the platform. Best, Pierre Pierre Bouvet, PhD Post-doctoral Fellow Medical University Vienna Department of Anatomy and Cell Biology Wahringer Straße 13, 1090 Wien, Austria On 18/2/25, at 20:26, Carlo Bevilacqua wrote: Hi Pierre, regarding the structure of the file, I agree that we should keep it simple. I am not suggesting to make it more complex, rather to have a document where we define it in a clear and structured way rather than as a general description, to make sure that we are all on the same page. I am saying this because, to be honest, I am not sure I fully understand how you are structuring the HDF5 and I think it is important to agree on this now, rather than finding at a later stage that we had different ideas. Ideally if the GUI should be part of a single application, we should write it using a unified framework. The reasons why, after considering it for a bit, I lean towards Dash rather than Qt are: * it can run in a web browser so it will be easy to eventually move it to a website, thus people can use it without installing it (which will hopefully help in promoting its use) * it is based on plotly (https://plotly.com/python/) which is a graphical library with very good plotting capabilites and highly customizable, that would make the data visualization easier/more appealing Let me know what you think about it and if you see any advantage of Qt over a web app which I am not considering. Also, if we agree that Dash might be a better option, would you consider migrating to Dash? It might not be too much work if most of the code you wrote is for data processing rather that for the GUI itself and I could help you with that. Alternatively one workaround is to have a QtWebEngine (https://doc.qt.io/qtforpython-6/overviews/qtwebengine-overview.html) in your Qt app and have the Dash app run inside that, but that would make only the Dash part portable to a server later on. Best, Carlo On Tue, Feb 18, 2025 at 10:24, Pierre Bouvet wrote: Hi, Thanks, More than merge them later, just keep them separate in the process and rather than trying to build "one code to do it all", build one library and GUI that encapsulate codes to do everything. Having a structure is a must but it needs to be kept as simple as possible else we’ll rapidly find situations where we need to change the structure. The middle ground I think is to force the use of hierarchies and impose nomenclatures where problem are expected to appear: each dataset has its own group, each group can encapsulate other groups, each parameter of a group applies to all its sub-groups if the subgroup does not change its value, each array of a group applies to all of its sub-groups if the sub-group does not redefine an array with same name, the names of the groups are held as parameters and their ID are managed by the software. For the Plotly interface, I don’t know how to integrate it to Qt but if you find a way to do it, that’s perfect with me :) My vision of the GUI is something that unifies the format and can then execute scripts on the data stored in this format. I have pushed the application of the GUI to my data up to the point where I can do the whole information extraction process from it (add data, convert to PSD, fit curves). I think this could be super interesting if we implement it for all techniques. I think we could formalize the project in milestones, in particular define the minimal denominator that will allow us to have the paper. The milestone I reached for my spectro encompasses the following points: - Being able to add data to the file easily (by dragging & dropping to the GUI) - Being able to assign properties to these data easily (again by dragging & dropping) - Being able to structure the added data in groups/folders/containers/however we want to call it - Making it easy for new data types to be loaded - Allowing data from same type but different structure to be added (e.g. .dat files) - Execute scripts on the data easily and allowing parameters of these scripts to be defined from the GUI (e.g. select a peak on a curve to fit this peak) - Make it easy to add scripts for treating or extracting PSD from raw data. - Allow the export of a Python code to access the data from the file (we cans see them as “break points” in the treatment pipeline) - Edit of properties inside the GUI In any case I think we could build a spec sheet for the project with what we want to have in it based on what we want to advertise in the paper. We can always add things later on but if we agree on a strict minimum to have the project advertised, then that will set its first milestone on which we’ll be able to build later on. Best, Pierre Pierre Bouvet, PhD Post-doctoral Fellow Medical University Vienna Department of Anatomy and Cell Biology Wahringer Straße 13, 1090 Wien, Austria On 17/2/25, at 14:53, Carlo Bevilacqua via Software wrote: Hi Pierre, hi Sal, thanks for sharing your thoughts about it. @Pierre I am very sorry that Ren passed away :( As far as I understood you are suggesting to work on the individual aspects separately and then merge them together at a later stage? I am fine with that but I still think it is very important to now agree on what should be in the file format we are defining, because that is kind of the core of the project and will affect a lot of the design choices. I am happy to start working on the GUI for data visualization. In my idea, it will be something similar to this (https://www.nature.com/articles/s41592-023-02054-z/figures/10) but written in dash (https://dash.plotly.com/), so it is a web app that for now can run locally (so no transfer of data to an external server is required) but in the future can easily be uploaded to a website that people can just use without installing anything on their computer. The question is how much of the data processing should be possible to do (or trigger) from the same GUI? I think at least a drop down menu with different fitting functions should be there, so the user can quickly check the results on a spectrum from a specific point in the image. @Pierre how are you envisioning the GUI you are working on? As far as I understood it is mainly to get the raw data and save it to our HDF5 format with some treatment on it. One idea could be to have a shared list of features that we are implementing in the GUI as we work on it, to avoid having the same functionality duplicated (or worst inconsistent) between the GUI for generating our file format and the GUI for visualization. Let me know what you think about it. Best, Carlo On Mon, Feb 17, 2025 at 11:04, Pierre Bouvet via Software wrote: Hi everyone, Sorry for the delayed response, I just went through the loss of Ren (my dog) and wasn’t at all able to answer. First of, Sal, I am making progress and I should have everything you have made on your branch integrated to the GUI branch soon, at which point I will push everything to main. Regarding the project, I think I align with Sal: keep things as simple as possible. My approach was to divide everything in 3 mostly independent layers: - Store data in an organized file that anyone can use, and make it easy to do - Convert these data into something that has physical significance: a Power Spectrum Density - Extract information from this Power Spectrum Density Each layer has its own challenge but they are independent on the challenge of having people using it: personally, if I had someone come to me with a new software to play with my measures, I would most likely only look at it for 1 minute (or less depending who made it) with a lot of apprehension and then based on how simple it looks and how much I understood of it, use it or - what is most likely - discard it. This is why Project.pdf (https://github.com/bio-brillouin/HDF5_BLS/blob/GUI_development/guides/Projec...) is essentially meant to say: we put data arrays in groups and give them attributes written in text, but you can also create groups within groups to organize your data! I believe most of the people in the BioBrillouin society will have the same approach and before having something complex that can do a lot, I think it’s best to have something simple that can just unify the format (which in itself is a lot) and that people can use right away with a minimal impact on their own individual pipelines for data processing. To be honest, I don’t think people will blindly trust our software at first to treat their data, but they will most likely use it at first to organize their raw spectra, and maybe add their own treated data if they are feeling particularly adventurous. But that is not a problem as long as we start a movement. From there yes, we can complexity and create custom file architectures but that is already too complex I think for this first project. If we can all just import our data to the wrapper and specify their attributes, this will already be a success. Then for the paper, if we can all add a custom code to treat these data to obtain a PSD, I think this will be enough. As I said, the current API already allows you to add your data in a variety of format, so it’s just a question of developing the PSD conversion before having something we can publish (and then tell people to use). A few extra points: - Working with my setup, I realized if the user could choose between different algorithms to treat their own data, it would make the overall project much more usable (if an algorithm bugs for whatever reason, you can use another one) so I created 2 bottle necks in the form of functions (for PSD conversion and treatment) that would inspect modules dedicated to either PSD conversion or treatment, and list existing functions. It’s in between classical and modular programming but it makes the development of new PSD conversion code and treatment way way easier - The GUI is developed using oriented-object programming. Therefore I have already made some low-level choices that kind of impact all the GUI. I’m not saying they are the best choices, I’m just saying that they work, so if you want to work on the GUI, I would either recommend getting familiar with these choices, or making sure that all the functionalities are preserved, particularly the ones that are invisible (logging of treatment steps, treatment errors…) I’ll try merging the branches on Git asap and will definitely send you all an email when it’s done :) Best, Pierre Pierre Bouvet, PhD Post-doctoral Fellow Medical University Vienna Department of Anatomy and Cell Biology Wahringer Straße 13, 1090 Wien, Austria On 14/2/25, at 19:36, Sal La Cavera Iii via Software wrote: Hi all, I agree with the things enumerated and points made by Kareem/Carlo! I guess I would advocate for starting from a position of simplicity. We probably don't want to get weighed down by trying to include a bunch of bells and whistles from the start as these can be easily added once there is a minimally viable stable product. As long as data can be loaded to local memory, then treated in various (initially simple) ways through the GUI (and maybe maintain non-GUI compatibility for command-line warriors like myself), then the bh5 formatting stuff can be sorted on the back end? I definitely agree with Carlo's structure set out in the file format document; but all of that data will be floating around the memory in some shape or form and just needs to be wrapped up and packaged (according to Carlo's structure e.g.) when the user is happy and presses the "generate h5 filestore" etc. (?) Definitely agree with the recommendation to create the alpha using mainly requirements that our 3 labs would find useful (import filetypes, treatments, etc), and then we can add on more universal functionality second / get some beta testers in from other labs etc. I'm able to support on whatever jobs need doing and am free to meet in the beginning of March like you mentioned Kareem. Hope you guys have a nice weekend, Cheers, Sal --------------------------------------------------------------- Salvatore La Cavera III Royal Academy of Engineering Research Fellow Nottingham Research Fellow Optics and Photonics Group University of Nottingham Email: salvatore.lacaveraiii@nottingham.ac.uk (mailto:salvatore.lacaveraiii@nottingham.ac.uk) ORCID iD: 0000-0003-0210-3102 (https://outlook.office.com/bookwithme/user/6a3f960a8e89429cb6fc693c01d10119@...) Book a Coffee and Research chat with me! ------------------------------------ From: Carlo Bevilacqua via Software Sent: 12 February 2025 13:31 To: Kareem Elsayad Cc: sebastian.hambura@embl.de (mailto:sebastian.hambura@embl.de) ; software@biobrillouin.org (mailto:software@biobrillouin.org) Subject: [Software] Re: Software manuscript / BLS microscopy You don't often get email from software@biobrillouin.org (mailto:software@biobrillouin.org). Learn why this is important (https://aka.ms/LearnAboutSenderIdentification) Hi Kareem, thanks for restarting this and sorry for my silence, I just came back from US and was planning to start working on this again. Could you also add Sebastian (in CC) to the mailing list? As you outlined, I would split the project into two parts: 1) getting from the raw data to some standard "processed' spectra and 2) do data analysis/visualization on that. For the second part the way I envision it is: * the most updated definition of the file format from Pierre is this one (https://github.com/bio-brillouin/HDF5_BLS/blob/GUI_development/guides/Projec...), correct? In addition to this document I think it would be good to have a more structured description of the file (like this (https://github.com/prevedel-lab/Brillouin-standard-file/blob/main/docs/Bh5_f...)), where each field is clearly defined in terms of data type and dimensions. Sebastian was also suggesting that the document should contain the reasoning behind each specific choice in the specs and also things that we considered but decided had some issues (so in future we can look back at it). I still believe that the file format should contain the "processed" spectra (i.e. after FT and baseline subtraction for impulsive, or after taking a line profile and possibly linearization with VIPA,...) so we can apply standard data processing or visualization which is independent on the actual underlaying technique (e.g. VIPA, FP, stimulated, time domain, ...) * agree on an API to read the data from our file format (most likely a Python class). For that we should: 1) decide on which information is important to extract (spectral information, spatial coordinates, hyper-parameters, metadata,...) 2) implement an interface to read the data (e.g. readSpectrumAtIndex(...), readImage(...), ...) * build a GUI that use the previously defined API to show and process the data. I would say that, once we have a very solid description of the file format as in step 1, step 2 will come naturally and we can divide the actual implementation between us. Step 3 can also easily be implemented and divided between us once we have an API (and I am happy to work on the GUI myself). The first half of the project is the trickiest and I know Pierre has already done a lot of work in that direction. We should definitely agree on which extent we can define a standard to store the raw data, given the variability between labs, (and probably we should do it for common techniques like FP or VIPA) and how to implement the treatments, leaving to possibility to load some custom code in the pipeline to do the conversion. Let me know what you all think about this. If you agree I would start by making a document which clearly defines the file format in a structured way (as in my step 1 before). @Pierre could you write a new document or modify the document I originally made (https://github.com/prevedel-lab/Brillouin-standard-file/blob/main/docs/Bh5_f...) to reflect the latest structure you implemented for the file format? The metadata can still be defined in a separated excel sheet, as long as the data type and format is well defined there. Best regards, Carlo On Wed, Feb 12, 2025 at 02:19, Kareem Elsayad via Software wrote: Hi Robert, Carlo, Sal, Pierre, Think it would be good to follow up on software project. Pierre has made some progress here and would be good to try and define tasks a little bit clearer to make progress… There is always the potential issue of having “too many cooks in the kitchen” (that have different recipes for same thing) to move forward efficiently, something that I noticed can get quite confusing/frustrating when writing software together with people. So would be good to clearly assign tasks. I talked to Pierre today and he would be happy to integrate things in framework we have to try tie things together. What would foremost be needed would be ways of treating data, meaning code that takes a raw spectral image and meta-data and converts it into “standard” format (spectral representation) that can then be fitted. Then also “plugins” that serve a specific purpose in the analysis/rendering that can be included in framework. The way I see it (and please comment if you see differently), there are ~4 steps here: * Take raw data (in .tif,, .dat, txt, etc. format) and meta data (in .cvs, xlsx, .dat, .txt, etc.) and render a standard spectral presentation. Also take provided instrument response in one of these formats and extract key parameters from this * Fit the data with drop-down menu list of functions, that will include different functional dependences and functions corrected for instrument response. * Generate/display a visual representation of results (frequency shift(s) and linewidth(s)), that is ideally interactive to some extent (and maybe has some funky features like looking at spectra at different points. These can be spatial maps and/or evolution with some other parameter (time, temperature, angle, etc.). Also be able to display maps of relative peak intensities in case of multiple peak fits, and whatever else useful you can think of. * Extract “mechanical” parameters given assigned refractive indices and densities I think the idea of fitting modified functions (e.g. corrected based on instrument response) vs. deconvolving spectra makes more sense (as can account for more complex corrections due to non-optical anomalies in future –ultimately even functional variations in vicinity of e.g. phase transitions). It is also less error prone, as systematically doing decon with non-ideal registration data can really throw you off the cliff, so to speak. My understanding is that we kind of agreed on initial meta-data reporting format. Getting from 1 to 2 will no doubt be most challenging as it is very instrument specific. So instructions will need to be written for different BLS implementations. This is a huge project if we want it to be all inclusive.. so I would suggest to focus on making it work for just a couple of modalities first would be good (e.g. crossed VIPA, time-resolved, anisotropy, and maybe some time or temperature course of one of these). Extensions should then be more easy to navigate. At one point think would be good to involve SBS specific considerations also. Think would be good to discuss a while per email to gather thoughts and opinions (and already start to share codes), and then plan a meeting beginning of March -- how does first week of March look for everyone? I created this mailing list (software@biobrillouin.org (mailto:software@biobrillouin.org)) we can use for discussion. You should all be able to post to (and it makes it easier if we bring anyone else in along the way). At moment on this mailing list is Robert, Carlo, Sal, Pierre and myself. Let me know if I should add anyone. All the best, Kareem This message and any attachment are intended solely for the addressee and may contain confidential information. If you have received this message in error, please contact the sender and delete the email and attachment. Any views or opinions expressed by the author of this email do not necessarily reflect the views of the University of Nottingham. Email communications with the University of Nottingham may be monitored where permitted by law. _______________________________________________ Software mailing list -- software@biobrillouin.org (mailto:software@biobrillouin.org) To unsubscribe send an email to software-leave@biobrillouin.org (mailto:software-leave@biobrillouin.org) _______________________________________________ Software mailing list -- software@biobrillouin.org (mailto:software@biobrillouin.org) To unsubscribe send an email to software-leave@biobrillouin.org (mailto:software-leave@biobrillouin.org) _______________________________________________ Software mailing list -- software@biobrillouin.org (mailto:software@biobrillouin.org) To unsubscribe send an email to software-leave@biobrillouin.org (mailto:software-leave@biobrillouin.org) _______________________________________________ Software mailing list -- software@biobrillouin.org (mailto:software@biobrillouin.org) To unsubscribe send an email to software-leave@biobrillouin.org (mailto:software-leave@biobrillouin.org) _______________________________________________ Software mailing list -- software@biobrillouin.org (mailto:software@biobrillouin.org) To unsubscribe send an email to software-leave@biobrillouin.org (mailto:software-leave@biobrillouin.org) _______________________________________________ Software mailing list -- software@biobrillouin.org (mailto:software@biobrillouin.org) To unsubscribe send an email to software-leave@biobrillouin.org (mailto:software-leave@biobrillouin.org)
Hi everyone :) As I told you during the meeting, I just pushed everything on Git and merged with main. You can normally clone the project and test it on your machines by running the HDF5_BLS_GUI/main.py script from base repository. If it doesn’t work, it might be an os compatibility issue on the paths, but I’m hopeful I won’t have to patch that ^^ You can quickly test it with the test data provided in tests/test_data, this will however only allow you to do the most basic things (import data and edit parameters). A first version of the parameter spreadsheet (the child of the Consensus paper) is located in “spreadsheets”. You can open this file and edit it and then export it as csv. The exported csv can be dragged and dropped into the right frame of the GUI to update all the parameters of the group or dataset that you have selected in the left frame. Naturally, this GUI is built on the hierarchical structure I propose for the HDF5 file (described in guides/Project/Project.pdf), note however that it can be adjusted to a linear approach (cf discussion of today) so see this more as a first “usability” test of a - relatively - stable version, and a way for you to make a list of everything that is wrong with the software. @ Sal: I’ll soon have the code to convert your data to PSD & frequency arrays, but I’m confident you can already use the format to store your spectra as time arrays (with abscissa) from your .dat and .con files (and .. Note that because I don’t have order of magnitudes for the parameters you use, I could only test the GUI and its usability. In case you are looking for the code for importing your data, it’s in HDF5_BLS/load_formats/load_dat.py in the “load_dat_TimeDomain” function Last thing: I located the developer guide I couldn’t find during the meeting and placed it back where I thought it was (guides/DeveloperGuide/ModuleDeveloperGuide.pdf). I’m underlining this document because this is maybe the most important one of the whole project since it’s where people that want to collaborate after it’s made public will go to. The goal of this document is to take people by the hand and help them making their additions compatible with the whole project. For now this document only talks about adding data. Best, Pierre Pierre Bouvet, PhD Post-doctoral Fellow Medical University Vienna Department of Anatomy and Cell Biology Wahringer Straße 13, 1090 Wien, Austria
On 28/2/25, at 14:18, Carlo Bevilacqua via Software <software@biobrillouin.org> wrote:
Hi all,
I made a file describing the file format, you can find it here <https://github.com/bio-brillouin/HDF5_BLS/blob/main/Bh5_file_spec.md>. I think that attributes are easy to add and names of groups/datasets can be changed (if they are unclear now), so these are details that we don't need to discuss now. What I find most important to agree on now is the general structure. In that sense that are still some points under discussion between me and Pierre, but hopefully we can iron them out during the meeting.
Talk to you in a bit, Carlo
On Wed, Feb 26, 2025 at 23:56, Kareem Elsayad <kareem.elsayad@meduniwien.ac.at> wrote: Hi Carlo,
Sounds great!
Yes, Fri 28th @3pm still works for me. If it works for others, here is Zoom we can use:
https://us02web.zoom.us/j/5191046969?pwd=alpzaldoZEd3N2ZEQ0hYZU1RR1dOdz09
Meeting ID: 519 104 6969
Passcode: jY3zH8
All the best,
kareem
From: Carlo Bevilacqua via Software <software@biobrillouin.org <mailto:software@biobrillouin.org>> Reply to: Carlo Bevilacqua <carlo.bevilacqua@embl.de <mailto:carlo.bevilacqua@embl.de>> Date: Wednesday, 26. February 2025 at 20:43 To: Kareem Elsayad <kareem.elsayad@meduniwien.ac.at <mailto:kareem.elsayad@meduniwien.ac.at>> Cc: "software@biobrillouin.org <mailto:software@biobrillouin.org>" <software@biobrillouin.org <mailto:software@biobrillouin.org>> Subject: [Software] Re: [EXTERN] Re: Software manuscript / BLS microscopy
Hi Kareem,
thank you for your email.
We are discussing with Pierre about the details of the file format and hopefully by our next meeting we will have agreed on a file format and we can divide the tasks.
If it is still an option, Friday 28th at 3pm works for me.
Best regards,
Carlo
On Mon, Feb 24, 2025 at 03:17, Kareem Elsayad <kareem.elsayad@meduniwien.ac.at <mailto:kareem.elsayad@meduniwien.ac.at>> wrote:
Dear All,
I (and Robert) were hoping there would be some consensus on this h5 file format. Let us do a Zoom on Fri 28th Feb at 15:00?
A couple of points pertaining to arguments…
Firstly, the precise structure is not worth getting into big arguments or fuss about…as long as it contains all the information needed for the analysis/representation, and all parties can work with (able to write and read knowing what is what), it ultimately doesn’t matter. In my opinion better put more (optional) stuff in if that is issue, and make it as inclusive as possible. In the end this does not need to be read by analysis/representation side, and when we go through we can decide if and what needs to be stripped. It is after all the “black box” between doing the experiment and having your final plots/images. Take a look at say a Zeiss file and try figure all that’s in it (it is not ideally structured maybe, but no biologist ever cared) – that said, I am sure their team had very similar arguments concerning structure etc.! (you have as many opinions as people). Maybe the issue is that the boundary conditions were not as well defined, but I would say at this point make them more inclusive than they need to be (empty spaces cost little memory)
Secondly, and following on from firstly. We need to simply agree and compromise to make any progress asap. Rather than building separate structures we need to add/modify a single existing structure or we might as well be working on independent projects. Carlo’s initially proposed structure seemed reasonable, maybe with some minor changes, and we should just go with that as a basis in my opinion. I would suggest that Pierre and Carlo have a Zoom together and try and come up with something that is acceptable to both. Like everything in life, this will involve making compromises. And then present it on 28th Feb. Quite simply, if there is no agreement we cannot do this project and in the end it doesn’t matter who is right or wrong.
Finally, I hope the disagreements from both sides are not seen as negative or personal attacks –it is ok to disagree (that’s why we have so many meetings!) On the plus side we are still more effective than the Austrian government (that is still deciding who should be next prime minister like half a year after elections) 😊
All the best,
Kareem
From: Pierre Bouvet via Software <software@biobrillouin.org <mailto:software@biobrillouin.org>> Reply to: Pierre Bouvet <pierre.bouvet@meduniwien.ac.at <mailto:pierre.bouvet@meduniwien.ac.at>> Date: Friday, 21. February 2025 at 11:55 To: Carlo Bevilacqua <carlo.bevilacqua@embl.de <mailto:carlo.bevilacqua@embl.de>> Cc: <software@biobrillouin.org <mailto:software@biobrillouin.org>> Subject: [Software] Re: [EXTERN] Re: Software manuscript / BLS microscopy
Hi Carlo,
Thanks for your reply, here is the next pong of this ping pong series ^^
1- I was talking indeed about the enums, but also the parameters that are defined as integers or floating point numbers and uint32. I think its easier (and that we already agreed on) having a spreadsheet with the parameters (easy to use, easy to update, easy to store and modify between two experiments using the same setup, allows to impose fixed choices for some parameters with drop-down lists, allows to detail the requirements for the attribute like its format or units and allows examples) and to just import it in the HDF5 file. >From there it’s easier to have every attribute as strings both for the import and for the concept of what an attribute is.
2- OK
3- The problem is not necessarily the number of experiments you put in the file but the number of hyper parameters you want to take into account. Let’s take an example with a doubtable sense: I want to study the effect of low-frequency temperature fluctuations on micro mechanics in active samples both eukaryote and prokaryote showing a layered structure (endothelial cells arranged in epidermis, biofilms, …) with different cell types, and as a function of aging. I would then create a file with a first range of groups for the age of the sample, then inside these groups 2 groups for eukaryote and prokaryote samples, then inside these groups N groups for the samples I’m looking at, then inside these groups M groups for the temperature fluctuations I impose, then inside these groups the individual measures I make (this is fictional, I’m scared just to think at the amount of work to have all the samples, let alone measure them), this is simply not possible with your approach I think, and even simpler experiments like to measure the Allan variance on an instrument using 2 samples is not possible with your structure I think.
4- /
5- I think the real question is what we expect to get from a wrapper: for me is to wrap the measures of a given study, to then share, link to papers, treat using new approaches… Having a structure that can wrap both a full study and an experiment is in my opinion better in the long run than forcing the format to be used with only one experiment.
6- Yes, I understand it is an identifier, but why an integer? Why not a tuple? Why not a hash? And what if there’s a bug and instead of 3 you store you store 3.0, or 2, or ‘e'? Do you imagine the amount of work to understand where this bug comes from? Assuming it’s a bug because it might very well be just an inexperienced user making a mistake and then your file is broken. The idea is good but the safer way to have this is to work with nD arrays where the dimensionality is conserved I think, or just have all the information in the same group.
7- Here again, it’s more useful for your application but many people don’t use maps, so why force them to have even an empty array for that? Plus if they need to have a dedicated array for the concentration of crosslinkers (for example), they are faced with a non-trivial solution, which means they won’t use the format.
8- Yes, we could add an additional layer, but then it means that if you don’t need it, your datasets are in plain in the group and if you need it, then you don’t have the same structure. The solution I think is to already have the treated data in a group, if you don’t need more than one group (which will be most of the time the case) then you’ll only have one group of treated data.
9- I think it’s not useful. The SNR on the other hand is useful, because in shot-noise regime it’s a marker of variance, and this is one of the ways to spot outliers from treatment (if the SNR doesn’t match the returned standard deviation on the shift of one peak, there’s a problem somewhere).
10- The std of a fit is obtained by taking the square root of the diagonalized covariant matrix returned by the fit as long as your parameters are independent (it’s super interesting actually and a little bit more complicated but it’s true enough for lorentzian, DHO, Gaussian...)
11- OK but then why not have the calibration curves placed with your measures if they are only applicable to this measure? Once again, I think having indexes that are modifiable by the user is not safe (the technical term is “idiot proof”)
12- I don’t agree, if you are capturing points at a fixed interval, then you can reconstruct the timestamp from the timestamp of the first acquisition and either the delay between two acquisitions or the timestamp of the last acquisition. Most of the time however we don’t even need this as we consider the sample to be time-invariant on the scale of our measure, so a single timestamp for all the measure is enough and is better stored as an attribute. In the special case where we are not time-invariant, then time becomes the abscissa of the measures and in that case yes, it can be a dataset, but then it’s better to not impose a fixed name for this dataset and rather let the user decide what hyper parameter is changed during he’s measure, this way the user is free to use whatever hyper parameters he feels like it.
13- OK
14- Still not clear to me. My approach is to consider an experiment to be a measure of a sample as function of one or more controlled or measured hyper parameter. So my general approach for storing experiments is have 3 files: abscissa (with the hyper parameters that vary), measure and metadata, which translates to “Raw_data”, “Abscissa_i” and attributes for this format.
15- OK, I think more than brainstorming about how to treat correctly a VIPA spectrum, we need to allow people to tell how they do it if we want this project to be used in short term, unification is a goal of this project and we will advertise it in the paper, but to be honest, I doubt people like Giuliano will run with it without second guessing it, particularly with its clinical setups, so there will be some going back and forth before we have something stable, and this means we need to allow for this back and forth to appear somewhere, I propose having it as a parameter.
16- Here I think you allow too much liberty, changing the frequency of an array to GHz is trivial and I think most people do use GHz as the unit of their frequency arrays anyway. We need to make it clear that the frequency axis is in GHz but I think we don’t need a full element for this. If you really want to specify the unit of the Frequency dataset, I would suggest putting it in its attributes in any case, and not as another element in the structure.
17- OK
18- I think it’s one way to do it but it is not intuitive: I won’t have the reflex to go check in the attributes if there is a parameter “sam_as” to see if the calibration applies to all the curves. The way I would expect it to be is using the hierarchical logic of the format: if I’m looking at a dataset in a sub-group of a group containing a calibration dataset, then I know this calibration applies to my data:
Data
|- Data_0 (group)
| |- Calibration (dataset)
| |- Data_0 (group) | | |- Raw_data (dataset)
| |- Data_1 (group) | | |- Raw_data (dataset)
|- Data_1 (group)
| |- Calibration (dataset)
| |- Data_0 (group)
| | |- Raw_data (dataset)
I think in this example most people would suppose Data/Data_0/Calibration applies both to Data/Data_0/Data_0/Raw_data and Data/Data_0/Data_1/Raw_data but not Data/Data_1/Data_0/Raw_data whose calibration is intuitively Data/Data_1/Calibration
Once again, my approach of the structure is trying to make it intuitive and most of all, simple. For instance if I place myself in the position of someone that is willing to try “just to see how it works”, I would give myself 10s to understand how I could have a file for only one measure that complies with the new (hope to be) standard. It is my opinion as I already told you before, that your approach is too complete and therefore complex, which will inevitably lead to people not using the format unless there’s a GUI to do it for them (and even then they might not use it). I don’t want to impose my vision here, and like you I have put a lot of thinking (and testing) into building the format I propose, but I’m convinced that if we go with your structure, not only will it make it hard for anyone to understand how to use it but we’ll have problems using it ourselves. I want to repeat that I don’t have the solution, I’m just confident that my approach is much easier to conceptually understand and less restrictive than yours. In any case we can agree to disagree on that, but then it’ll be good to have an alternative backend like the one I did with your format to try and use it, and see if indeed it’s better, because if it’s not and people don’t use it, I don’t want to go back to all the trouble I had building the library, docs and GUI just to try.
I don’t want to impose you anything but it would be awesome if you took the time to read the document I made and completed for you yesterday. Then you can just tell me where you think I’m missing something and you had a better solution because as you might see, I’m having problems with nearly all your structure and we can’t really use it as a starting point at this stage since most of the backend is written and the front-end is already functional for my setup (and soon Sal’s and the TFP).
Best,
Pierre
Pierre Bouvet, PhD
Post-doctoral Fellow
Medical University Vienna
Department of Anatomy and Cell Biology
Wahringer Straße 13, 1090 Wien, Austria
On 20/2/25, at 22:55, Carlo Bevilacqua <carlo.bevilacqua@embl.de <mailto:carlo.bevilacqua@embl.de>> wrote:
Hi Pierre,
thank you for your feedback. I appreciate that you took the time to go through my definition and highlighting the critical points.
I much prefer this rather than starting working with a file format where problem might arise in the future. If we understand what are the reasons behind our choices in the definition we can merge the best of the two approaches, rather than defining two "standards" for the same thing with each of them having their limitations.
I will provide an answer to each of the points you raised (I gave numbers to the points in your email below, so it is easier to reference):
I am not sure to which attribute you are referring specifically, but I am completely fine with text; I defined enums where I felt it makes sense to do so because there is a discrete number of options (one could always add elements at the end of an enum) I defined the attributes before we started working together and I am very much open to changing them so they reflect what you have in the spreadsheet; in the document defining the file format we can just state that the attributes and their type are defined in the excel sheet I did it this way because in my idea an individual HDF5 file corresponds to a single experiment. If you feel there is an advantage in keeping different experiments in the same file I am open to introduce your structure of subgroups; I honestly feel like this will only make the file unnecessarly large and different experiments would mostly not share much (apart from the metadata, which is anyway a small overhead in terms of filesize). Now of course the question is what you define as an 'experiment': for me different timepoints or measurements at different temperatures/angles/etc on the same sample are a single experiment and I defined the file so that it is possible to save them in a single file; measurements on different samples are not the same experiment in my original idea same as the point 3 same as before, I would put different samples in different files but happy to introduce your structure if you feel there is an advantage the index is used to uniquely identify an entry in the 'Analysed_data' table; it is important in the contest of reconstructing the image (see the definition of the 'tn/image' group) in my opinion spatial coordinates have a privileged role since we are doing imaging and having them well defined it is important to reconstruct the image; for different abscissas I defined the 'parameters' dataset (more in point 14). If one is not doing imaging this dataset can be set to an empty array or a single element (we can include this in the definition) in my idea the "Analyzed_data" group doesn't contain multiple treatments but the result of the fit on the 'final' spectra, which are unique; if you are referring to the 'n' in the 'Shift_n_GHz' that is included in case a multipeak fit is performed. Now, if we want to include the possibility of multiple treatments like you are doing (which I didn't originally consider) we could just add an additional layer to the hierarchy that is the amplitude of the peak from the fit. I am not sure if you didn't understand what I meant or you think it is not an useful information The fit error actually contains 2 quantities: R2 and RMSE (as defined in the type). I am not sure how you would calculate a std from a single spectrum the calibration curves are stored in the 'calibration_spectra' group with the name of the dataset matching the respective 'Calibration_index'. In our VIPA setup we are acquiring multiple calibration curves during a single acquisition to compensate for laser drift, that's why I introduced the possibility of having multiple calibration curves. Note that the 'Calibration_index' is defined as optional exactly because it might not be needed each spectrum can have its own timestamp if it is acquired from a different camera image or scan of a FP, etc that's why it needs to be a dataset. Note that it is an optional dataset good point, we can rename it to PSD that is exactly to account for the general case of the abscissa not being a spatial coordinate and it contains the values for the parameters (e.g. the angles in an angle resolved measurement). It is a dataset whose dimensions are defined in the description (happy to elaborate more if it is not clear) float is the type of each element; it is a dataset whose dimensions are defined in the description; the way to define the frequency axis in general for setups which don't have an absolute frequency (like VIPAs) is tricky and would be good to brainstorm about possibile solutions as for the name we can change it, but the problem on how to deal with the situation when one doesn't have the frequency in GHz remains. My idea here was to leave the possibility of different units because the fit and most of the data analysis can be performed even if the x-axis is not in GHz and the actual conversion of the shift to GHz can be done at the end and requires the calibration data. As in my previous point, I am happy to brainstorm different solutions to this problem it is indeed redundant with 'Analyzed_data' and I pushed a change on GitHub to correct this see point 11; also note that the group is optional (in case people don't need it) and I introduced the attribute "same_as" to avoid repeating it multiple times if it is always the same for all the 'tn' As you see we agree with some of the points or we could find a common solution, for others it was mainly a misunderstanding on what were my intentions (probably my bad in expressing them, but you could have asked if it was not clear).
Hope this helps claryfing my reasoning in the file definition and I am happy to discuss all the open points.
I will look in details at your newest definition that you shared in the next days.
Best,
Carlo
On Thu, Feb 20, 2025 at 18:25, Pierre Bouvet via Software <software@biobrillouin.org <mailto:software@biobrillouin.org>> wrote:
Hi,
My goal with this project is to unify the treatment of BLS spectra, to then allow us to address fundamental biophysical questions with BLS as a community in the mid-long term. Therefore my principal concern for this format is simplicity: measure are datasets called “Raw_data”, if they need one or more abscissa to be understood, this/these abscissa are called “Abscissa_i” and they are placed in groups called “Data_i” where we can store their attributes in the group’s attributes. From there, I can put groups in groups to store an experiment with different ... (e.g. : samples, time points, positions, techniques, wavelengths, patients, …). This structure is trivial but lacks usability so I added an attribute called “Name” to all groups that the user can define as he wants without impacting the structure.
Now here are a few critics on Carlo’s approach. I didn’t want to share them because I hate criticizing anyone’s work, and I do think that what Carlo presented is great, but I don’t want you to think that I just trashed what he did, to the contrary, it’s because I see limitations in his approach that I tried developing another, simpler one. So here are the points I have problems with in Carlo’s approach:
The preferred type of the information on an experiment should be text as we’ll likely see new devices (like your super nice FT approach) appear in the next months/years that will require new parameters to be defined to describe them. I think we should really try not to use anything else than strings in the attributes. The experiment information should not be defined by the HDF5 file structure but rather by a spreadsheet because everyone knows how to use Excel, and it’s way easier to edit an Excel file than an HDF5 file. Experiment information should apply to measures and not to files, because they might vary from experiment to experiment, I think their preferred allocation is thus the attributes of the groups storing individual measures (in my approach) The characterization of the instrument might also be experiment-dependent (if for some reason you change the tilt of a VIPA during the experiment for example), therefore having a dedicated group for it might not work for some experiments The groups are named “tn” and the structure does not present the nomenclature of sub-groups, this is a big problem if we want to store in the same format say different samples measured at different times (the logic patch would be to have sub-groups follow the same structure so tn/tm/tl/… but it should be mentioned in the definition of the structure) The dataset “index” in Analyzed_data is difficult to understand, what is it used for? I think it’s not useful, I would delete it. The "spatial position" in Analyzed_data supposes that we are doing mappings. This is too restrictive for no reason, it’s better to generalize the abscissa and allow the user to specify a non-limiting parameter (the “Name” attribute for example) with whatever value he wants (position, temperature, concentration of whatever, …). A concrete example of a limit here: angle measurements, I want my data to be dependent on the angle, not the position. Having different datasets in the same “Analyzed_data” group corresponding to the result of different treatments raises the question of where the process followed to treat the data is stored. A better approach would be to create n groups “Analyzed_data_n” with only one dataset of treated values, allowing for the process to be stored in the attributes of the group Analyzed_data_n I don’t understand why store an array of amplitude in “Analyzed_data”, is it for the SNR? Then maybe we could name this array “SNR”? The array “Fit_error_n” is super important but ill defined. I’d rather choose a statistical quantity like the variance, standard deviation (what I think is best), least-square error… and have it apply to both the Shift and Linewidth array as so: “Shift_std” and “Linewidth_std" I don’t understand “Calibration_index”: where are the calibration curves? Are they in “experiment_info”? If so, we expect people to already process their calibration curves to create an array before adding them to the hdf5 file? I’m not very familiar with all devices, so I might not see the limitations here but do we ever have more than one calibration curve per measure? Could we not add it to the group as a “Calibration” dataset? Or just have one group with the calibration curve? Timestamp is typically an attribute, it shouldn’t be present inside the group as an element. In tn/Spectra_n , “Amplitude” is the PSD so I would call it PSD because there are other “Amplitude” datasets so it’s confusing. If it’s not the PSD, I would call it “Raw_data”. I don’t understand what “Parameters” is meant to do in tn/Spectra_n, plus it’s not a dataset so I would put it in attributes or most likely not use it as I don’t understand what it does. Frequency is a dataset, not a float (I think). We also need to have a place where to store the process to obtain it. In VIPA spectrometers for instance this is likely a big (the main even I think) source of error. I would put this process in attributes (as a text). I don’t think “Unit” is useful, if we have a frequency axis, then we should define it directly in GHz, and if it’s a pixel axis, then for one we should not call it “Frequency” and then it’s better not to put anything since by default we will consider the abscissa (in absence of Frequency) as a simple range of the size of the “Amplitude” dataset. /tn/Images: it’s a good idea, but I believe this is redundant with “Analyzed_data” (?) If it’s not then I don’t understand how we get the datasets inside it. “Calibration_spectra” is a separate group, wouldn’t it be better to have it in “Experiment_info” in the presented structure? Also might scare off people that might not want to store a calibration file every time they create a HDF5 file (I might or might not be one of them) Like I said before, I don’t want this to be taken as more than what lead me to defining a new approach to the format. I want to state once again that Carlo's structure is complete, only it’s useful for specific instruments and applications, and difficultly applicable to other techniques and scenarios (and more lazy people like myself).
Following Carlo’s mail, I’ve also completed the PDF I made to describe the structure I use in the HDF5_BLS library, I’m joining it to this email and pushing its code to GitHub <https://github.com/bio-brillouin/HDF5_BLS/blob/GUI_development/guides/Projec...>, feel free to edit it and criticize it at length (I feel like I deserve it after this email I really tried not to write).
Best,
Pierre
Pierre Bouvet, PhD
Post-doctoral Fellow
Medical University Vienna
Department of Anatomy and Cell Biology
Wahringer Straße 13, 1090 Wien, Austria
On 20/2/25, at 16:12, Robert Prevedel via Software <software@biobrillouin.org <mailto:software@biobrillouin.org>> wrote:
Dear all,
great to see all this discussion in this thread, and thanks to especially Pierre and Carlo for driving this forward. I’ve been following the various emails and arguments closely but simply didn’t have any time to chip in due to some important committments in the past days.
I understand that there was a bit of a disagreement about what the focus of this effort should be, so maybe it just helps to highlight my lab's view on this (which I just discussed in depth with Carlo and Sebastian):
Our original motivation was to come up with and define a common file-format, as we regard this to be key to unify the processing and visualization of Brillouin data by the community. In this respect, we would be happy to focus our efforts on defining this format and taking care of implementing the necessary processing/visualization software and interface that allows anyone to look at the data in the same way. We also regard this to be crucial if we want to standardize the reporting of Brillouin data from diverse setups/users/applications.
Therefore, at this stage it would be extremely important to agree on the structure of the file format. Carlo has proposed a very well thought-through structure for this, and it would be great to get your concrete feedback on this, as I understand this hasn’t really happened yet. To aid in this, e.g. Pierre and/or Sal could try to convert or save your standard data into this structure, and report on any difficulties or ambiguities that he encounters.
Based on this I agree it’s best to meet and discuss and iron this out as a next step, however it either has to be next week (ideally Fri?), or after March 12 as I am travelling back-to-back in the meantime. Of course feel free to also meet without me for more technical discussions if this speeds up things. Either way we could then also discuss the file format etc. for the ‘raw’ data that Pierre proposed (and which is indeed very valuable as well).
Let me know your thoughts, and let’s keep up the great momentum and excitement on this work!
Best,
Robert
--
Dr. Robert Prevedel
Group Leader
Cell Biology and Biophysics Unit
European Molecular Biology Laboratory
Meyerhofstr. 1
69117 Heidelberg, Germany
Phone: +49 6221 387-8722
Email: robert.prevedel@embl.de <mailto:robert.prevedel@embl.de>
http://www.prevedel.embl.de <http://www.prevedel.embl.de/>
On 20.02.2025, at 10:29, Carlo Bevilacqua via Software <software@biobrillouin.org <mailto:software@biobrillouin.org>> wrote:
Hi Kareem,
thanks for the suggestion, I agree that it is a good (and easy) way to divide the tasks! Just to be clear, it is not that I don't see the need/advantage of providing some standard treatment going from raw data to standard spectra, it is just that was not my priority when proposing the idea of a unified file format.
Regarding the file format, splitting the one containing the raw data and the treatments from the one containing the spectra and the image in a standard format might be a good solution and we can always merge them at a later stage.
As for the file containing the "standard" spectra, it would be very helpful if you can give some feedback on the structure I originally proposed <https://github.com/prevedel-lab/Brillouin-standard-file/blob/main/docs/Bh5_f...>. Keep in mind that the idea is to be able to associate spectrum/spectra to each pixel in the image, in a way that is independent of the scanning strategy and underlaying technique. I tried to find a solution that works for the techniques I am aware of, considering the peculiarities (e.g. for most VIPA setups there is no absolute frequency axis but only relative to water). If am happy to discuss why I made some specific choices and if you see a better way to achieve the same or see things differently.
Both the 3rd and the 4th of March work for me.
Best,
Carlo
On Thu, Feb 20, 2025 at 02:50, Kareem Elsayad via Software <software@biobrillouin.org <mailto:software@biobrillouin.org>> wrote:
Dear All, (and I guess especially Carlo & Pierre 😊)
I understand both your (main) points concerning what this all should be, and I think this is actually perfect for dividing tasks. The format of the hf or bh5 file being where things meet and what needs to be agreed on.
The thing with raw data is ofcourse that it is variable between instruments and labs, and the conversion to “standard spectra” that can then be fitted etc. is going to be unique (maybe even between experiments in same project). That said, asking people to create some complex file from their data that works with a developed software is also unlikely to get a following.
So (the way I see it) there are basically two parts. Getting from raw data to h5 (or bh5) format which contains the spectra in standard format. And then the whole analysis part and visualization (GUI, pretty features, etc.).
While the latter may get the spotlight, it obviously relies heavily on the former being done right. Given that there are numerous “standard” BLS setup implementations the development of software for getting from raw data to h5 I think makes sense, since the h5 will no doubt be cryptic, and creating a working h5 is not something everyone will want to program by themselves (it is not an insignificant step given we are also trying to ultimately cater to biologists). As such a software that generates the h5 files, with drag and drop features and entering system parameters, for different setups makes sense and will save many labs a headache if they don’t have a good programmer on hand.
So I would suggest that Pierre & Sal lead the work on developing this, while Carlo & Sebastian lead the work on developing the analysis/interface-presentation part. This way things are nicely divided and we just need to agree on the h5 file that is transferred between the two. From the side of Pierre & Sal there could maybe also be a second h5 generated that contains all the raw data and details on how it was converted to the transferred h5 file (for complete transparency this could then also be reported in papers if people wish). These could exist as two separate programs with respective GUIs but also eventually combined to a single one.
How does this sound to everyone?
To clear up details and try assign tasks going forward how about a Zoom first week of March (I would be free Monday 3rd and Tue 4th after 1pm)?
All the best,
Kareem
From: Carlo Bevilacqua via Software <software@biobrillouin.org <mailto:software@biobrillouin.org>> Reply to: Carlo Bevilacqua <carlo.bevilacqua@embl.de <mailto:carlo.bevilacqua@embl.de>> Date: Wednesday, 19. February 2025 at 20:43 To: Pierre Bouvet <pierre.bouvet@meduniwien.ac.at <mailto:pierre.bouvet@meduniwien.ac.at>> Cc: <software@biobrillouin.org <mailto:software@biobrillouin.org>> Subject: [Software] Re: [EXTERN] Re: Software manuscript / BLS microscopy
Hi Pierre,
I realized that we might have slightly different aims.
For me the most important part of this project is to have a unified file format that can be read and visualized by a standard software. The file format you are proposing is not sufficient for that in my opinion. For example one of my main motivation was to have an interface where the user can see the reconstructed image, click on a pixel, see the corresponding spectrum to check its quality and maybe try different fitting functions; that would already not be possible with your structure because the software would have no notion on where the spectral data is stored and how to associate it to a specific pixel.
I don't see the structure of the file to be too complex as an issue, as long as it is functional: we can always provide an API and/or a GUI that allow people to take their spectra and save them in whatever format we decide without bothering about understanding the actual structure, the same way you can work with HDF5 file without having any understanding on how the data is actually stored on the disk.
My idea of making a webapp as a GUI follows directly from there. Typical case: I sent some data to a collaborator and they can just run the app in their browser and check if the outliers they see in the image are real or a bad spectra. Similarly if we make a common database of Brillouin spectra, people can explore it easily using the webapp.
From what I understood, you are instead more interested in going from raw data to an actual spectrum, which I don't see so much as a priority because each lab has their own code already and the actual procedure would be different for each lab (apart from standard instruments like the FP). I am not saying this should not be part of the software but not as a priority and rather has a layer where people can easily implement their own code (of course we could already implement code for standard instruments).
I think it would be good to cleary define what is our common aim now, so we are sure we are working in the same direction.
Let me know if you agree or I misunderstood what is your idea.
Best,
Carlo
On Wed, Feb 19, 2025 at 16:11, Pierre Bouvet <pierre.bouvet@meduniwien.ac.at <mailto:pierre.bouvet@meduniwien.ac.at>> wrote:
Hi,
I think you're trying to go too far too fast. The approach I present here <https://github.com/bio-brillouin/HDF5_BLS/blob/GUI_development/guides/Projec...> is intentionally simple, so that people can very quickly get to storing their data in a HDF5 file format together with the parameters they used to acquire them with minimal effort. The closest to what you did is therefore as follows:
- data are datasets with no other restriction and they are stored in groups
- each group can have a set of attribute proper to the data they are storing
- attributes have a nomenclature imposed by a spreadsheet and are in the form of text
- the default name of a data is the name of a raw data: “Raw_data”, other arrays can have whatever name they want (Shift_5GHz, Frequency, ...)
- arrays and attributes are hierarchical, so they apply to their groups and all groups under it.
This is the bare minimum to meet our needs, so we need to stop here in the definition of the format since it’s already enough to have the GUI working correctly, and therefore the first version of the unified software advertised. Of course we will have to refine things later on, but we don’t want to scare people off by presenting them a file description that for one might not match their measurements and that is extremely hard to conceptually understand. To make my point clearer, take your definition of the format for example: there are 3 different amplitude arrays in your description, two different shift arrays and width arrays that are of different dimension, then we have a calibration group on one side but a spectrometer characterization array in another group that is called “experiment_info”, that’s just too complicated to use correctly. On the other hand, placing your raw data “as is” in a group dedicated to this data is conceptually easy and straightforward.
Where you are right, is that should we have hundreds of people using it, we might in a near future want to store abscissa, impulse responses, … in a standardized manner. In that case, the question falls down to either adding sub-groups or storing the data together with the measure. Both are fine and don’t really pose a problem for now, essentially because we are not trying to visualize the results but just trying to unify the way to get them.
Now regarding Dash, if I understand correctly, it’s just a way to change the frontend you propose? If that’s so, why not, but then I don’t really see the benefits: if you really want to use dash, you can always embed it inside a Qt app. Also Dash being browser based, you will only have one window for the whole interface, which will be a pain to deal with if you want to use the interface to do everything the GUI is expected to do (inspect an H5 file, convert PSD, treat data, edit parameters, inspect a failed treatment, simulate results using setups with slight changes of parameters…). We agree that at one point when people receive an h5 file, it will be useful to have a web interface that can do what yours or Sal’s GUI do (seeing the mapping results together with the spectrum, eventually the time-domain signal) but here again, it’s going too far too soon: let’s first have a simple and reliable GUI that can convert data from any spectrometer to PSDs and treat them with a unified code. This is the real challenge, visualization and nomenclature of results are both important but secondary. Also keep in mind that, the frontend can easily be generated by anyone really, with Copilot or ChatGPT or whatever AI, but you can’t ask them to develop the function that will correctly read your data and convert them to a PSD nor treat the PSD. This is done on the backend and is the priority since the unification essentially happens there.
Best,
Pierre
Pierre Bouvet, PhD
Post-doctoral Fellow
Medical University Vienna
Department of Anatomy and Cell Biology
Wahringer Straße 13, 1090 Wien, Austria
On 19/2/25, at 13:21, Carlo Bevilacqua <carlo.bevilacqua@embl.de <mailto:carlo.bevilacqua@embl.de>> wrote:
Hi Pierre,
thanks for your reply.
Regarding the file structure, what I am still not very clear about is what you define as Raw_data and data, how the actual spectra are stored and how the association to spatial coordinates and parameters is made. That's why I would really appreciate if you could make a document similar towhat I did <https://github.com/prevedel-lab/Brillouin-standard-file/blob/main/docs/Bh5_f...>, where it is clear what each group should (or can) contain, what is the shape of each dataset, which attributes they have, etc...
I am not saying that this should be the final structure of the file but I strongly believe that having it written in a structured way helps defining it and seeing potential issues.
Regarding the webapp, it works by separating the frontend, which run in the browser and is responsible of running the GUI, and the backend which is doing the actual computation and that you can structure as you like with multithreading or any optimization you wish. The communication between frontend and backend is handled transparently by the framework, so you don't have to take care of it.
When you run Dash locally a local server is created so the data stays on your computer and there is no issue with data transfer/privacy.
If we want to move it to a server at a later stage, then you are right about the fact that data needs to be transferred to a server (although there might be solutions that allow you to still run the computation on the local browser, likeWebAssembly <https://webassembly.org/>, but I think it is too complex to look into this at this stage). Regarding safety and privacy, the data will be stored on the server only for the time that the user is using the app and then deleted (of course we will need to make a disclaimer on the website about this). Regarding space I don't think people at the beginning will load their 1Tb dataset on the webapp but rather look at some small dataset of few tens of Gb; in that case 1Tb of server space is more than enough (remember that the file will be stored only for the time the user is using the app). If people really start to use the webapp and space becomes a limitation, I would be super happy to look into WebAssembly so that the data can be handled locally from the browser without transferring it to the server.
To summarize I would agree that, at this stage, there might be no advantage of a webapp over a local GUI (and might actually be a bit more work to develop it). But, if this project really flies, the potential of a webapp is huge, especially in the context of the BioBrillouin society where we want to have a database of spectral data and the webapp could be used to explore that without downloading anything on your computer. My main point is that moving now to a webapp would not be too much work, but if we want to do it at a later stage it will basically entail re-writing everything from scratch.
Let me know what are your thoughts about it.
Best,
Carlo
On Wed, Feb 19, 2025 at 08:51, Pierre Bouvet <pierre.bouvet@meduniwien.ac.at <mailto:pierre.bouvet@meduniwien.ac.at>> wrote:
Hi Carlo,
You’re right, the format is still a little fuzzy. The main idea is to have a data-based hierarchy for storage: each data is stored in an individual group. From there, abscissa dependent on the data are stored in the same group and the treated data are stored in sub-groups. The names of the groups and sub-groups are fixed (Data_i), as is the name of the raw data (Raw_data) and abscissa (Abscissa_i). Also, the measure and spectrometer-dependent arguments have a defined nomenclature. To differentiate groups between them, we preferably attribute them a name as an attribute that is not used as an identifier, the identifier being either the path to the data/group from file root (Data_0/Data_42/Data_2/Raw_data) or potentially a hash value (not implemented). This I think allows all possible configurations, and using an hierarchical approach we can also pass common attributes and arrays (parameters of the spectrometer or abscissa arrays for example) on parent to reduce memory complexity.
Now regarding the use of server-based GUI, first off, I’ve never used them so I’m just making supposition here but if the platform is able to treat data online, it will have to store the spectra somewhere in memory and it will not be local. My primary concerns with this approach is safety, particularly in terms of intellectual property protection, ethical considerations, and potential security vulnerabilities. Additionally, managing storage space will be a headache.
Now, this doesn’t mean that we can’t have a server-based data plotter, or a server-based interface that does treatments locally but I don’t really see the benefits of this over a local software that can have multiple windows, which could at one point be multithreaded, and that could wrap c code to speed regressions for example (some of this might apply to Dash, I’m not super familiar with it). Now regarding memory complexity, having all the data we treat go on a server is a bad idea as it will raise the question of cost which will very rapidly become a real problem. Just an example: for a 100x100 map, I need 10Gb of memory (1Mo/point) with my setup (1To of archive storage is approximately 1euro/month) so this would get out of hands super fast assuming people use it.
Now maybe there are solutions I don’t see for these problems and someone can take care of them but for me it’s just not worth the effort when having a local GUI solves all of these issues at once. But if you find a solution, then I’ll be happy to migrate to Dash, it won’t be fast to translate every feature but I can totally join you on the platform.
Best,
Pierre
Pierre Bouvet, PhD
Post-doctoral Fellow
Medical University Vienna
Department of Anatomy and Cell Biology
Wahringer Straße 13, 1090 Wien, Austria
On 18/2/25, at 20:26, Carlo Bevilacqua <carlo.bevilacqua@embl.de <mailto:carlo.bevilacqua@embl.de>> wrote:
Hi Pierre,
regarding the structure of the file, I agree that we should keep it simple. I am not suggesting to make it more complex, rather to have a document where we define it in a clear and structured way rather than as a general description, to make sure that we are all on the same page.
I am saying this because, to be honest, I am not sure I fully understand how you are structuring the HDF5 and I think it is important to agree on this now, rather than finding at a later stage that we had different ideas.
Ideally if the GUI should be part of a single application, we should write it using a unified framework.
The reasons why, after considering it for a bit, I lean towards Dash rather than Qt are:
it can run in a web browser so it will be easy to eventually move it to a website, thus people can use it without installing it (which will hopefully help in promoting its use) it is based onplotly <https://plotly.com/python/>which is a graphical library with very good plotting capabilites and highly customizable, that would make the data visualization easier/more appealing Let me know what you think about it and if you see any advantage of Qt over a web app which I am not considering. Also, if we agree that Dash might be a better option, would you consider migrating to Dash? It might not be too much work if most of the code you wrote is for data processing rather that for the GUI itself and I could help you with that. Alternatively one workaround is to have a QtWebEngine <https://doc.qt.io/qtforpython-6/overviews/qtwebengine-overview.html> in your Qt app and have the Dash app run inside that, but that would make only the Dash part portable to a server later on.
Best,
Carlo
On Tue, Feb 18, 2025 at 10:24, Pierre Bouvet <pierre.bouvet@meduniwien.ac.at <mailto:pierre.bouvet@meduniwien.ac.at>> wrote:
Hi,
Thanks,
More than merge them later, just keep them separate in the process and rather than trying to build "one code to do it all", build one library and GUI that encapsulate codes to do everything.
Having a structure is a must but it needs to be kept as simple as possible else we’ll rapidly find situations where we need to change the structure. The middle ground I think is to force the use of hierarchies and impose nomenclatures where problem are expected to appear: each dataset has its own group, each group can encapsulate other groups, each parameter of a group applies to all its sub-groups if the subgroup does not change its value, each array of a group applies to all of its sub-groups if the sub-group does not redefine an array with same name, the names of the groups are held as parameters and their ID are managed by the software.
For the Plotly interface, I don’t know how to integrate it to Qt but if you find a way to do it, that’s perfect with me :)
My vision of the GUI is something that unifies the format and can then execute scripts on the data stored in this format. I have pushed the application of the GUI to my data up to the point where I can do the whole information extraction process from it (add data, convert to PSD, fit curves). I think this could be super interesting if we implement it for all techniques.
I think we could formalize the project in milestones, in particular define the minimal denominator that will allow us to have the paper. The milestone I reached for my spectro encompasses the following points:
- Being able to add data to the file easily (by dragging & dropping to the GUI)
- Being able to assign properties to these data easily (again by dragging & dropping)
- Being able to structure the added data in groups/folders/containers/however we want to call it
- Making it easy for new data types to be loaded
- Allowing data from same type but different structure to be added (e.g. .dat files)
- Execute scripts on the data easily and allowing parameters of these scripts to be defined from the GUI (e.g. select a peak on a curve to fit this peak)
- Make it easy to add scripts for treating or extracting PSD from raw data.
- Allow the export of a Python code to access the data from the file (we cans see them as “break points” in the treatment pipeline)
- Edit of properties inside the GUI
In any case I think we could build a spec sheet for the project with what we want to have in it based on what we want to advertise in the paper. We can always add things later on but if we agree on a strict minimum to have the project advertised, then that will set its first milestone on which we’ll be able to build later on.
Best,
Pierre
Pierre Bouvet, PhD
Post-doctoral Fellow
Medical University Vienna
Department of Anatomy and Cell Biology
Wahringer Straße 13, 1090 Wien, Austria
On 17/2/25, at 14:53, Carlo Bevilacqua via Software <software@biobrillouin.org <mailto:software@biobrillouin.org>> wrote:
Hi Pierre, hi Sal,
thanks for sharing your thoughts about it.
@Pierre I am very sorry that Ren passed away :(
As far as I understood you are suggesting to work on the individual aspects separately and then merge them together at a later stage? I am fine with that but I still think it is very important to now agree on what should be in the file format we are defining, because that is kind of the core of the project and will affect a lot of the design choices.
I am happy to start working on the GUI for data visualization. In my idea, it will be something similar tothis <https://www.nature.com/articles/s41592-023-02054-z/figures/10>but written indash <https://dash.plotly.com/>, so it is a web app that for now can run locally (so no transfer of data to an external server is required) but in the future can easily be uploaded to a website that people can just use without installing anything on their computer.
The question is how much of the data processing should be possible to do (or trigger) from the same GUI? I think at least a drop down menu with different fitting functions should be there, so the user can quickly check the results on a spectrum from a specific point in the image.
@Pierre how are you envisioning the GUI you are working on? As far as I understood it is mainly to get the raw data and save it to our HDF5 format with some treatment on it.
One idea could be to have a shared list of features that we are implementing in the GUI as we work on it, to avoid having the same functionality duplicated (or worst inconsistent) between the GUI for generating our file format and the GUI for visualization.
Let me know what you think about it.
Best,
Carlo
On Mon, Feb 17, 2025 at 11:04, Pierre Bouvet via Software <software@biobrillouin.org <mailto:software@biobrillouin.org>> wrote:
Hi everyone,
Sorry for the delayed response, I just went through the loss of Ren (my dog) and wasn’t at all able to answer.
First of, Sal, I am making progress and I should have everything you have made on your branch integrated to the GUI branch soon, at which point I will push everything to main.
Regarding the project, I think I align with Sal: keep things as simple as possible. My approach was to divide everything in 3 mostly independent layers:
- Store data in an organized file that anyone can use, and make it easy to do
- Convert these data into something that has physical significance: a Power Spectrum Density
- Extract information from this Power Spectrum Density
Each layer has its own challenge but they are independent on the challenge of having people using it: personally, if I had someone come to me with a new software to play with my measures, I would most likely only look at it for 1 minute (or less depending who made it) with a lot of apprehension and then based on how simple it looks and how much I understood of it, use it or - what is most likely - discard it. This is why Project.pdf <https://github.com/bio-brillouin/HDF5_BLS/blob/GUI_development/guides/Projec...> is essentially meant to say: we put data arrays in groups and give them attributes written in text, but you can also create groups within groups to organize your data!
I believe most of the people in the BioBrillouin society will have the same approach and before having something complex that can do a lot, I think it’s best to have something simple that can just unify the format (which in itself is a lot) and that people can use right away with a minimal impact on their own individual pipelines for data processing.
To be honest, I don’t think people will blindly trust our software at first to treat their data, but they will most likely use it at first to organize their raw spectra, and maybe add their own treated data if they are feeling particularly adventurous. But that is not a problem as long as we start a movement. From there yes, we can complexity and create custom file architectures but that is already too complex I think for this first project.
If we can all just import our data to the wrapper and specify their attributes, this will already be a success. Then for the paper, if we can all add a custom code to treat these data to obtain a PSD, I think this will be enough. As I said, the current API already allows you to add your data in a variety of format, so it’s just a question of developing the PSD conversion before having something we can publish (and then tell people to use).
A few extra points:
- Working with my setup, I realized if the user could choose between different algorithms to treat their own data, it would make the overall project much more usable (if an algorithm bugs for whatever reason, you can use another one) so I created 2 bottle necks in the form of functions (for PSD conversion and treatment) that would inspect modules dedicated to either PSD conversion or treatment, and list existing functions. It’s in between classical and modular programming but it makes the development of new PSD conversion code and treatment way way easier
- The GUI is developed using oriented-object programming. Therefore I have already made some low-level choices that kind of impact all the GUI. I’m not saying they are the best choices, I’m just saying that they work, so if you want to work on the GUI, I would either recommend getting familiar with these choices, or making sure that all the functionalities are preserved, particularly the ones that are invisible (logging of treatment steps, treatment errors…)
I’ll try merging the branches on Git asap and will definitely send you all an email when it’s done :)
Best,
Pierre
Pierre Bouvet, PhD
Post-doctoral Fellow
Medical University Vienna
Department of Anatomy and Cell Biology
Wahringer Straße 13, 1090 Wien, Austria
On 14/2/25, at 19:36, Sal La Cavera Iii via Software <software@biobrillouin.org <mailto:software@biobrillouin.org>> wrote:
Hi all,
I agree with the things enumerated and points made by Kareem/Carlo! I guess I would advocate for starting from a position of simplicity. We probably don't want to get weighed down by trying to include a bunch of bells and whistles from the start as these can be easily added once there is a minimally viable stable product.
As long as data can be loaded to local memory, then treated in various (initially simple) ways through the GUI (and maybe maintain non-GUI compatibility for command-line warriors like myself), then the bh5 formatting stuff can be sorted on the back end? I definitely agree with Carlo's structure set out in the file format document; but all of that data will be floating around the memory in some shape or form and just needs to be wrapped up and packaged (according to Carlo's structure e.g.) when the user is happy and presses the "generate h5 filestore" etc. (?)
Definitely agree with the recommendation to create the alpha using mainly requirements that our 3 labs would find useful (import filetypes, treatments, etc), and then we can add on more universal functionality second / get some beta testers in from other labs etc.
I'm able to support on whatever jobs need doing and am free to meet in the beginning of March like you mentioned Kareem.
Hope you guys have a nice weekend,
Cheers,
Sal
---------------------------------------------------------------
Salvatore La Cavera III
Royal Academy of Engineering Research Fellow
Nottingham Research Fellow
Optics and Photonics Group
University of Nottingham Email: salvatore.lacaveraiii@nottingham.ac.uk <mailto:salvatore.lacaveraiii@nottingham.ac.uk> ORCID iD: 0000-0003-0210-3102
<Outlook-tygjxucs.png> <https://outlook.office.com/bookwithme/user/6a3f960a8e89429cb6fc693c01d10119@...>
Book a Coffee and Research chat with me!
From: Carlo Bevilacqua via Software <software@biobrillouin.org <mailto:software@biobrillouin.org>> Sent: 12 February 2025 13:31 To: Kareem Elsayad <kareem.elsayad@meduniwien.ac.at <mailto:kareem.elsayad@meduniwien.ac.at>> Cc: sebastian.hambura@embl.de <mailto:sebastian.hambura@embl.de> <sebastian.hambura@embl.de <mailto:sebastian.hambura@embl.de>>; software@biobrillouin.org <mailto:software@biobrillouin.org> <software@biobrillouin.org <mailto:software@biobrillouin.org>> Subject: [Software] Re: Software manuscript / BLS microscopy
You don't often get email from software@biobrillouin.org <mailto:software@biobrillouin.org>. Learn why this is important <https://aka.ms/LearnAboutSenderIdentification>
Hi Kareem,
thanks for restarting this and sorry for my silence, I just came back from US and was planning to start working on this again.
Could you also add Sebastian (in CC) to the mailing list?
As you outlined, I would split the project into two parts: 1) getting from the raw data to some standard "processed' spectra and 2) do data analysis/visualization on that. For the second part the way I envision it is:
the most updated definition of the file format from Pierre is this one <https://github.com/bio-brillouin/HDF5_BLS/blob/GUI_development/guides/Projec...>, correct? In addition to this document I think it would be good to have a more structured description of the file (like this <https://github.com/prevedel-lab/Brillouin-standard-file/blob/main/docs/Bh5_f...>), where each field is clearly defined in terms of data type and dimensions. Sebastian was also suggesting that the document should contain the reasoning behind each specific choice in the specs and also things that we considered but decided had some issues (so in future we can look back at it). I still believe that the file format should contain the "processed" spectra (i.e. after FT and baseline subtraction for impulsive, or after taking a line profile and possibly linearization with VIPA,...) so we can apply standard data processing or visualization which is independent on the actual underlaying technique (e.g. VIPA, FP, stimulated, time domain, ...) agree on an API to read the data from our file format (most likely a Python class). For that we should: 1) decide on which information is important to extract (spectral information, spatial coordinates, hyper-parameters, metadata,...) 2) implement an interface to read the data (e.g. readSpectrumAtIndex(...), readImage(...), ...) build a GUI that use the previously defined API to show and process the data. I would say that, once we have a very solid description of the file format as in step 1, step 2 will come naturally and we can divide the actual implementation between us. Step 3 can also easily be implemented and divided between us once we have an API (and I am happy to work on the GUI myself).
The first half of the project is the trickiest and I know Pierre has already done a lot of work in that direction. We should definitely agree on which extent we can define a standard to store the raw data, given the variability between labs, (and probably we should do it for common techniques like FP or VIPA) and how to implement the treatments, leaving to possibility to load some custom code in the pipeline to do the conversion.
Let me know what you all think about this.
If you agree I would start by making a document which clearly defines the file format in a structured way (as in my step 1 before). @Pierre could you write a new document or modify the document I originally made <https://github.com/prevedel-lab/Brillouin-standard-file/blob/main/docs/Bh5_f...> to reflect the latest structure you implemented for the file format? The metadata can still be defined in a separated excel sheet, as long as the data type and format is well defined there.
Best regards,
Carlo
On Wed, Feb 12, 2025 at 02:19, Kareem Elsayad via Software <software@biobrillouin.org <mailto:software@biobrillouin.org>> wrote:
Hi Robert, Carlo, Sal, Pierre,
Think it would be good to follow up on software project. Pierre has made some progress here and would be good to try and define tasks a little bit clearer to make progress…
There is always the potential issue of having “too many cooks in the kitchen” (that have different recipes for same thing) to move forward efficiently, something that I noticed can get quite confusing/frustrating when writing software together with people. So would be good to clearly assign tasks. I talked to Pierre today and he would be happy to integrate things in framework we have to try tie things together. What would foremost be needed would be ways of treating data, meaning code that takes a raw spectral image and meta-data and converts it into “standard” format (spectral representation) that can then be fitted. Then also “plugins” that serve a specific purpose in the analysis/rendering that can be included in framework.
The way I see it (and please comment if you see differently), there are ~4 steps here:
Take raw data (in .tif,, .dat, txt, etc. format) and meta data (in .cvs, xlsx, .dat, .txt, etc.) and render a standard spectral presentation. Also take provided instrument response in one of these formats and extract key parameters from this Fit the data with drop-down menu list of functions, that will include different functional dependences and functions corrected for instrument response. Generate/display a visual representation of results (frequency shift(s) and linewidth(s)), that is ideally interactive to some extent (and maybe has some funky features like looking at spectra at different points. These can be spatial maps and/or evolution with some other parameter (time, temperature, angle, etc.). Also be able to display maps of relative peak intensities in case of multiple peak fits, and whatever else useful you can think of. Extract “mechanical” parameters given assigned refractive indices and densities
I think the idea of fitting modified functions (e.g. corrected based on instrument response) vs. deconvolving spectra makes more sense (as can account for more complex corrections due to non-optical anomalies in future –ultimately even functional variations in vicinity of e.g. phase transitions). It is also less error prone, as systematically doing decon with non-ideal registration data can really throw you off the cliff, so to speak.
My understanding is that we kind of agreed on initial meta-data reporting format. Getting from 1 to 2 will no doubt be most challenging as it is very instrument specific. So instructions will need to be written for different BLS implementations.
This is a huge project if we want it to be all inclusive.. so I would suggest to focus on making it work for just a couple of modalities first would be good (e.g. crossed VIPA, time-resolved, anisotropy, and maybe some time or temperature course of one of these). Extensions should then be more easy to navigate. At one point think would be good to involve SBS specific considerations also.
Think would be good to discuss a while per email to gather thoughts and opinions (and already start to share codes), and then plan a meeting beginning of March -- how does first week of March look for everyone?
I created this mailing list (software@biobrillouin.org <mailto:software@biobrillouin.org>) we can use for discussion. You should all be able to post to (and it makes it easier if we bring anyone else in along the way).
At moment on this mailing list is Robert, Carlo, Sal, Pierre and myself. Let me know if I should add anyone.
All the best,
Kareem
This message and any attachment are intended solely for the addressee and may contain confidential information. If you have received this message in error, please contact the sender and delete the email and attachment. Any views or opinions expressed by the author of this email do not necessarily reflect the views of the University of Nottingham. Email communications with the University of Nottingham may be monitored where permitted by law. _______________________________________________ Software mailing list -- software@biobrillouin.org <mailto:software@biobrillouin.org> To unsubscribe send an email to software-leave@biobrillouin.org <mailto:software-leave@biobrillouin.org>
_______________________________________________ Software mailing list --software@biobrillouin.org <mailto:software@biobrillouin.org> To unsubscribe send an email tosoftware-leave@biobrillouin.org <mailto:software-leave@biobrillouin.org>
_______________________________________________ Software mailing list -- software@biobrillouin.org <mailto:software@biobrillouin.org> To unsubscribe send an email to software-leave@biobrillouin.org <mailto:software-leave@biobrillouin.org>
_______________________________________________ Software mailing list -- software@biobrillouin.org <mailto:software@biobrillouin.org> To unsubscribe send an email to software-leave@biobrillouin.org <mailto:software-leave@biobrillouin.org>
_______________________________________________ Software mailing list -- software@biobrillouin.org <mailto:software@biobrillouin.org> To unsubscribe send an email to software-leave@biobrillouin.org <mailto:software-leave@biobrillouin.org>
_______________________________________________ Software mailing list -- software@biobrillouin.org <mailto:software@biobrillouin.org> To unsubscribe send an email to software-leave@biobrillouin.org <mailto:software-leave@biobrillouin.org>
_______________________________________________ Software mailing list -- software@biobrillouin.org To unsubscribe send an email to software-leave@biobrillouin.org
Hi all, we are still trying to find an agreement with Pierre but I think that, a part from the technicalities that we can probably figure out between ourselves, we have a different view on the aims of the file format and the project in general. Although I agree that for now we could work with separate files and convert between them, eventually we need to agree on a format to propose as a standard and I want to avoid postponing the decision (at least for the general structure, of course minor details can change during the process). Otherwise I am afraid that, once most of the code is written, it will be hard to unify it and this will make the decision even more difficult. What I see as the main points of this project are: * to have some sort of TIFF for Brillouin data, with the main aim of storing images (i.e. spatial maps of a sample) together with the spectral data that it is used to generate them and the relevant metadata and calibration data * while allowing the possibility of storing single spectra or spectra acquired in different conditions in multiple samples (i.e. having a whole study in a single file), I don't see this as a determinant in defining the file. That is because the same result can be achieved by having multiple file with a clear naming convention (e.g. ConcentrationX_TemperatureY_SampleN), which is commonly done in microscopy and I feel it is a "cleaner" solution than having everything in a single file * the analysis part of the software should be able to perform standard Brillouin analysis (i.e. fit the spectra with different functions that the user can select) but possibly more advanced stuff (like PCA or non-negative matrix factorisation) * the visualization part would be similar to this (https://www.nature.com/articles/s41592-023-02054-z/figures/10), where the user can click on a pixel and see the corresponding spectrum (possibly selecting different fit functions and see the result on the fly). If multiple images are stored in the file, some dropdown menus would appear to select the relevant parameters, which identify a single image. I discussed about these points with Robert and Sebastian and we agree on them. The structure of the file I proposed (and refined with input from Pierre and Sebastian) is designed with these aims in mind. @Pierre, can you please list your aims? I don't want write what I understood from you because I might misrapresent them. It would be good to have your feedback on what you consider to be the main aims and priorities, so we can have the last iteration on the format, as we'd like to proceed with the actual coding. Best regards, Carlo On Fri, Feb 28, 2025 at 19:01, Pierre Bouvet via Software wrote: Hi everyone :) As I told you during the meeting, I just pushed everything on Git and merged with main. You can normally clone the project and test it on your machines by running the HDF5_BLS_GUI/main.py script from base repository. If it doesn’t work, it might be an os compatibility issue on the paths, but I’m hopeful I won’t have to patch that ^^ You can quickly test it with the test data provided in tests/test_data, this will however only allow you to do the most basic things (import data and edit parameters). A first version of the parameter spreadsheet (the child of the Consensus paper) is located in “spreadsheets”. You can open this file and edit it and then export it as csv. The exported csv can be dragged and dropped into the right frame of the GUI to update all the parameters of the group or dataset that you have selected in the left frame. Naturally, this GUI is built on the hierarchical structure I propose for the HDF5 file (described in guides/Project/Project.pdf), note however that it can be adjusted to a linear approach (cf discussion of today) so see this more as a first “usability” test of a - relatively - stable version, and a way for you to make a list of everything that is wrong with the software. @ Sal: I’ll soon have the code to convert your data to PSD & frequency arrays, but I’m confident you can already use the format to store your spectra as time arrays (with abscissa) from your .dat and .con files (and .. Note that because I don’t have order of magnitudes for the parameters you use, I could only test the GUI and its usability. In case you are looking for the code for importing your data, it’s in HDF5_BLS/load_formats/load_dat.py in the “load_dat_TimeDomain” function Last thing: I located the developer guide I couldn’t find during the meeting and placed it back where I thought it was (guides/DeveloperGuide/ModuleDeveloperGuide.pdf). I’m underlining this document because this is maybe the most important one of the whole project since it’s where people that want to collaborate after it’s made public will go to. The goal of this document is to take people by the hand and help them making their additions compatible with the whole project. For now this document only talks about adding data. Best, Pierre Pierre Bouvet, PhD Post-doctoral Fellow Medical University Vienna Department of Anatomy and Cell Biology Wahringer Straße 13, 1090 Wien, Austria On 28/2/25, at 14:18, Carlo Bevilacqua via Software wrote: Hi all, I made a file describing the file format, you can find it here (https://github.com/bio-brillouin/HDF5_BLS/blob/main/Bh5_file_spec.md). I think that attributes are easy to add and names of groups/datasets can be changed (if they are unclear now), so these are details that we don't need to discuss now. What I find most important to agree on now is the general structure. In that sense that are still some points under discussion between me and Pierre, but hopefully we can iron them out during the meeting. Talk to you in a bit, Carlo On Wed, Feb 26, 2025 at 23:56, Kareem Elsayad wrote: Hi Carlo, Sounds great! Yes, Fri 28th @3pm still works for me. If it works for others, here is Zoom we can use: https://us02web.zoom.us/j/5191046969?pwd=alpzaldoZEd3N2ZEQ0hYZU1RR1dOdz09 (https://us02web.zoom.us/j/5191046969?pwd=alpzaldoZEd3N2ZEQ0hYZU1RR1dOdz09) Meeting ID: 519 104 6969 Passcode: jY3zH8 All the best, kareem From: Carlo Bevilacqua via Software Reply to: Carlo Bevilacqua Date: Wednesday, 26. February 2025 at 20:43 To: Kareem Elsayad Cc: "software@biobrillouin.org (mailto:software@biobrillouin.org)" Subject: [Software] Re: [EXTERN] Re: Software manuscript / BLS microscopy Hi Kareem, thank you for your email. We are discussing with Pierre about the details of the file format and hopefully by our next meeting we will have agreed on a file format and we can divide the tasks. If it is still an option, Friday 28th at 3pm works for me. Best regards, Carlo On Mon, Feb 24, 2025 at 03:17, Kareem Elsayad wrote: Dear All, I (and Robert) were hoping there would be some consensus on this h5 file format. Let us do a Zoom on Fri 28th Feb at 15:00? A couple of points pertaining to arguments… Firstly, the precise structure is not worth getting into big arguments or fuss about…as long as it contains all the information needed for the analysis/representation, and all parties can work with (able to write and read knowing what is what), it ultimately doesn’t matter. In my opinion better put more (optional) stuff in if that is issue, and make it as inclusive as possible. In the end this does not need to be read by analysis/representation side, and when we go through we can decide if and what needs to be stripped. It is after all the “black box” between doing the experiment and having your final plots/images. Take a look at say a Zeiss file and try figure all that’s in it (it is not ideally structured maybe, but no biologist ever cared) – that said, I am sure their team had very similar arguments concerning structure etc.! (you have as many opinions as people). Maybe the issue is that the boundary conditions were not as well defined, but I would say at this point make them more inclusive than they need to be (empty spaces cost little memory) Secondly, and following on from firstly. We need to simply agree and compromise to make any progress asap. Rather than building separate structures we need to add/modify a single existing structure or we might as well be working on independent projects. Carlo’s initially proposed structure seemed reasonable, maybe with some minor changes, and we should just go with that as a basis in my opinion. I would suggest that Pierre and Carlo have a Zoom together and try and come up with something that is acceptable to both. Like everything in life, this will involve making compromises. And then present it on 28th Feb. Quite simply, if there is no agreement we cannot do this project and in the end it doesn’t matter who is right or wrong. Finally, I hope the disagreements from both sides are not seen as negative or personal attacks –it is ok to disagree (that’s why we have so many meetings!) On the plus side we are still more effective than the Austrian government (that is still deciding who should be next prime minister like half a year after elections) 😊 All the best, Kareem From: Pierre Bouvet via Software Reply to: Pierre Bouvet Date: Friday, 21. February 2025 at 11:55 To: Carlo Bevilacqua Cc: Subject: [Software] Re: [EXTERN] Re: Software manuscript / BLS microscopy Hi Carlo, Thanks for your reply, here is the next pong of this ping pong series ^^ 1- I was talking indeed about the enums, but also the parameters that are defined as integers or floating point numbers and uint32. I think its easier (and that we already agreed on) having a spreadsheet with the parameters (easy to use, easy to update, easy to store and modify between two experiments using the same setup, allows to impose fixed choices for some parameters with drop-down lists, allows to detail the requirements for the attribute like its format or units and allows examples) and to just import it in the HDF5 file. >From there it’s easier to have every attribute as strings both for the import and for the concept of what an attribute is. 2- OK 3- The problem is not necessarily the number of experiments you put in the file but the number of hyper parameters you want to take into account. Let’s take an example with a doubtable sense: I want to study the effect of low-frequency temperature fluctuations on micro mechanics in active samples both eukaryote and prokaryote showing a layered structure (endothelial cells arranged in epidermis, biofilms, …) with different cell types, and as a function of aging. I would then create a file with a first range of groups for the age of the sample, then inside these groups 2 groups for eukaryote and prokaryote samples, then inside these groups N groups for the samples I’m looking at, then inside these groups M groups for the temperature fluctuations I impose, then inside these groups the individual measures I make (this is fictional, I’m scared just to think at the amount of work to have all the samples, let alone measure them), this is simply not possible with your approach I think, and even simpler experiments like to measure the Allan variance on an instrument using 2 samples is not possible with your structure I think. 4- / 5- I think the real question is what we expect to get from a wrapper: for me is to wrap the measures of a given study, to then share, link to papers, treat using new approaches… Having a structure that can wrap both a full study and an experiment is in my opinion better in the long run than forcing the format to be used with only one experiment. 6- Yes, I understand it is an identifier, but why an integer? Why not a tuple? Why not a hash? And what if there’s a bug and instead of 3 you store you store 3.0, or 2, or ‘e'? Do you imagine the amount of work to understand where this bug comes from? Assuming it’s a bug because it might very well be just an inexperienced user making a mistake and then your file is broken. The idea is good but the safer way to have this is to work with nD arrays where the dimensionality is conserved I think, or just have all the information in the same group. 7- Here again, it’s more useful for your application but many people don’t use maps, so why force them to have even an empty array for that? Plus if they need to have a dedicated array for the concentration of crosslinkers (for example), they are faced with a non-trivial solution, which means they won’t use the format. 8- Yes, we could add an additional layer, but then it means that if you don’t need it, your datasets are in plain in the group and if you need it, then you don’t have the same structure. The solution I think is to already have the treated data in a group, if you don’t need more than one group (which will be most of the time the case) then you’ll only have one group of treated data. 9- I think it’s not useful. The SNR on the other hand is useful, because in shot-noise regime it’s a marker of variance, and this is one of the ways to spot outliers from treatment (if the SNR doesn’t match the returned standard deviation on the shift of one peak, there’s a problem somewhere). 10- The std of a fit is obtained by taking the square root of the diagonalized covariant matrix returned by the fit as long as your parameters are independent (it’s super interesting actually and a little bit more complicated but it’s true enough for lorentzian, DHO, Gaussian...) 11- OK but then why not have the calibration curves placed with your measures if they are only applicable to this measure? Once again, I think having indexes that are modifiable by the user is not safe (the technical term is “idiot proof”) 12- I don’t agree, if you are capturing points at a fixed interval, then you can reconstruct the timestamp from the timestamp of the first acquisition and either the delay between two acquisitions or the timestamp of the last acquisition. Most of the time however we don’t even need this as we consider the sample to be time-invariant on the scale of our measure, so a single timestamp for all the measure is enough and is better stored as an attribute. In the special case where we are not time-invariant, then time becomes the abscissa of the measures and in that case yes, it can be a dataset, but then it’s better to not impose a fixed name for this dataset and rather let the user decide what hyper parameter is changed during he’s measure, this way the user is free to use whatever hyper parameters he feels like it. 13- OK 14- Still not clear to me. My approach is to consider an experiment to be a measure of a sample as function of one or more controlled or measured hyper parameter. So my general approach for storing experiments is have 3 files: abscissa (with the hyper parameters that vary), measure and metadata, which translates to “Raw_data”, “Abscissa_i” and attributes for this format. 15- OK, I think more than brainstorming about how to treat correctly a VIPA spectrum, we need to allow people to tell how they do it if we want this project to be used in short term, unification is a goal of this project and we will advertise it in the paper, but to be honest, I doubt people like Giuliano will run with it without second guessing it, particularly with its clinical setups, so there will be some going back and forth before we have something stable, and this means we need to allow for this back and forth to appear somewhere, I propose having it as a parameter. 16- Here I think you allow too much liberty, changing the frequency of an array to GHz is trivial and I think most people do use GHz as the unit of their frequency arrays anyway. We need to make it clear that the frequency axis is in GHz but I think we don’t need a full element for this. If you really want to specify the unit of the Frequency dataset, I would suggest putting it in its attributes in any case, and not as another element in the structure. 17- OK 18- I think it’s one way to do it but it is not intuitive: I won’t have the reflex to go check in the attributes if there is a parameter “sam_as” to see if the calibration applies to all the curves. The way I would expect it to be is using the hierarchical logic of the format: if I’m looking at a dataset in a sub-group of a group containing a calibration dataset, then I know this calibration applies to my data: Data |- Data_0 (group) | |- Calibration (dataset) | |- Data_0 (group) | | |- Raw_data (dataset) | |- Data_1 (group) | | |- Raw_data (dataset) |- Data_1 (group) | |- Calibration (dataset) | |- Data_0 (group) | | |- Raw_data (dataset) I think in this example most people would suppose Data/Data_0/Calibration applies both to Data/Data_0/Data_0/Raw_data and Data/Data_0/Data_1/Raw_data but not Data/Data_1/Data_0/Raw_data whose calibration is intuitively Data/Data_1/Calibration Once again, my approach of the structure is trying to make it intuitive and most of all, simple. For instance if I place myself in the position of someone that is willing to try “just to see how it works”, I would give myself 10s to understand how I could have a file for only one measure that complies with the new (hope to be) standard. It is my opinion as I already told you before, that your approach is too complete and therefore complex, which will inevitably lead to people not using the format unless there’s a GUI to do it for them (and even then they might not use it). I don’t want to impose my vision here, and like you I have put a lot of thinking (and testing) into building the format I propose, but I’m convinced that if we go with your structure, not only will it make it hard for anyone to understand how to use it but we’ll have problems using it ourselves. I want to repeat that I don’t have the solution, I’m just confident that my approach is much easier to conceptually understand and less restrictive than yours. In any case we can agree to disagree on that, but then it’ll be good to have an alternative backend like the one I did with your format to try and use it, and see if indeed it’s better, because if it’s not and people don’t use it, I don’t want to go back to all the trouble I had building the library, docs and GUI just to try. I don’t want to impose you anything but it would be awesome if you took the time to read the document I made and completed for you yesterday. Then you can just tell me where you think I’m missing something and you had a better solution because as you might see, I’m having problems with nearly all your structure and we can’t really use it as a starting point at this stage since most of the backend is written and the front-end is already functional for my setup (and soon Sal’s and the TFP). Best, Pierre Pierre Bouvet, PhD Post-doctoral Fellow Medical University Vienna Department of Anatomy and Cell Biology Wahringer Straße 13, 1090 Wien, Austria On 20/2/25, at 22:55, Carlo Bevilacqua wrote: Hi Pierre, thank you for your feedback. I appreciate that you took the time to go through my definition and highlighting the critical points. I much prefer this rather than starting working with a file format where problem might arise in the future. If we understand what are the reasons behind our choices in the definition we can merge the best of the two approaches, rather than defining two "standards" for the same thing with each of them having their limitations. I will provide an answer to each of the points you raised (I gave numbers to the points in your email below, so it is easier to reference): * I am not sure to which attribute you are referring specifically, but I am completely fine with text; I defined enums where I felt it makes sense to do so because there is a discrete number of options (one could always add elements at the end of an enum) * I defined the attributes before we started working together and I am very much open to changing them so they reflect what you have in the spreadsheet; in the document defining the file format we can just state that the attributes and their type are defined in the excel sheet * I did it this way because in my idea an individual HDF5 file corresponds to a single experiment. If you feel there is an advantage in keeping different experiments in the same file I am open to introduce your structure of subgroups; I honestly feel like this will only make the file unnecessarly large and different experiments would mostly not share much (apart from the metadata, which is anyway a small overhead in terms of filesize). Now of course the question is what you define as an 'experiment': for me different timepoints or measurements at different temperatures/angles/etc on the same sample are a single experiment and I defined the file so that it is possible to save them in a single file; measurements on different samples are not the same experiment in my original idea * same as the point 3 * same as before, I would put different samples in different files but happy to introduce your structure if you feel there is an advantage * the index is used to uniquely identify an entry in the 'Analysed_data' table; it is important in the contest of reconstructing the image (see the definition of the 'tn/image' group) * in my opinion spatial coordinates have a privileged role since we are doing imaging and having them well defined it is important to reconstruct the image; for different abscissas I defined the 'parameters' dataset (more in point 14). If one is not doing imaging this dataset can be set to an empty array or a single element (we can include this in the definition) * in my idea the "Analyzed_data" group doesn't contain multiple treatments but the result of the fit on the 'final' spectra, which are unique; if you are referring to the 'n' in the 'Shift_n_GHz' that is included in case a multipeak fit is performed. Now, if we want to include the possibility of multiple treatments like you are doing (which I didn't originally consider) we could just add an additional layer to the hierarchy * that is the amplitude of the peak from the fit. I am not sure if you didn't understand what I meant or you think it is not an useful information * The fit error actually contains 2 quantities: R2 and RMSE (as defined in the type). I am not sure how you would calculate a std from a single spectrum * the calibration curves are stored in the 'calibration_spectra' group with the name of the dataset matching the respective 'Calibration_index'. In our VIPA setup we are acquiring multiple calibration curves during a single acquisition to compensate for laser drift, that's why I introduced the possibility of having multiple calibration curves. Note that the 'Calibration_index' is defined as optional exactly because it might not be needed * each spectrum can have its own timestamp if it is acquired from a different camera image or scan of a FP, etc that's why it needs to be a dataset. Note that it is an optional dataset * good point, we can rename it to PSD * that is exactly to account for the general case of the abscissa not being a spatial coordinate and it contains the values for the parameters (e.g. the angles in an angle resolved measurement). It is a dataset whose dimensions are defined in the description (happy to elaborate more if it is not clear) * float is the type of each element; it is a dataset whose dimensions are defined in the description; the way to define the frequency axis in general for setups which don't have an absolute frequency (like VIPAs) is tricky and would be good to brainstorm about possibile solutions * as for the name we can change it, but the problem on how to deal with the situation when one doesn't have the frequency in GHz remains. My idea here was to leave the possibility of different units because the fit and most of the data analysis can be performed even if the x-axis is not in GHz and the actual conversion of the shift to GHz can be done at the end and requires the calibration data. As in my previous point, I am happy to brainstorm different solutions to this problem * it is indeed redundant with 'Analyzed_data' and I pushed a change on GitHub to correct this * see point 11; also note that the group is optional (in case people don't need it) and I introduced the attribute "same_as" to avoid repeating it multiple times if it is always the same for all the 'tn' As you see we agree with some of the points or we could find a common solution, for others it was mainly a misunderstanding on what were my intentions (probably my bad in expressing them, but you could have asked if it was not clear). Hope this helps claryfing my reasoning in the file definition and I am happy to discuss all the open points. I will look in details at your newest definition that you shared in the next days. Best, Carlo On Thu, Feb 20, 2025 at 18:25, Pierre Bouvet via Software wrote: Hi, My goal with this project is to unify the treatment of BLS spectra, to then allow us to address fundamental biophysical questions with BLS as a community in the mid-long term. Therefore my principal concern for this format is simplicity: measure are datasets called “Raw_data”, if they need one or more abscissa to be understood, this/these abscissa are called “Abscissa_i” and they are placed in groups called “Data_i” where we can store their attributes in the group’s attributes. From there, I can put groups in groups to store an experiment with different ... (e.g. : samples, time points, positions, techniques, wavelengths, patients, …). This structure is trivial but lacks usability so I added an attribute called “Name” to all groups that the user can define as he wants without impacting the structure. Now here are a few critics on Carlo’s approach. I didn’t want to share them because I hate criticizing anyone’s work, and I do think that what Carlo presented is great, but I don’t want you to think that I just trashed what he did, to the contrary, it’s because I see limitations in his approach that I tried developing another, simpler one. So here are the points I have problems with in Carlo’s approach: * The preferred type of the information on an experiment should be text as we’ll likely see new devices (like your super nice FT approach) appear in the next months/years that will require new parameters to be defined to describe them. I think we should really try not to use anything else than strings in the attributes. * The experiment information should not be defined by the HDF5 file structure but rather by a spreadsheet because everyone knows how to use Excel, and it’s way easier to edit an Excel file than an HDF5 file. * Experiment information should apply to measures and not to files, because they might vary from experiment to experiment, I think their preferred allocation is thus the attributes of the groups storing individual measures (in my approach) * The characterization of the instrument might also be experiment-dependent (if for some reason you change the tilt of a VIPA during the experiment for example), therefore having a dedicated group for it might not work for some experiments * The groups are named “tn” and the structure does not present the nomenclature of sub-groups, this is a big problem if we want to store in the same format say different samples measured at different times (the logic patch would be to have sub-groups follow the same structure so tn/tm/tl/… but it should be mentioned in the definition of the structure) * The dataset “index” in Analyzed_data is difficult to understand, what is it used for? I think it’s not useful, I would delete it. * The "spatial position" in Analyzed_data supposes that we are doing mappings. This is too restrictive for no reason, it’s better to generalize the abscissa and allow the user to specify a non-limiting parameter (the “Name” attribute for example) with whatever value he wants (position, temperature, concentration of whatever, …). A concrete example of a limit here: angle measurements, I want my data to be dependent on the angle, not the position. * Having different datasets in the same “Analyzed_data” group corresponding to the result of different treatments raises the question of where the process followed to treat the data is stored. A better approach would be to create n groups “Analyzed_data_n” with only one dataset of treated values, allowing for the process to be stored in the attributes of the group Analyzed_data_n * I don’t understand why store an array of amplitude in “Analyzed_data”, is it for the SNR? Then maybe we could name this array “SNR”? * The array “Fit_error_n” is super important but ill defined. I’d rather choose a statistical quantity like the variance, standard deviation (what I think is best), least-square error… and have it apply to both the Shift and Linewidth array as so: “Shift_std” and “Linewidth_std" * I don’t understand “Calibration_index”: where are the calibration curves? Are they in “experiment_info”? If so, we expect people to already process their calibration curves to create an array before adding them to the hdf5 file? I’m not very familiar with all devices, so I might not see the limitations here but do we ever have more than one calibration curve per measure? Could we not add it to the group as a “Calibration” dataset? Or just have one group with the calibration curve? * Timestamp is typically an attribute, it shouldn’t be present inside the group as an element. * In tn/Spectra_n , “Amplitude” is the PSD so I would call it PSD because there are other “Amplitude” datasets so it’s confusing. If it’s not the PSD, I would call it “Raw_data”. * I don’t understand what “Parameters” is meant to do in tn/Spectra_n, plus it’s not a dataset so I would put it in attributes or most likely not use it as I don’t understand what it does. * Frequency is a dataset, not a float (I think). We also need to have a place where to store the process to obtain it. In VIPA spectrometers for instance this is likely a big (the main even I think) source of error. I would put this process in attributes (as a text). * I don’t think “Unit” is useful, if we have a frequency axis, then we should define it directly in GHz, and if it’s a pixel axis, then for one we should not call it “Frequency” and then it’s better not to put anything since by default we will consider the abscissa (in absence of Frequency) as a simple range of the size of the “Amplitude” dataset. * /tn/Images: it’s a good idea, but I believe this is redundant with “Analyzed_data” (?) If it’s not then I don’t understand how we get the datasets inside it. * “Calibration_spectra” is a separate group, wouldn’t it be better to have it in “Experiment_info” in the presented structure? Also might scare off people that might not want to store a calibration file every time they create a HDF5 file (I might or might not be one of them) Like I said before, I don’t want this to be taken as more than what lead me to defining a new approach to the format. I want to state once again that Carlo's structure is complete, only it’s useful for specific instruments and applications, and difficultly applicable to other techniques and scenarios (and more lazy people like myself). Following Carlo’s mail, I’ve also completed the PDF I made to describe the structure I use in the HDF5_BLS library, I’m joining it to this email and pushing its code to GitHub (https://github.com/bio-brillouin/HDF5_BLS/blob/GUI_development/guides/Projec...), feel free to edit it and criticize it at length (I feel like I deserve it after this email I really tried not to write). Best, Pierre Pierre Bouvet, PhD Post-doctoral Fellow Medical University Vienna Department of Anatomy and Cell Biology Wahringer Straße 13, 1090 Wien, Austria On 20/2/25, at 16:12, Robert Prevedel via Software wrote: Dear all, great to see all this discussion in this thread, and thanks to especially Pierre and Carlo for driving this forward. I’ve been following the various emails and arguments closely but simply didn’t have any time to chip in due to some important committments in the past days. I understand that there was a bit of a disagreement about what the focus of this effort should be, so maybe it just helps to highlight my lab's view on this (which I just discussed in depth with Carlo and Sebastian): Our original motivation was to come up with and define a common file-format, as we regard this to be key to unify the processing and visualization of Brillouin data by the community. In this respect, we would be happy to focus our efforts on defining this format and taking care of implementing the necessary processing/visualization software and interface that allows anyone to look at the data in the same way. We also regard this to be crucial if we want to standardize the reporting of Brillouin data from diverse setups/users/applications. Therefore, at this stage it would be extremely important to agree on the structure of the file format. Carlo has proposed a very well thought-through structure for this, and it would be great to get your concrete feedback on this, as I understand this hasn’t really happened yet. To aid in this, e.g. Pierre and/or Sal could try to convert or save your standard data into this structure, and report on any difficulties or ambiguities that he encounters. Based on this I agree it’s best to meet and discuss and iron this out as a next step, however it either has to be next week (ideally Fri?), or after March 12 as I am travelling back-to-back in the meantime. Of course feel free to also meet without me for more technical discussions if this speeds up things. Either way we could then also discuss the file format etc. for the ‘raw’ data that Pierre proposed (and which is indeed very valuable as well). Let me know your thoughts, and let’s keep up the great momentum and excitement on this work! Best, Robert -- Dr. Robert Prevedel Group Leader Cell Biology and Biophysics Unit European Molecular Biology Laboratory Meyerhofstr. 1 69117 Heidelberg, Germany Phone: +49 6221 387-8722 Email: robert.prevedel@embl.de (mailto:robert.prevedel@embl.de) http://www.prevedel.embl.de (http://www.prevedel.embl.de/) On 20.02.2025, at 10:29, Carlo Bevilacqua via Software wrote: Hi Kareem, thanks for the suggestion, I agree that it is a good (and easy) way to divide the tasks! Just to be clear, it is not that I don't see the need/advantage of providing some standard treatment going from raw data to standard spectra, it is just that was not my priority when proposing the idea of a unified file format. Regarding the file format, splitting the one containing the raw data and the treatments from the one containing the spectra and the image in a standard format might be a good solution and we can always merge them at a later stage. As for the file containing the "standard" spectra, it would be very helpful if you can give some feedback on the structure I originally proposed (https://github.com/prevedel-lab/Brillouin-standard-file/blob/main/docs/Bh5_f...). Keep in mind that the idea is to be able to associate spectrum/spectra to each pixel in the image, in a way that is independent of the scanning strategy and underlaying technique. I tried to find a solution that works for the techniques I am aware of, considering the peculiarities (e.g. for most VIPA setups there is no absolute frequency axis but only relative to water). If am happy to discuss why I made some specific choices and if you see a better way to achieve the same or see things differently. Both the 3rd and the 4th of March work for me. Best, Carlo On Thu, Feb 20, 2025 at 02:50, Kareem Elsayad via Software wrote: Dear All, (and I guess especially Carlo & Pierre 😊) I understand both your (main) points concerning what this all should be, and I think this is actually perfect for dividing tasks. The format of the hf or bh5 file being where things meet and what needs to be agreed on. The thing with raw data is ofcourse that it is variable between instruments and labs, and the conversion to “standard spectra” that can then be fitted etc. is going to be unique (maybe even between experiments in same project). That said, asking people to create some complex file from their data that works with a developed software is also unlikely to get a following. So (the way I see it) there are basically two parts. Getting from raw data to h5 (or bh5) format which contains the spectra in standard format. And then the whole analysis part and visualization (GUI, pretty features, etc.). While the latter may get the spotlight, it obviously relies heavily on the former being done right. Given that there are numerous “standard” BLS setup implementations the development of software for getting from raw data to h5 I think makes sense, since the h5 will no doubt be cryptic, and creating a working h5 is not something everyone will want to program by themselves (it is not an insignificant step given we are also trying to ultimately cater to biologists). As such a software that generates the h5 files, with drag and drop features and entering system parameters, for different setups makes sense and will save many labs a headache if they don’t have a good programmer on hand. So I would suggest that Pierre & Sal lead the work on developing this, while Carlo & Sebastian lead the work on developing the analysis/interface-presentation part. This way things are nicely divided and we just need to agree on the h5 file that is transferred between the two. From the side of Pierre & Sal there could maybe also be a second h5 generated that contains all the raw data and details on how it was converted to the transferred h5 file (for complete transparency this could then also be reported in papers if people wish). These could exist as two separate programs with respective GUIs but also eventually combined to a single one. How does this sound to everyone? To clear up details and try assign tasks going forward how about a Zoom first week of March (I would be free Monday 3rd and Tue 4th after 1pm)? All the best, Kareem From: Carlo Bevilacqua via Software Reply to: Carlo Bevilacqua Date: Wednesday, 19. February 2025 at 20:43 To: Pierre Bouvet Cc: Subject: [Software] Re: [EXTERN] Re: Software manuscript / BLS microscopy Hi Pierre, I realized that we might have slightly different aims. For me the most important part of this project is to have a unified file format that can be read and visualized by a standard software. The file format you are proposing is not sufficient for that in my opinion. For example one of my main motivation was to have an interface where the user can see the reconstructed image, click on a pixel, see the corresponding spectrum to check its quality and maybe try different fitting functions; that would already not be possible with your structure because the software would have no notion on where the spectral data is stored and how to associate it to a specific pixel. I don't see the structure of the file to be too complex as an issue, as long as it is functional: we can always provide an API and/or a GUI that allow people to take their spectra and save them in whatever format we decide without bothering about understanding the actual structure, the same way you can work with HDF5 file without having any understanding on how the data is actually stored on the disk. My idea of making a webapp as a GUI follows directly from there. Typical case: I sent some data to a collaborator and they can just run the app in their browser and check if the outliers they see in the image are real or a bad spectra. Similarly if we make a common database of Brillouin spectra, people can explore it easily using the webapp. From what I understood, you are instead more interested in going from raw data to an actual spectrum, which I don't see so much as a priority because each lab has their own code already and the actual procedure would be different for each lab (apart from standard instruments like the FP). I am not saying this should not be part of the software but not as a priority and rather has a layer where people can easily implement their own code (of course we could already implement code for standard instruments). I think it would be good to cleary define what is our common aim now, so we are sure we are working in the same direction. Let me know if you agree or I misunderstood what is your idea. Best, Carlo On Wed, Feb 19, 2025 at 16:11, Pierre Bouvet wrote: Hi, I think you're trying to go too far too fast. The approach I present here (https://github.com/bio-brillouin/HDF5_BLS/blob/GUI_development/guides/Projec...) is intentionally simple, so that people can very quickly get to storing their data in a HDF5 file format together with the parameters they used to acquire them with minimal effort. The closest to what you did is therefore as follows: - data are datasets with no other restriction and they are stored in groups - each group can have a set of attribute proper to the data they are storing - attributes have a nomenclature imposed by a spreadsheet and are in the form of text - the default name of a data is the name of a raw data: “Raw_data”, other arrays can have whatever name they want (Shift_5GHz, Frequency, ...) - arrays and attributes are hierarchical, so they apply to their groups and all groups under it. This is the bare minimum to meet our needs, so we need to stop here in the definition of the format since it’s already enough to have the GUI working correctly, and therefore the first version of the unified software advertised. Of course we will have to refine things later on, but we don’t want to scare people off by presenting them a file description that for one might not match their measurements and that is extremely hard to conceptually understand. To make my point clearer, take your definition of the format for example: there are 3 different amplitude arrays in your description, two different shift arrays and width arrays that are of different dimension, then we have a calibration group on one side but a spectrometer characterization array in another group that is called “experiment_info”, that’s just too complicated to use correctly. On the other hand, placing your raw data “as is” in a group dedicated to this data is conceptually easy and straightforward. Where you are right, is that should we have hundreds of people using it, we might in a near future want to store abscissa, impulse responses, … in a standardized manner. In that case, the question falls down to either adding sub-groups or storing the data together with the measure. Both are fine and don’t really pose a problem for now, essentially because we are not trying to visualize the results but just trying to unify the way to get them. Now regarding Dash, if I understand correctly, it’s just a way to change the frontend you propose? If that’s so, why not, but then I don’t really see the benefits: if you really want to use dash, you can always embed it inside a Qt app. Also Dash being browser based, you will only have one window for the whole interface, which will be a pain to deal with if you want to use the interface to do everything the GUI is expected to do (inspect an H5 file, convert PSD, treat data, edit parameters, inspect a failed treatment, simulate results using setups with slight changes of parameters…). We agree that at one point when people receive an h5 file, it will be useful to have a web interface that can do what yours or Sal’s GUI do (seeing the mapping results together with the spectrum, eventually the time-domain signal) but here again, it’s going too far too soon: let’s first have a simple and reliable GUI that can convert data from any spectrometer to PSDs and treat them with a unified code. This is the real challenge, visualization and nomenclature of results are both important but secondary. Also keep in mind that, the frontend can easily be generated by anyone really, with Copilot or ChatGPT or whatever AI, but you can’t ask them to develop the function that will correctly read your data and convert them to a PSD nor treat the PSD. This is done on the backend and is the priority since the unification essentially happens there. Best, Pierre Pierre Bouvet, PhD Post-doctoral Fellow Medical University Vienna Department of Anatomy and Cell Biology Wahringer Straße 13, 1090 Wien, Austria On 19/2/25, at 13:21, Carlo Bevilacqua wrote: Hi Pierre, thanks for your reply. Regarding the file structure, what I am still not very clear about is what you define as Raw_data and data, how the actual spectra are stored and how the association to spatial coordinates and parameters is made. That's why I would really appreciate if you could make a document similar to what I did (https://github.com/prevedel-lab/Brillouin-standard-file/blob/main/docs/Bh5_f...), where it is clear what each group should (or can) contain, what is the shape of each dataset, which attributes they have, etc... I am not saying that this should be the final structure of the file but I strongly believe that having it written in a structured way helps defining it and seeing potential issues. Regarding the webapp, it works by separating the frontend, which run in the browser and is responsible of running the GUI, and the backend which is doing the actual computation and that you can structure as you like with multithreading or any optimization you wish. The communication between frontend and backend is handled transparently by the framework, so you don't have to take care of it. When you run Dash locally a local server is created so the data stays on your computer and there is no issue with data transfer/privacy. If we want to move it to a server at a later stage, then you are right about the fact that data needs to be transferred to a server (although there might be solutions that allow you to still run the computation on the local browser, like WebAssembly (https://webassembly.org/), but I think it is too complex to look into this at this stage). Regarding safety and privacy, the data will be stored on the server only for the time that the user is using the app and then deleted (of course we will need to make a disclaimer on the website about this). Regarding space I don't think people at the beginning will load their 1Tb dataset on the webapp but rather look at some small dataset of few tens of Gb; in that case 1Tb of server space is more than enough (remember that the file will be stored only for the time the user is using the app). If people really start to use the webapp and space becomes a limitation, I would be super happy to look into WebAssembly so that the data can be handled locally from the browser without transferring it to the server. To summarize I would agree that, at this stage, there might be no advantage of a webapp over a local GUI (and might actually be a bit more work to develop it). But, if this project really flies, the potential of a webapp is huge, especially in the context of the BioBrillouin society where we want to have a database of spectral data and the webapp could be used to explore that without downloading anything on your computer. My main point is that moving now to a webapp would not be too much work, but if we want to do it at a later stage it will basically entail re-writing everything from scratch. Let me know what are your thoughts about it. Best, Carlo On Wed, Feb 19, 2025 at 08:51, Pierre Bouvet wrote: Hi Carlo, You’re right, the format is still a little fuzzy. The main idea is to have a data-based hierarchy for storage: each data is stored in an individual group. From there, abscissa dependent on the data are stored in the same group and the treated data are stored in sub-groups. The names of the groups and sub-groups are fixed (Data_i), as is the name of the raw data (Raw_data) and abscissa (Abscissa_i). Also, the measure and spectrometer-dependent arguments have a defined nomenclature. To differentiate groups between them, we preferably attribute them a name as an attribute that is not used as an identifier, the identifier being either the path to the data/group from file root (Data_0/Data_42/Data_2/Raw_data) or potentially a hash value (not implemented). This I think allows all possible configurations, and using an hierarchical approach we can also pass common attributes and arrays (parameters of the spectrometer or abscissa arrays for example) on parent to reduce memory complexity. Now regarding the use of server-based GUI, first off, I’ve never used them so I’m just making supposition here but if the platform is able to treat data online, it will have to store the spectra somewhere in memory and it will not be local. My primary concerns with this approach is safety, particularly in terms of intellectual property protection, ethical considerations, and potential security vulnerabilities. Additionally, managing storage space will be a headache. Now, this doesn’t mean that we can’t have a server-based data plotter, or a server-based interface that does treatments locally but I don’t really see the benefits of this over a local software that can have multiple windows, which could at one point be multithreaded, and that could wrap c code to speed regressions for example (some of this might apply to Dash, I’m not super familiar with it). Now regarding memory complexity, having all the data we treat go on a server is a bad idea as it will raise the question of cost which will very rapidly become a real problem. Just an example: for a 100x100 map, I need 10Gb of memory (1Mo/point) with my setup (1To of archive storage is approximately 1euro/month) so this would get out of hands super fast assuming people use it. Now maybe there are solutions I don’t see for these problems and someone can take care of them but for me it’s just not worth the effort when having a local GUI solves all of these issues at once. But if you find a solution, then I’ll be happy to migrate to Dash, it won’t be fast to translate every feature but I can totally join you on the platform. Best, Pierre Pierre Bouvet, PhD Post-doctoral Fellow Medical University Vienna Department of Anatomy and Cell Biology Wahringer Straße 13, 1090 Wien, Austria On 18/2/25, at 20:26, Carlo Bevilacqua wrote: Hi Pierre, regarding the structure of the file, I agree that we should keep it simple. I am not suggesting to make it more complex, rather to have a document where we define it in a clear and structured way rather than as a general description, to make sure that we are all on the same page. I am saying this because, to be honest, I am not sure I fully understand how you are structuring the HDF5 and I think it is important to agree on this now, rather than finding at a later stage that we had different ideas. Ideally if the GUI should be part of a single application, we should write it using a unified framework. The reasons why, after considering it for a bit, I lean towards Dash rather than Qt are: * it can run in a web browser so it will be easy to eventually move it to a website, thus people can use it without installing it (which will hopefully help in promoting its use) * it is based on plotly (https://plotly.com/python/) which is a graphical library with very good plotting capabilites and highly customizable, that would make the data visualization easier/more appealing Let me know what you think about it and if you see any advantage of Qt over a web app which I am not considering. Also, if we agree that Dash might be a better option, would you consider migrating to Dash? It might not be too much work if most of the code you wrote is for data processing rather that for the GUI itself and I could help you with that. Alternatively one workaround is to have a QtWebEngine (https://doc.qt.io/qtforpython-6/overviews/qtwebengine-overview.html) in your Qt app and have the Dash app run inside that, but that would make only the Dash part portable to a server later on. Best, Carlo On Tue, Feb 18, 2025 at 10:24, Pierre Bouvet wrote: Hi, Thanks, More than merge them later, just keep them separate in the process and rather than trying to build "one code to do it all", build one library and GUI that encapsulate codes to do everything. Having a structure is a must but it needs to be kept as simple as possible else we’ll rapidly find situations where we need to change the structure. The middle ground I think is to force the use of hierarchies and impose nomenclatures where problem are expected to appear: each dataset has its own group, each group can encapsulate other groups, each parameter of a group applies to all its sub-groups if the subgroup does not change its value, each array of a group applies to all of its sub-groups if the sub-group does not redefine an array with same name, the names of the groups are held as parameters and their ID are managed by the software. For the Plotly interface, I don’t know how to integrate it to Qt but if you find a way to do it, that’s perfect with me :) My vision of the GUI is something that unifies the format and can then execute scripts on the data stored in this format. I have pushed the application of the GUI to my data up to the point where I can do the whole information extraction process from it (add data, convert to PSD, fit curves). I think this could be super interesting if we implement it for all techniques. I think we could formalize the project in milestones, in particular define the minimal denominator that will allow us to have the paper. The milestone I reached for my spectro encompasses the following points: - Being able to add data to the file easily (by dragging & dropping to the GUI) - Being able to assign properties to these data easily (again by dragging & dropping) - Being able to structure the added data in groups/folders/containers/however we want to call it - Making it easy for new data types to be loaded - Allowing data from same type but different structure to be added (e.g. .dat files) - Execute scripts on the data easily and allowing parameters of these scripts to be defined from the GUI (e.g. select a peak on a curve to fit this peak) - Make it easy to add scripts for treating or extracting PSD from raw data. - Allow the export of a Python code to access the data from the file (we cans see them as “break points” in the treatment pipeline) - Edit of properties inside the GUI In any case I think we could build a spec sheet for the project with what we want to have in it based on what we want to advertise in the paper. We can always add things later on but if we agree on a strict minimum to have the project advertised, then that will set its first milestone on which we’ll be able to build later on. Best, Pierre Pierre Bouvet, PhD Post-doctoral Fellow Medical University Vienna Department of Anatomy and Cell Biology Wahringer Straße 13, 1090 Wien, Austria On 17/2/25, at 14:53, Carlo Bevilacqua via Software wrote: Hi Pierre, hi Sal, thanks for sharing your thoughts about it. @Pierre I am very sorry that Ren passed away :( As far as I understood you are suggesting to work on the individual aspects separately and then merge them together at a later stage? I am fine with that but I still think it is very important to now agree on what should be in the file format we are defining, because that is kind of the core of the project and will affect a lot of the design choices. I am happy to start working on the GUI for data visualization. In my idea, it will be something similar to this (https://www.nature.com/articles/s41592-023-02054-z/figures/10) but written in dash (https://dash.plotly.com/), so it is a web app that for now can run locally (so no transfer of data to an external server is required) but in the future can easily be uploaded to a website that people can just use without installing anything on their computer. The question is how much of the data processing should be possible to do (or trigger) from the same GUI? I think at least a drop down menu with different fitting functions should be there, so the user can quickly check the results on a spectrum from a specific point in the image. @Pierre how are you envisioning the GUI you are working on? As far as I understood it is mainly to get the raw data and save it to our HDF5 format with some treatment on it. One idea could be to have a shared list of features that we are implementing in the GUI as we work on it, to avoid having the same functionality duplicated (or worst inconsistent) between the GUI for generating our file format and the GUI for visualization. Let me know what you think about it. Best, Carlo On Mon, Feb 17, 2025 at 11:04, Pierre Bouvet via Software wrote: Hi everyone, Sorry for the delayed response, I just went through the loss of Ren (my dog) and wasn’t at all able to answer. First of, Sal, I am making progress and I should have everything you have made on your branch integrated to the GUI branch soon, at which point I will push everything to main. Regarding the project, I think I align with Sal: keep things as simple as possible. My approach was to divide everything in 3 mostly independent layers: - Store data in an organized file that anyone can use, and make it easy to do - Convert these data into something that has physical significance: a Power Spectrum Density - Extract information from this Power Spectrum Density Each layer has its own challenge but they are independent on the challenge of having people using it: personally, if I had someone come to me with a new software to play with my measures, I would most likely only look at it for 1 minute (or less depending who made it) with a lot of apprehension and then based on how simple it looks and how much I understood of it, use it or - what is most likely - discard it. This is why Project.pdf (https://github.com/bio-brillouin/HDF5_BLS/blob/GUI_development/guides/Projec...) is essentially meant to say: we put data arrays in groups and give them attributes written in text, but you can also create groups within groups to organize your data! I believe most of the people in the BioBrillouin society will have the same approach and before having something complex that can do a lot, I think it’s best to have something simple that can just unify the format (which in itself is a lot) and that people can use right away with a minimal impact on their own individual pipelines for data processing. To be honest, I don’t think people will blindly trust our software at first to treat their data, but they will most likely use it at first to organize their raw spectra, and maybe add their own treated data if they are feeling particularly adventurous. But that is not a problem as long as we start a movement. From there yes, we can complexity and create custom file architectures but that is already too complex I think for this first project. If we can all just import our data to the wrapper and specify their attributes, this will already be a success. Then for the paper, if we can all add a custom code to treat these data to obtain a PSD, I think this will be enough. As I said, the current API already allows you to add your data in a variety of format, so it’s just a question of developing the PSD conversion before having something we can publish (and then tell people to use). A few extra points: - Working with my setup, I realized if the user could choose between different algorithms to treat their own data, it would make the overall project much more usable (if an algorithm bugs for whatever reason, you can use another one) so I created 2 bottle necks in the form of functions (for PSD conversion and treatment) that would inspect modules dedicated to either PSD conversion or treatment, and list existing functions. It’s in between classical and modular programming but it makes the development of new PSD conversion code and treatment way way easier - The GUI is developed using oriented-object programming. Therefore I have already made some low-level choices that kind of impact all the GUI. I’m not saying they are the best choices, I’m just saying that they work, so if you want to work on the GUI, I would either recommend getting familiar with these choices, or making sure that all the functionalities are preserved, particularly the ones that are invisible (logging of treatment steps, treatment errors…) I’ll try merging the branches on Git asap and will definitely send you all an email when it’s done :) Best, Pierre Pierre Bouvet, PhD Post-doctoral Fellow Medical University Vienna Department of Anatomy and Cell Biology Wahringer Straße 13, 1090 Wien, Austria On 14/2/25, at 19:36, Sal La Cavera Iii via Software wrote: Hi all, I agree with the things enumerated and points made by Kareem/Carlo! I guess I would advocate for starting from a position of simplicity. We probably don't want to get weighed down by trying to include a bunch of bells and whistles from the start as these can be easily added once there is a minimally viable stable product. As long as data can be loaded to local memory, then treated in various (initially simple) ways through the GUI (and maybe maintain non-GUI compatibility for command-line warriors like myself), then the bh5 formatting stuff can be sorted on the back end? I definitely agree with Carlo's structure set out in the file format document; but all of that data will be floating around the memory in some shape or form and just needs to be wrapped up and packaged (according to Carlo's structure e.g.) when the user is happy and presses the "generate h5 filestore" etc. (?) Definitely agree with the recommendation to create the alpha using mainly requirements that our 3 labs would find useful (import filetypes, treatments, etc), and then we can add on more universal functionality second / get some beta testers in from other labs etc. I'm able to support on whatever jobs need doing and am free to meet in the beginning of March like you mentioned Kareem. Hope you guys have a nice weekend, Cheers, Sal --------------------------------------------------------------- Salvatore La Cavera III Royal Academy of Engineering Research Fellow Nottingham Research Fellow Optics and Photonics Group University of Nottingham Email: salvatore.lacaveraiii@nottingham.ac.uk (mailto:salvatore.lacaveraiii@nottingham.ac.uk) ORCID iD: 0000-0003-0210-3102 (https://outlook.office.com/bookwithme/user/6a3f960a8e89429cb6fc693c01d10119@...) Book a Coffee and Research chat with me! ------------------------------------ From: Carlo Bevilacqua via Software Sent: 12 February 2025 13:31 To: Kareem Elsayad Cc: sebastian.hambura@embl.de (mailto:sebastian.hambura@embl.de) ; software@biobrillouin.org (mailto:software@biobrillouin.org) Subject: [Software] Re: Software manuscript / BLS microscopy You don't often get email from software@biobrillouin.org (mailto:software@biobrillouin.org). Learn why this is important (https://aka.ms/LearnAboutSenderIdentification) Hi Kareem, thanks for restarting this and sorry for my silence, I just came back from US and was planning to start working on this again. Could you also add Sebastian (in CC) to the mailing list? As you outlined, I would split the project into two parts: 1) getting from the raw data to some standard "processed' spectra and 2) do data analysis/visualization on that. For the second part the way I envision it is: * the most updated definition of the file format from Pierre is this one (https://github.com/bio-brillouin/HDF5_BLS/blob/GUI_development/guides/Projec...), correct? In addition to this document I think it would be good to have a more structured description of the file (like this (https://github.com/prevedel-lab/Brillouin-standard-file/blob/main/docs/Bh5_f...)), where each field is clearly defined in terms of data type and dimensions. Sebastian was also suggesting that the document should contain the reasoning behind each specific choice in the specs and also things that we considered but decided had some issues (so in future we can look back at it). I still believe that the file format should contain the "processed" spectra (i.e. after FT and baseline subtraction for impulsive, or after taking a line profile and possibly linearization with VIPA,...) so we can apply standard data processing or visualization which is independent on the actual underlaying technique (e.g. VIPA, FP, stimulated, time domain, ...) * agree on an API to read the data from our file format (most likely a Python class). For that we should: 1) decide on which information is important to extract (spectral information, spatial coordinates, hyper-parameters, metadata,...) 2) implement an interface to read the data (e.g. readSpectrumAtIndex(...), readImage(...), ...) * build a GUI that use the previously defined API to show and process the data. I would say that, once we have a very solid description of the file format as in step 1, step 2 will come naturally and we can divide the actual implementation between us. Step 3 can also easily be implemented and divided between us once we have an API (and I am happy to work on the GUI myself). The first half of the project is the trickiest and I know Pierre has already done a lot of work in that direction. We should definitely agree on which extent we can define a standard to store the raw data, given the variability between labs, (and probably we should do it for common techniques like FP or VIPA) and how to implement the treatments, leaving to possibility to load some custom code in the pipeline to do the conversion. Let me know what you all think about this. If you agree I would start by making a document which clearly defines the file format in a structured way (as in my step 1 before). @Pierre could you write a new document or modify the document I originally made (https://github.com/prevedel-lab/Brillouin-standard-file/blob/main/docs/Bh5_f...) to reflect the latest structure you implemented for the file format? The metadata can still be defined in a separated excel sheet, as long as the data type and format is well defined there. Best regards, Carlo On Wed, Feb 12, 2025 at 02:19, Kareem Elsayad via Software wrote: Hi Robert, Carlo, Sal, Pierre, Think it would be good to follow up on software project. Pierre has made some progress here and would be good to try and define tasks a little bit clearer to make progress… There is always the potential issue of having “too many cooks in the kitchen” (that have different recipes for same thing) to move forward efficiently, something that I noticed can get quite confusing/frustrating when writing software together with people. So would be good to clearly assign tasks. I talked to Pierre today and he would be happy to integrate things in framework we have to try tie things together. What would foremost be needed would be ways of treating data, meaning code that takes a raw spectral image and meta-data and converts it into “standard” format (spectral representation) that can then be fitted. Then also “plugins” that serve a specific purpose in the analysis/rendering that can be included in framework. The way I see it (and please comment if you see differently), there are ~4 steps here: * Take raw data (in .tif,, .dat, txt, etc. format) and meta data (in .cvs, xlsx, .dat, .txt, etc.) and render a standard spectral presentation. Also take provided instrument response in one of these formats and extract key parameters from this * Fit the data with drop-down menu list of functions, that will include different functional dependences and functions corrected for instrument response. * Generate/display a visual representation of results (frequency shift(s) and linewidth(s)), that is ideally interactive to some extent (and maybe has some funky features like looking at spectra at different points. These can be spatial maps and/or evolution with some other parameter (time, temperature, angle, etc.). Also be able to display maps of relative peak intensities in case of multiple peak fits, and whatever else useful you can think of. * Extract “mechanical” parameters given assigned refractive indices and densities I think the idea of fitting modified functions (e.g. corrected based on instrument response) vs. deconvolving spectra makes more sense (as can account for more complex corrections due to non-optical anomalies in future –ultimately even functional variations in vicinity of e.g. phase transitions). It is also less error prone, as systematically doing decon with non-ideal registration data can really throw you off the cliff, so to speak. My understanding is that we kind of agreed on initial meta-data reporting format. Getting from 1 to 2 will no doubt be most challenging as it is very instrument specific. So instructions will need to be written for different BLS implementations. This is a huge project if we want it to be all inclusive.. so I would suggest to focus on making it work for just a couple of modalities first would be good (e.g. crossed VIPA, time-resolved, anisotropy, and maybe some time or temperature course of one of these). Extensions should then be more easy to navigate. At one point think would be good to involve SBS specific considerations also. Think would be good to discuss a while per email to gather thoughts and opinions (and already start to share codes), and then plan a meeting beginning of March -- how does first week of March look for everyone? I created this mailing list (software@biobrillouin.org (mailto:software@biobrillouin.org)) we can use for discussion. You should all be able to post to (and it makes it easier if we bring anyone else in along the way). At moment on this mailing list is Robert, Carlo, Sal, Pierre and myself. Let me know if I should add anyone. All the best, Kareem This message and any attachment are intended solely for the addressee and may contain confidential information. If you have received this message in error, please contact the sender and delete the email and attachment. Any views or opinions expressed by the author of this email do not necessarily reflect the views of the University of Nottingham. Email communications with the University of Nottingham may be monitored where permitted by law. _______________________________________________ Software mailing list -- software@biobrillouin.org (mailto:software@biobrillouin.org) To unsubscribe send an email to software-leave@biobrillouin.org (mailto:software-leave@biobrillouin.org) _______________________________________________ Software mailing list -- software@biobrillouin.org (mailto:software@biobrillouin.org) To unsubscribe send an email to software-leave@biobrillouin.org (mailto:software-leave@biobrillouin.org) _______________________________________________ Software mailing list -- software@biobrillouin.org (mailto:software@biobrillouin.org) To unsubscribe send an email to software-leave@biobrillouin.org (mailto:software-leave@biobrillouin.org) _______________________________________________ Software mailing list -- software@biobrillouin.org (mailto:software@biobrillouin.org) To unsubscribe send an email to software-leave@biobrillouin.org (mailto:software-leave@biobrillouin.org) _______________________________________________ Software mailing list -- software@biobrillouin.org (mailto:software@biobrillouin.org) To unsubscribe send an email to software-leave@biobrillouin.org (mailto:software-leave@biobrillouin.org) _______________________________________________ Software mailing list -- software@biobrillouin.org (mailto:software@biobrillouin.org) To unsubscribe send an email to software-leave@biobrillouin.org (mailto:software-leave@biobrillouin.org) _______________________________________________ Software mailing list -- software@biobrillouin.org (mailto:software@biobrillouin.org) To unsubscribe send an email to software-leave@biobrillouin.org (mailto:software-leave@biobrillouin.org)
Hi everyone, The spec sheet I defined for the format is there <https://github.com/bio-brillouin/HDF5_BLS/blob/main/guides/SpecSheet/SpecShe...> (I thought I had pushed it already but it seems not). To make it simple, my aim is to have a simple way (emphasis on simple) to store any kind of data obtained with as many different setups as possible, follow a unified pipeline <https://github.com/bio-brillouin/HDF5_BLS/blob/main/guides/Pipeline/Pipeline...> and allow a unified treatment of the data. From this spec sheet I built this structure <https://github.com/bio-brillouin/HDF5_BLS/blob/main/guides/Project/Project.p...> which I’ve been using for a few months now and that seems robust enough, in fact what blocked me for adapting it to time-domain was not the structure but the code I already had written to implement it. Once again, visualizing data is not the priority for me, because I believe the main problem in the community today is that we don’t have a single, robust and well-characterized way of extracting information from a PSD. Best, Pierre Pierre Bouvet, PhD Post-doctoral Fellow Medical University Vienna Department of Anatomy and Cell Biology Wahringer Straße 13, 1090 Wien, Austria
On 3/3/25, at 21:32, Carlo Bevilacqua via Software <software@biobrillouin.org> wrote:
Hi all, we are still trying to find an agreement with Pierre but I think that, a part from the technicalities that we can probably figure out between ourselves, we have a different view on the aims of the file format and the project in general.
Although I agree that for now we could work with separate files and convert between them, eventually we need to agree on a format to propose as a standard and I want to avoid postponing the decision (at least for the general structure, of course minor details can change during the process). Otherwise I am afraid that, once most of the code is written, it will be hard to unify it and this will make the decision even more difficult.
What I see as the main points of this project are: to have some sort of TIFF for Brillouin data, with the main aim of storing images (i.e. spatial maps of a sample) together with the spectral data that it is used to generate them and the relevant metadata and calibration data while allowing the possibility of storing single spectra or spectra acquired in different conditions in multiple samples (i.e. having a whole study in a single file), I don't see this as a determinant in defining the file. That is because the same result can be achieved by having multiple file with a clear naming convention (e.g. ConcentrationX_TemperatureY_SampleN), which is commonly done in microscopy and I feel it is a "cleaner" solution than having everything in a single file the analysis part of the software should be able to perform standard Brillouin analysis (i.e. fit the spectra with different functions that the user can select) but possibly more advanced stuff (like PCA or non-negative matrix factorisation) the visualization part would be similar to this <https://www.nature.com/articles/s41592-023-02054-z/figures/10>, where the user can click on a pixel and see the corresponding spectrum (possibly selecting different fit functions and see the result on the fly). If multiple images are stored in the file, some dropdown menus would appear to select the relevant parameters, which identify a single image. I discussed about these points with Robert and Sebastian and we agree on them. The structure of the file I proposed (and refined with input from Pierre and Sebastian) is designed with these aims in mind.
@Pierre, can you please list your aims? I don't want write what I understood from you because I might misrapresent them.
It would be good to have your feedback on what you consider to be the main aims and priorities, so we can have the last iteration on the format, as we'd like to proceed with the actual coding.
Best regards, Carlo
On Fri, Feb 28, 2025 at 19:01, Pierre Bouvet via Software <software@biobrillouin.org <mailto:software@biobrillouin.org>> wrote: Hi everyone :)
As I told you during the meeting, I just pushed everything on Git and merged with main. You can normally clone the project and test it on your machines by running the HDF5_BLS_GUI/main.py script from base repository. If it doesn’t work, it might be an os compatibility issue on the paths, but I’m hopeful I won’t have to patch that ^^ You can quickly test it with the test data provided in tests/test_data, this will however only allow you to do the most basic things (import data and edit parameters). A first version of the parameter spreadsheet (the child of the Consensus paper) is located in “spreadsheets”. You can open this file and edit it and then export it as csv. The exported csv can be dragged and dropped into the right frame of the GUI to update all the parameters of the group or dataset that you have selected in the left frame. Naturally, this GUI is built on the hierarchical structure I propose for the HDF5 file (described in guides/Project/Project.pdf), note however that it can be adjusted to a linear approach (cf discussion of today) so see this more as a first “usability” test of a - relatively - stable version, and a way for you to make a list of everything that is wrong with the software. @ Sal: I’ll soon have the code to convert your data to PSD & frequency arrays, but I’m confident you can already use the format to store your spectra as time arrays (with abscissa) from your .dat and .con files (and .. Note that because I don’t have order of magnitudes for the parameters you use, I could only test the GUI and its usability. In case you are looking for the code for importing your data, it’s in HDF5_BLS/load_formats/load_dat.py in the “load_dat_TimeDomain” function Last thing: I located the developer guide I couldn’t find during the meeting and placed it back where I thought it was (guides/DeveloperGuide/ModuleDeveloperGuide.pdf). I’m underlining this document because this is maybe the most important one of the whole project since it’s where people that want to collaborate after it’s made public will go to. The goal of this document is to take people by the hand and help them making their additions compatible with the whole project. For now this document only talks about adding data.
Best,
Pierre
Pierre Bouvet, PhD Post-doctoral Fellow Medical University Vienna Department of Anatomy and Cell Biology Wahringer Straße 13, 1090 Wien, Austria
On 28/2/25, at 14:18, Carlo Bevilacqua via Software <software@biobrillouin.org <mailto:software@biobrillouin.org>> wrote:
Hi all,
I made a file describing the file format, you can find it here <https://github.com/bio-brillouin/HDF5_BLS/blob/main/Bh5_file_spec.md>. I think that attributes are easy to add and names of groups/datasets can be changed (if they are unclear now), so these are details that we don't need to discuss now. What I find most important to agree on now is the general structure. In that sense that are still some points under discussion between me and Pierre, but hopefully we can iron them out during the meeting.
Talk to you in a bit, Carlo
On Wed, Feb 26, 2025 at 23:56, Kareem Elsayad <kareem.elsayad@meduniwien.ac.at <mailto:kareem.elsayad@meduniwien.ac.at>> wrote: Hi Carlo,
Sounds great!
Yes, Fri 28th @3pm still works for me. If it works for others, here is Zoom we can use:
https://us02web.zoom.us/j/5191046969?pwd=alpzaldoZEd3N2ZEQ0hYZU1RR1dOdz09
Meeting ID: 519 104 6969
Passcode: jY3zH8
All the best,
kareem
From: Carlo Bevilacqua via Software <software@biobrillouin.org <mailto:software@biobrillouin.org>> Reply to: Carlo Bevilacqua <carlo.bevilacqua@embl.de <mailto:carlo.bevilacqua@embl.de>> Date: Wednesday, 26. February 2025 at 20:43 To: Kareem Elsayad <kareem.elsayad@meduniwien.ac.at <mailto:kareem.elsayad@meduniwien.ac.at>> Cc: "software@biobrillouin.org <mailto:software@biobrillouin.org>" <software@biobrillouin.org <mailto:software@biobrillouin.org>> Subject: [Software] Re: [EXTERN] Re: Software manuscript / BLS microscopy
Hi Kareem,
thank you for your email.
We are discussing with Pierre about the details of the file format and hopefully by our next meeting we will have agreed on a file format and we can divide the tasks.
If it is still an option, Friday 28th at 3pm works for me.
Best regards,
Carlo
On Mon, Feb 24, 2025 at 03:17, Kareem Elsayad <kareem.elsayad@meduniwien.ac.at <mailto:kareem.elsayad@meduniwien.ac.at>> wrote:
Dear All,
I (and Robert) were hoping there would be some consensus on this h5 file format. Let us do a Zoom on Fri 28th Feb at 15:00?
A couple of points pertaining to arguments…
Firstly, the precise structure is not worth getting into big arguments or fuss about…as long as it contains all the information needed for the analysis/representation, and all parties can work with (able to write and read knowing what is what), it ultimately doesn’t matter. In my opinion better put more (optional) stuff in if that is issue, and make it as inclusive as possible. In the end this does not need to be read by analysis/representation side, and when we go through we can decide if and what needs to be stripped. It is after all the “black box” between doing the experiment and having your final plots/images. Take a look at say a Zeiss file and try figure all that’s in it (it is not ideally structured maybe, but no biologist ever cared) – that said, I am sure their team had very similar arguments concerning structure etc.! (you have as many opinions as people). Maybe the issue is that the boundary conditions were not as well defined, but I would say at this point make them more inclusive than they need to be (empty spaces cost little memory)
Secondly, and following on from firstly. We need to simply agree and compromise to make any progress asap. Rather than building separate structures we need to add/modify a single existing structure or we might as well be working on independent projects. Carlo’s initially proposed structure seemed reasonable, maybe with some minor changes, and we should just go with that as a basis in my opinion. I would suggest that Pierre and Carlo have a Zoom together and try and come up with something that is acceptable to both. Like everything in life, this will involve making compromises. And then present it on 28th Feb. Quite simply, if there is no agreement we cannot do this project and in the end it doesn’t matter who is right or wrong.
Finally, I hope the disagreements from both sides are not seen as negative or personal attacks –it is ok to disagree (that’s why we have so many meetings!) On the plus side we are still more effective than the Austrian government (that is still deciding who should be next prime minister like half a year after elections) 😊
All the best,
Kareem
From: Pierre Bouvet via Software <software@biobrillouin.org <mailto:software@biobrillouin.org>> Reply to: Pierre Bouvet <pierre.bouvet@meduniwien.ac.at <mailto:pierre.bouvet@meduniwien.ac.at>> Date: Friday, 21. February 2025 at 11:55 To: Carlo Bevilacqua <carlo.bevilacqua@embl.de <mailto:carlo.bevilacqua@embl.de>> Cc: <software@biobrillouin.org <mailto:software@biobrillouin.org>> Subject: [Software] Re: [EXTERN] Re: Software manuscript / BLS microscopy
Hi Carlo,
Thanks for your reply, here is the next pong of this ping pong series ^^
1- I was talking indeed about the enums, but also the parameters that are defined as integers or floating point numbers and uint32. I think its easier (and that we already agreed on) having a spreadsheet with the parameters (easy to use, easy to update, easy to store and modify between two experiments using the same setup, allows to impose fixed choices for some parameters with drop-down lists, allows to detail the requirements for the attribute like its format or units and allows examples) and to just import it in the HDF5 file. >From there it’s easier to have every attribute as strings both for the import and for the concept of what an attribute is.
2- OK
3- The problem is not necessarily the number of experiments you put in the file but the number of hyper parameters you want to take into account. Let’s take an example with a doubtable sense: I want to study the effect of low-frequency temperature fluctuations on micro mechanics in active samples both eukaryote and prokaryote showing a layered structure (endothelial cells arranged in epidermis, biofilms, …) with different cell types, and as a function of aging. I would then create a file with a first range of groups for the age of the sample, then inside these groups 2 groups for eukaryote and prokaryote samples, then inside these groups N groups for the samples I’m looking at, then inside these groups M groups for the temperature fluctuations I impose, then inside these groups the individual measures I make (this is fictional, I’m scared just to think at the amount of work to have all the samples, let alone measure them), this is simply not possible with your approach I think, and even simpler experiments like to measure the Allan variance on an instrument using 2 samples is not possible with your structure I think.
4- /
5- I think the real question is what we expect to get from a wrapper: for me is to wrap the measures of a given study, to then share, link to papers, treat using new approaches… Having a structure that can wrap both a full study and an experiment is in my opinion better in the long run than forcing the format to be used with only one experiment.
6- Yes, I understand it is an identifier, but why an integer? Why not a tuple? Why not a hash? And what if there’s a bug and instead of 3 you store you store 3.0, or 2, or ‘e'? Do you imagine the amount of work to understand where this bug comes from? Assuming it’s a bug because it might very well be just an inexperienced user making a mistake and then your file is broken. The idea is good but the safer way to have this is to work with nD arrays where the dimensionality is conserved I think, or just have all the information in the same group.
7- Here again, it’s more useful for your application but many people don’t use maps, so why force them to have even an empty array for that? Plus if they need to have a dedicated array for the concentration of crosslinkers (for example), they are faced with a non-trivial solution, which means they won’t use the format.
8- Yes, we could add an additional layer, but then it means that if you don’t need it, your datasets are in plain in the group and if you need it, then you don’t have the same structure. The solution I think is to already have the treated data in a group, if you don’t need more than one group (which will be most of the time the case) then you’ll only have one group of treated data.
9- I think it’s not useful. The SNR on the other hand is useful, because in shot-noise regime it’s a marker of variance, and this is one of the ways to spot outliers from treatment (if the SNR doesn’t match the returned standard deviation on the shift of one peak, there’s a problem somewhere).
10- The std of a fit is obtained by taking the square root of the diagonalized covariant matrix returned by the fit as long as your parameters are independent (it’s super interesting actually and a little bit more complicated but it’s true enough for lorentzian, DHO, Gaussian...)
11- OK but then why not have the calibration curves placed with your measures if they are only applicable to this measure? Once again, I think having indexes that are modifiable by the user is not safe (the technical term is “idiot proof”)
12- I don’t agree, if you are capturing points at a fixed interval, then you can reconstruct the timestamp from the timestamp of the first acquisition and either the delay between two acquisitions or the timestamp of the last acquisition. Most of the time however we don’t even need this as we consider the sample to be time-invariant on the scale of our measure, so a single timestamp for all the measure is enough and is better stored as an attribute. In the special case where we are not time-invariant, then time becomes the abscissa of the measures and in that case yes, it can be a dataset, but then it’s better to not impose a fixed name for this dataset and rather let the user decide what hyper parameter is changed during he’s measure, this way the user is free to use whatever hyper parameters he feels like it.
13- OK
14- Still not clear to me. My approach is to consider an experiment to be a measure of a sample as function of one or more controlled or measured hyper parameter. So my general approach for storing experiments is have 3 files: abscissa (with the hyper parameters that vary), measure and metadata, which translates to “Raw_data”, “Abscissa_i” and attributes for this format.
15- OK, I think more than brainstorming about how to treat correctly a VIPA spectrum, we need to allow people to tell how they do it if we want this project to be used in short term, unification is a goal of this project and we will advertise it in the paper, but to be honest, I doubt people like Giuliano will run with it without second guessing it, particularly with its clinical setups, so there will be some going back and forth before we have something stable, and this means we need to allow for this back and forth to appear somewhere, I propose having it as a parameter.
16- Here I think you allow too much liberty, changing the frequency of an array to GHz is trivial and I think most people do use GHz as the unit of their frequency arrays anyway. We need to make it clear that the frequency axis is in GHz but I think we don’t need a full element for this. If you really want to specify the unit of the Frequency dataset, I would suggest putting it in its attributes in any case, and not as another element in the structure.
17- OK
18- I think it’s one way to do it but it is not intuitive: I won’t have the reflex to go check in the attributes if there is a parameter “sam_as” to see if the calibration applies to all the curves. The way I would expect it to be is using the hierarchical logic of the format: if I’m looking at a dataset in a sub-group of a group containing a calibration dataset, then I know this calibration applies to my data:
Data
|- Data_0 (group)
| |- Calibration (dataset)
| |- Data_0 (group) | | |- Raw_data (dataset)
| |- Data_1 (group) | | |- Raw_data (dataset)
|- Data_1 (group)
| |- Calibration (dataset)
| |- Data_0 (group)
| | |- Raw_data (dataset)
I think in this example most people would suppose Data/Data_0/Calibration applies both to Data/Data_0/Data_0/Raw_data and Data/Data_0/Data_1/Raw_data but not Data/Data_1/Data_0/Raw_data whose calibration is intuitively Data/Data_1/Calibration
Once again, my approach of the structure is trying to make it intuitive and most of all, simple. For instance if I place myself in the position of someone that is willing to try “just to see how it works”, I would give myself 10s to understand how I could have a file for only one measure that complies with the new (hope to be) standard. It is my opinion as I already told you before, that your approach is too complete and therefore complex, which will inevitably lead to people not using the format unless there’s a GUI to do it for them (and even then they might not use it). I don’t want to impose my vision here, and like you I have put a lot of thinking (and testing) into building the format I propose, but I’m convinced that if we go with your structure, not only will it make it hard for anyone to understand how to use it but we’ll have problems using it ourselves. I want to repeat that I don’t have the solution, I’m just confident that my approach is much easier to conceptually understand and less restrictive than yours. In any case we can agree to disagree on that, but then it’ll be good to have an alternative backend like the one I did with your format to try and use it, and see if indeed it’s better, because if it’s not and people don’t use it, I don’t want to go back to all the trouble I had building the library, docs and GUI just to try.
I don’t want to impose you anything but it would be awesome if you took the time to read the document I made and completed for you yesterday. Then you can just tell me where you think I’m missing something and you had a better solution because as you might see, I’m having problems with nearly all your structure and we can’t really use it as a starting point at this stage since most of the backend is written and the front-end is already functional for my setup (and soon Sal’s and the TFP).
Best,
Pierre
Pierre Bouvet, PhD
Post-doctoral Fellow
Medical University Vienna
Department of Anatomy and Cell Biology
Wahringer Straße 13, 1090 Wien, Austria
On 20/2/25, at 22:55, Carlo Bevilacqua <carlo.bevilacqua@embl.de <mailto:carlo.bevilacqua@embl.de>> wrote:
Hi Pierre,
thank you for your feedback. I appreciate that you took the time to go through my definition and highlighting the critical points.
I much prefer this rather than starting working with a file format where problem might arise in the future. If we understand what are the reasons behind our choices in the definition we can merge the best of the two approaches, rather than defining two "standards" for the same thing with each of them having their limitations.
I will provide an answer to each of the points you raised (I gave numbers to the points in your email below, so it is easier to reference):
I am not sure to which attribute you are referring specifically, but I am completely fine with text; I defined enums where I felt it makes sense to do so because there is a discrete number of options (one could always add elements at the end of an enum) I defined the attributes before we started working together and I am very much open to changing them so they reflect what you have in the spreadsheet; in the document defining the file format we can just state that the attributes and their type are defined in the excel sheet I did it this way because in my idea an individual HDF5 file corresponds to a single experiment. If you feel there is an advantage in keeping different experiments in the same file I am open to introduce your structure of subgroups; I honestly feel like this will only make the file unnecessarly large and different experiments would mostly not share much (apart from the metadata, which is anyway a small overhead in terms of filesize). Now of course the question is what you define as an 'experiment': for me different timepoints or measurements at different temperatures/angles/etc on the same sample are a single experiment and I defined the file so that it is possible to save them in a single file; measurements on different samples are not the same experiment in my original idea same as the point 3 same as before, I would put different samples in different files but happy to introduce your structure if you feel there is an advantage the index is used to uniquely identify an entry in the 'Analysed_data' table; it is important in the contest of reconstructing the image (see the definition of the 'tn/image' group) in my opinion spatial coordinates have a privileged role since we are doing imaging and having them well defined it is important to reconstruct the image; for different abscissas I defined the 'parameters' dataset (more in point 14). If one is not doing imaging this dataset can be set to an empty array or a single element (we can include this in the definition) in my idea the "Analyzed_data" group doesn't contain multiple treatments but the result of the fit on the 'final' spectra, which are unique; if you are referring to the 'n' in the 'Shift_n_GHz' that is included in case a multipeak fit is performed. Now, if we want to include the possibility of multiple treatments like you are doing (which I didn't originally consider) we could just add an additional layer to the hierarchy that is the amplitude of the peak from the fit. I am not sure if you didn't understand what I meant or you think it is not an useful information The fit error actually contains 2 quantities: R2 and RMSE (as defined in the type). I am not sure how you would calculate a std from a single spectrum the calibration curves are stored in the 'calibration_spectra' group with the name of the dataset matching the respective 'Calibration_index'. In our VIPA setup we are acquiring multiple calibration curves during a single acquisition to compensate for laser drift, that's why I introduced the possibility of having multiple calibration curves. Note that the 'Calibration_index' is defined as optional exactly because it might not be needed each spectrum can have its own timestamp if it is acquired from a different camera image or scan of a FP, etc that's why it needs to be a dataset. Note that it is an optional dataset good point, we can rename it to PSD that is exactly to account for the general case of the abscissa not being a spatial coordinate and it contains the values for the parameters (e.g. the angles in an angle resolved measurement). It is a dataset whose dimensions are defined in the description (happy to elaborate more if it is not clear) float is the type of each element; it is a dataset whose dimensions are defined in the description; the way to define the frequency axis in general for setups which don't have an absolute frequency (like VIPAs) is tricky and would be good to brainstorm about possibile solutions as for the name we can change it, but the problem on how to deal with the situation when one doesn't have the frequency in GHz remains. My idea here was to leave the possibility of different units because the fit and most of the data analysis can be performed even if the x-axis is not in GHz and the actual conversion of the shift to GHz can be done at the end and requires the calibration data. As in my previous point, I am happy to brainstorm different solutions to this problem it is indeed redundant with 'Analyzed_data' and I pushed a change on GitHub to correct this see point 11; also note that the group is optional (in case people don't need it) and I introduced the attribute "same_as" to avoid repeating it multiple times if it is always the same for all the 'tn' As you see we agree with some of the points or we could find a common solution, for others it was mainly a misunderstanding on what were my intentions (probably my bad in expressing them, but you could have asked if it was not clear).
Hope this helps claryfing my reasoning in the file definition and I am happy to discuss all the open points.
I will look in details at your newest definition that you shared in the next days.
Best,
Carlo
On Thu, Feb 20, 2025 at 18:25, Pierre Bouvet via Software <software@biobrillouin.org <mailto:software@biobrillouin.org>> wrote:
Hi,
My goal with this project is to unify the treatment of BLS spectra, to then allow us to address fundamental biophysical questions with BLS as a community in the mid-long term. Therefore my principal concern for this format is simplicity: measure are datasets called “Raw_data”, if they need one or more abscissa to be understood, this/these abscissa are called “Abscissa_i” and they are placed in groups called “Data_i” where we can store their attributes in the group’s attributes. From there, I can put groups in groups to store an experiment with different ... (e.g. : samples, time points, positions, techniques, wavelengths, patients, …). This structure is trivial but lacks usability so I added an attribute called “Name” to all groups that the user can define as he wants without impacting the structure.
Now here are a few critics on Carlo’s approach. I didn’t want to share them because I hate criticizing anyone’s work, and I do think that what Carlo presented is great, but I don’t want you to think that I just trashed what he did, to the contrary, it’s because I see limitations in his approach that I tried developing another, simpler one. So here are the points I have problems with in Carlo’s approach:
The preferred type of the information on an experiment should be text as we’ll likely see new devices (like your super nice FT approach) appear in the next months/years that will require new parameters to be defined to describe them. I think we should really try not to use anything else than strings in the attributes. The experiment information should not be defined by the HDF5 file structure but rather by a spreadsheet because everyone knows how to use Excel, and it’s way easier to edit an Excel file than an HDF5 file. Experiment information should apply to measures and not to files, because they might vary from experiment to experiment, I think their preferred allocation is thus the attributes of the groups storing individual measures (in my approach) The characterization of the instrument might also be experiment-dependent (if for some reason you change the tilt of a VIPA during the experiment for example), therefore having a dedicated group for it might not work for some experiments The groups are named “tn” and the structure does not present the nomenclature of sub-groups, this is a big problem if we want to store in the same format say different samples measured at different times (the logic patch would be to have sub-groups follow the same structure so tn/tm/tl/… but it should be mentioned in the definition of the structure) The dataset “index” in Analyzed_data is difficult to understand, what is it used for? I think it’s not useful, I would delete it. The "spatial position" in Analyzed_data supposes that we are doing mappings. This is too restrictive for no reason, it’s better to generalize the abscissa and allow the user to specify a non-limiting parameter (the “Name” attribute for example) with whatever value he wants (position, temperature, concentration of whatever, …). A concrete example of a limit here: angle measurements, I want my data to be dependent on the angle, not the position. Having different datasets in the same “Analyzed_data” group corresponding to the result of different treatments raises the question of where the process followed to treat the data is stored. A better approach would be to create n groups “Analyzed_data_n” with only one dataset of treated values, allowing for the process to be stored in the attributes of the group Analyzed_data_n I don’t understand why store an array of amplitude in “Analyzed_data”, is it for the SNR? Then maybe we could name this array “SNR”? The array “Fit_error_n” is super important but ill defined. I’d rather choose a statistical quantity like the variance, standard deviation (what I think is best), least-square error… and have it apply to both the Shift and Linewidth array as so: “Shift_std” and “Linewidth_std" I don’t understand “Calibration_index”: where are the calibration curves? Are they in “experiment_info”? If so, we expect people to already process their calibration curves to create an array before adding them to the hdf5 file? I’m not very familiar with all devices, so I might not see the limitations here but do we ever have more than one calibration curve per measure? Could we not add it to the group as a “Calibration” dataset? Or just have one group with the calibration curve? Timestamp is typically an attribute, it shouldn’t be present inside the group as an element. In tn/Spectra_n , “Amplitude” is the PSD so I would call it PSD because there are other “Amplitude” datasets so it’s confusing. If it’s not the PSD, I would call it “Raw_data”. I don’t understand what “Parameters” is meant to do in tn/Spectra_n, plus it’s not a dataset so I would put it in attributes or most likely not use it as I don’t understand what it does. Frequency is a dataset, not a float (I think). We also need to have a place where to store the process to obtain it. In VIPA spectrometers for instance this is likely a big (the main even I think) source of error. I would put this process in attributes (as a text). I don’t think “Unit” is useful, if we have a frequency axis, then we should define it directly in GHz, and if it’s a pixel axis, then for one we should not call it “Frequency” and then it’s better not to put anything since by default we will consider the abscissa (in absence of Frequency) as a simple range of the size of the “Amplitude” dataset. /tn/Images: it’s a good idea, but I believe this is redundant with “Analyzed_data” (?) If it’s not then I don’t understand how we get the datasets inside it. “Calibration_spectra” is a separate group, wouldn’t it be better to have it in “Experiment_info” in the presented structure? Also might scare off people that might not want to store a calibration file every time they create a HDF5 file (I might or might not be one of them) Like I said before, I don’t want this to be taken as more than what lead me to defining a new approach to the format. I want to state once again that Carlo's structure is complete, only it’s useful for specific instruments and applications, and difficultly applicable to other techniques and scenarios (and more lazy people like myself).
Following Carlo’s mail, I’ve also completed the PDF I made to describe the structure I use in the HDF5_BLS library, I’m joining it to this email and pushing its code to GitHub <https://github.com/bio-brillouin/HDF5_BLS/blob/GUI_development/guides/Projec...>, feel free to edit it and criticize it at length (I feel like I deserve it after this email I really tried not to write).
Best,
Pierre
Pierre Bouvet, PhD
Post-doctoral Fellow
Medical University Vienna
Department of Anatomy and Cell Biology
Wahringer Straße 13, 1090 Wien, Austria
On 20/2/25, at 16:12, Robert Prevedel via Software <software@biobrillouin.org <mailto:software@biobrillouin.org>> wrote:
Dear all,
great to see all this discussion in this thread, and thanks to especially Pierre and Carlo for driving this forward. I’ve been following the various emails and arguments closely but simply didn’t have any time to chip in due to some important committments in the past days.
I understand that there was a bit of a disagreement about what the focus of this effort should be, so maybe it just helps to highlight my lab's view on this (which I just discussed in depth with Carlo and Sebastian):
Our original motivation was to come up with and define a common file-format, as we regard this to be key to unify the processing and visualization of Brillouin data by the community. In this respect, we would be happy to focus our efforts on defining this format and taking care of implementing the necessary processing/visualization software and interface that allows anyone to look at the data in the same way. We also regard this to be crucial if we want to standardize the reporting of Brillouin data from diverse setups/users/applications.
Therefore, at this stage it would be extremely important to agree on the structure of the file format. Carlo has proposed a very well thought-through structure for this, and it would be great to get your concrete feedback on this, as I understand this hasn’t really happened yet. To aid in this, e.g. Pierre and/or Sal could try to convert or save your standard data into this structure, and report on any difficulties or ambiguities that he encounters.
Based on this I agree it’s best to meet and discuss and iron this out as a next step, however it either has to be next week (ideally Fri?), or after March 12 as I am travelling back-to-back in the meantime. Of course feel free to also meet without me for more technical discussions if this speeds up things. Either way we could then also discuss the file format etc. for the ‘raw’ data that Pierre proposed (and which is indeed very valuable as well).
Let me know your thoughts, and let’s keep up the great momentum and excitement on this work!
Best,
Robert
--
Dr. Robert Prevedel
Group Leader
Cell Biology and Biophysics Unit
European Molecular Biology Laboratory
Meyerhofstr. 1
69117 Heidelberg, Germany
Phone: +49 6221 387-8722
Email: robert.prevedel@embl.de <mailto:robert.prevedel@embl.de>
http://www.prevedel.embl.de <http://www.prevedel.embl.de/>
On 20.02.2025, at 10:29, Carlo Bevilacqua via Software <software@biobrillouin.org <mailto:software@biobrillouin.org>> wrote:
Hi Kareem,
thanks for the suggestion, I agree that it is a good (and easy) way to divide the tasks! Just to be clear, it is not that I don't see the need/advantage of providing some standard treatment going from raw data to standard spectra, it is just that was not my priority when proposing the idea of a unified file format.
Regarding the file format, splitting the one containing the raw data and the treatments from the one containing the spectra and the image in a standard format might be a good solution and we can always merge them at a later stage.
As for the file containing the "standard" spectra, it would be very helpful if you can give some feedback on the structure I originally proposed <https://github.com/prevedel-lab/Brillouin-standard-file/blob/main/docs/Bh5_f...>. Keep in mind that the idea is to be able to associate spectrum/spectra to each pixel in the image, in a way that is independent of the scanning strategy and underlaying technique. I tried to find a solution that works for the techniques I am aware of, considering the peculiarities (e.g. for most VIPA setups there is no absolute frequency axis but only relative to water). If am happy to discuss why I made some specific choices and if you see a better way to achieve the same or see things differently.
Both the 3rd and the 4th of March work for me.
Best,
Carlo
On Thu, Feb 20, 2025 at 02:50, Kareem Elsayad via Software <software@biobrillouin.org <mailto:software@biobrillouin.org>> wrote:
Dear All, (and I guess especially Carlo & Pierre 😊)
I understand both your (main) points concerning what this all should be, and I think this is actually perfect for dividing tasks. The format of the hf or bh5 file being where things meet and what needs to be agreed on.
The thing with raw data is ofcourse that it is variable between instruments and labs, and the conversion to “standard spectra” that can then be fitted etc. is going to be unique (maybe even between experiments in same project). That said, asking people to create some complex file from their data that works with a developed software is also unlikely to get a following.
So (the way I see it) there are basically two parts. Getting from raw data to h5 (or bh5) format which contains the spectra in standard format. And then the whole analysis part and visualization (GUI, pretty features, etc.).
While the latter may get the spotlight, it obviously relies heavily on the former being done right. Given that there are numerous “standard” BLS setup implementations the development of software for getting from raw data to h5 I think makes sense, since the h5 will no doubt be cryptic, and creating a working h5 is not something everyone will want to program by themselves (it is not an insignificant step given we are also trying to ultimately cater to biologists). As such a software that generates the h5 files, with drag and drop features and entering system parameters, for different setups makes sense and will save many labs a headache if they don’t have a good programmer on hand.
So I would suggest that Pierre & Sal lead the work on developing this, while Carlo & Sebastian lead the work on developing the analysis/interface-presentation part. This way things are nicely divided and we just need to agree on the h5 file that is transferred between the two. From the side of Pierre & Sal there could maybe also be a second h5 generated that contains all the raw data and details on how it was converted to the transferred h5 file (for complete transparency this could then also be reported in papers if people wish). These could exist as two separate programs with respective GUIs but also eventually combined to a single one.
How does this sound to everyone?
To clear up details and try assign tasks going forward how about a Zoom first week of March (I would be free Monday 3rd and Tue 4th after 1pm)?
All the best,
Kareem
From: Carlo Bevilacqua via Software <software@biobrillouin.org <mailto:software@biobrillouin.org>> Reply to: Carlo Bevilacqua <carlo.bevilacqua@embl.de <mailto:carlo.bevilacqua@embl.de>> Date: Wednesday, 19. February 2025 at 20:43 To: Pierre Bouvet <pierre.bouvet@meduniwien.ac.at <mailto:pierre.bouvet@meduniwien.ac.at>> Cc: <software@biobrillouin.org <mailto:software@biobrillouin.org>> Subject: [Software] Re: [EXTERN] Re: Software manuscript / BLS microscopy
Hi Pierre,
I realized that we might have slightly different aims.
For me the most important part of this project is to have a unified file format that can be read and visualized by a standard software. The file format you are proposing is not sufficient for that in my opinion. For example one of my main motivation was to have an interface where the user can see the reconstructed image, click on a pixel, see the corresponding spectrum to check its quality and maybe try different fitting functions; that would already not be possible with your structure because the software would have no notion on where the spectral data is stored and how to associate it to a specific pixel.
I don't see the structure of the file to be too complex as an issue, as long as it is functional: we can always provide an API and/or a GUI that allow people to take their spectra and save them in whatever format we decide without bothering about understanding the actual structure, the same way you can work with HDF5 file without having any understanding on how the data is actually stored on the disk.
My idea of making a webapp as a GUI follows directly from there. Typical case: I sent some data to a collaborator and they can just run the app in their browser and check if the outliers they see in the image are real or a bad spectra. Similarly if we make a common database of Brillouin spectra, people can explore it easily using the webapp.
From what I understood, you are instead more interested in going from raw data to an actual spectrum, which I don't see so much as a priority because each lab has their own code already and the actual procedure would be different for each lab (apart from standard instruments like the FP). I am not saying this should not be part of the software but not as a priority and rather has a layer where people can easily implement their own code (of course we could already implement code for standard instruments).
I think it would be good to cleary define what is our common aim now, so we are sure we are working in the same direction.
Let me know if you agree or I misunderstood what is your idea.
Best,
Carlo
On Wed, Feb 19, 2025 at 16:11, Pierre Bouvet <pierre.bouvet@meduniwien.ac.at <mailto:pierre.bouvet@meduniwien.ac.at>> wrote:
Hi,
I think you're trying to go too far too fast. The approach I present here <https://github.com/bio-brillouin/HDF5_BLS/blob/GUI_development/guides/Projec...> is intentionally simple, so that people can very quickly get to storing their data in a HDF5 file format together with the parameters they used to acquire them with minimal effort. The closest to what you did is therefore as follows:
- data are datasets with no other restriction and they are stored in groups
- each group can have a set of attribute proper to the data they are storing
- attributes have a nomenclature imposed by a spreadsheet and are in the form of text
- the default name of a data is the name of a raw data: “Raw_data”, other arrays can have whatever name they want (Shift_5GHz, Frequency, ...)
- arrays and attributes are hierarchical, so they apply to their groups and all groups under it.
This is the bare minimum to meet our needs, so we need to stop here in the definition of the format since it’s already enough to have the GUI working correctly, and therefore the first version of the unified software advertised. Of course we will have to refine things later on, but we don’t want to scare people off by presenting them a file description that for one might not match their measurements and that is extremely hard to conceptually understand. To make my point clearer, take your definition of the format for example: there are 3 different amplitude arrays in your description, two different shift arrays and width arrays that are of different dimension, then we have a calibration group on one side but a spectrometer characterization array in another group that is called “experiment_info”, that’s just too complicated to use correctly. On the other hand, placing your raw data “as is” in a group dedicated to this data is conceptually easy and straightforward.
Where you are right, is that should we have hundreds of people using it, we might in a near future want to store abscissa, impulse responses, … in a standardized manner. In that case, the question falls down to either adding sub-groups or storing the data together with the measure. Both are fine and don’t really pose a problem for now, essentially because we are not trying to visualize the results but just trying to unify the way to get them.
Now regarding Dash, if I understand correctly, it’s just a way to change the frontend you propose? If that’s so, why not, but then I don’t really see the benefits: if you really want to use dash, you can always embed it inside a Qt app. Also Dash being browser based, you will only have one window for the whole interface, which will be a pain to deal with if you want to use the interface to do everything the GUI is expected to do (inspect an H5 file, convert PSD, treat data, edit parameters, inspect a failed treatment, simulate results using setups with slight changes of parameters…). We agree that at one point when people receive an h5 file, it will be useful to have a web interface that can do what yours or Sal’s GUI do (seeing the mapping results together with the spectrum, eventually the time-domain signal) but here again, it’s going too far too soon: let’s first have a simple and reliable GUI that can convert data from any spectrometer to PSDs and treat them with a unified code. This is the real challenge, visualization and nomenclature of results are both important but secondary. Also keep in mind that, the frontend can easily be generated by anyone really, with Copilot or ChatGPT or whatever AI, but you can’t ask them to develop the function that will correctly read your data and convert them to a PSD nor treat the PSD. This is done on the backend and is the priority since the unification essentially happens there.
Best,
Pierre
Pierre Bouvet, PhD
Post-doctoral Fellow
Medical University Vienna
Department of Anatomy and Cell Biology
Wahringer Straße 13, 1090 Wien, Austria
On 19/2/25, at 13:21, Carlo Bevilacqua <carlo.bevilacqua@embl.de <mailto:carlo.bevilacqua@embl.de>> wrote:
Hi Pierre,
thanks for your reply.
Regarding the file structure, what I am still not very clear about is what you define as Raw_data and data, how the actual spectra are stored and how the association to spatial coordinates and parameters is made. That's why I would really appreciate if you could make a document similar towhat I did <https://github.com/prevedel-lab/Brillouin-standard-file/blob/main/docs/Bh5_f...>, where it is clear what each group should (or can) contain, what is the shape of each dataset, which attributes they have, etc...
I am not saying that this should be the final structure of the file but I strongly believe that having it written in a structured way helps defining it and seeing potential issues.
Regarding the webapp, it works by separating the frontend, which run in the browser and is responsible of running the GUI, and the backend which is doing the actual computation and that you can structure as you like with multithreading or any optimization you wish. The communication between frontend and backend is handled transparently by the framework, so you don't have to take care of it.
When you run Dash locally a local server is created so the data stays on your computer and there is no issue with data transfer/privacy.
If we want to move it to a server at a later stage, then you are right about the fact that data needs to be transferred to a server (although there might be solutions that allow you to still run the computation on the local browser, likeWebAssembly <https://webassembly.org/>, but I think it is too complex to look into this at this stage). Regarding safety and privacy, the data will be stored on the server only for the time that the user is using the app and then deleted (of course we will need to make a disclaimer on the website about this). Regarding space I don't think people at the beginning will load their 1Tb dataset on the webapp but rather look at some small dataset of few tens of Gb; in that case 1Tb of server space is more than enough (remember that the file will be stored only for the time the user is using the app). If people really start to use the webapp and space becomes a limitation, I would be super happy to look into WebAssembly so that the data can be handled locally from the browser without transferring it to the server.
To summarize I would agree that, at this stage, there might be no advantage of a webapp over a local GUI (and might actually be a bit more work to develop it). But, if this project really flies, the potential of a webapp is huge, especially in the context of the BioBrillouin society where we want to have a database of spectral data and the webapp could be used to explore that without downloading anything on your computer. My main point is that moving now to a webapp would not be too much work, but if we want to do it at a later stage it will basically entail re-writing everything from scratch.
Let me know what are your thoughts about it.
Best,
Carlo
On Wed, Feb 19, 2025 at 08:51, Pierre Bouvet <pierre.bouvet@meduniwien.ac.at <mailto:pierre.bouvet@meduniwien.ac.at>> wrote:
Hi Carlo,
You’re right, the format is still a little fuzzy. The main idea is to have a data-based hierarchy for storage: each data is stored in an individual group. From there, abscissa dependent on the data are stored in the same group and the treated data are stored in sub-groups. The names of the groups and sub-groups are fixed (Data_i), as is the name of the raw data (Raw_data) and abscissa (Abscissa_i). Also, the measure and spectrometer-dependent arguments have a defined nomenclature. To differentiate groups between them, we preferably attribute them a name as an attribute that is not used as an identifier, the identifier being either the path to the data/group from file root (Data_0/Data_42/Data_2/Raw_data) or potentially a hash value (not implemented). This I think allows all possible configurations, and using an hierarchical approach we can also pass common attributes and arrays (parameters of the spectrometer or abscissa arrays for example) on parent to reduce memory complexity.
Now regarding the use of server-based GUI, first off, I’ve never used them so I’m just making supposition here but if the platform is able to treat data online, it will have to store the spectra somewhere in memory and it will not be local. My primary concerns with this approach is safety, particularly in terms of intellectual property protection, ethical considerations, and potential security vulnerabilities. Additionally, managing storage space will be a headache.
Now, this doesn’t mean that we can’t have a server-based data plotter, or a server-based interface that does treatments locally but I don’t really see the benefits of this over a local software that can have multiple windows, which could at one point be multithreaded, and that could wrap c code to speed regressions for example (some of this might apply to Dash, I’m not super familiar with it). Now regarding memory complexity, having all the data we treat go on a server is a bad idea as it will raise the question of cost which will very rapidly become a real problem. Just an example: for a 100x100 map, I need 10Gb of memory (1Mo/point) with my setup (1To of archive storage is approximately 1euro/month) so this would get out of hands super fast assuming people use it.
Now maybe there are solutions I don’t see for these problems and someone can take care of them but for me it’s just not worth the effort when having a local GUI solves all of these issues at once. But if you find a solution, then I’ll be happy to migrate to Dash, it won’t be fast to translate every feature but I can totally join you on the platform.
Best,
Pierre
Pierre Bouvet, PhD
Post-doctoral Fellow
Medical University Vienna
Department of Anatomy and Cell Biology
Wahringer Straße 13, 1090 Wien, Austria
On 18/2/25, at 20:26, Carlo Bevilacqua <carlo.bevilacqua@embl.de <mailto:carlo.bevilacqua@embl.de>> wrote:
Hi Pierre,
regarding the structure of the file, I agree that we should keep it simple. I am not suggesting to make it more complex, rather to have a document where we define it in a clear and structured way rather than as a general description, to make sure that we are all on the same page.
I am saying this because, to be honest, I am not sure I fully understand how you are structuring the HDF5 and I think it is important to agree on this now, rather than finding at a later stage that we had different ideas.
Ideally if the GUI should be part of a single application, we should write it using a unified framework.
The reasons why, after considering it for a bit, I lean towards Dash rather than Qt are:
it can run in a web browser so it will be easy to eventually move it to a website, thus people can use it without installing it (which will hopefully help in promoting its use) it is based onplotly <https://plotly.com/python/>which is a graphical library with very good plotting capabilites and highly customizable, that would make the data visualization easier/more appealing Let me know what you think about it and if you see any advantage of Qt over a web app which I am not considering. Also, if we agree that Dash might be a better option, would you consider migrating to Dash? It might not be too much work if most of the code you wrote is for data processing rather that for the GUI itself and I could help you with that. Alternatively one workaround is to have a QtWebEngine <https://doc.qt.io/qtforpython-6/overviews/qtwebengine-overview.html> in your Qt app and have the Dash app run inside that, but that would make only the Dash part portable to a server later on.
Best,
Carlo
On Tue, Feb 18, 2025 at 10:24, Pierre Bouvet <pierre.bouvet@meduniwien.ac.at <mailto:pierre.bouvet@meduniwien.ac.at>> wrote:
Hi,
Thanks,
More than merge them later, just keep them separate in the process and rather than trying to build "one code to do it all", build one library and GUI that encapsulate codes to do everything.
Having a structure is a must but it needs to be kept as simple as possible else we’ll rapidly find situations where we need to change the structure. The middle ground I think is to force the use of hierarchies and impose nomenclatures where problem are expected to appear: each dataset has its own group, each group can encapsulate other groups, each parameter of a group applies to all its sub-groups if the subgroup does not change its value, each array of a group applies to all of its sub-groups if the sub-group does not redefine an array with same name, the names of the groups are held as parameters and their ID are managed by the software.
For the Plotly interface, I don’t know how to integrate it to Qt but if you find a way to do it, that’s perfect with me :)
My vision of the GUI is something that unifies the format and can then execute scripts on the data stored in this format. I have pushed the application of the GUI to my data up to the point where I can do the whole information extraction process from it (add data, convert to PSD, fit curves). I think this could be super interesting if we implement it for all techniques.
I think we could formalize the project in milestones, in particular define the minimal denominator that will allow us to have the paper. The milestone I reached for my spectro encompasses the following points:
- Being able to add data to the file easily (by dragging & dropping to the GUI)
- Being able to assign properties to these data easily (again by dragging & dropping)
- Being able to structure the added data in groups/folders/containers/however we want to call it
- Making it easy for new data types to be loaded
- Allowing data from same type but different structure to be added (e.g. .dat files)
- Execute scripts on the data easily and allowing parameters of these scripts to be defined from the GUI (e.g. select a peak on a curve to fit this peak)
- Make it easy to add scripts for treating or extracting PSD from raw data.
- Allow the export of a Python code to access the data from the file (we cans see them as “break points” in the treatment pipeline)
- Edit of properties inside the GUI
In any case I think we could build a spec sheet for the project with what we want to have in it based on what we want to advertise in the paper. We can always add things later on but if we agree on a strict minimum to have the project advertised, then that will set its first milestone on which we’ll be able to build later on.
Best,
Pierre
Pierre Bouvet, PhD
Post-doctoral Fellow
Medical University Vienna
Department of Anatomy and Cell Biology
Wahringer Straße 13, 1090 Wien, Austria
On 17/2/25, at 14:53, Carlo Bevilacqua via Software <software@biobrillouin.org <mailto:software@biobrillouin.org>> wrote:
Hi Pierre, hi Sal,
thanks for sharing your thoughts about it.
@Pierre I am very sorry that Ren passed away :(
As far as I understood you are suggesting to work on the individual aspects separately and then merge them together at a later stage? I am fine with that but I still think it is very important to now agree on what should be in the file format we are defining, because that is kind of the core of the project and will affect a lot of the design choices.
I am happy to start working on the GUI for data visualization. In my idea, it will be something similar tothis <https://www.nature.com/articles/s41592-023-02054-z/figures/10>but written indash <https://dash.plotly.com/>, so it is a web app that for now can run locally (so no transfer of data to an external server is required) but in the future can easily be uploaded to a website that people can just use without installing anything on their computer.
The question is how much of the data processing should be possible to do (or trigger) from the same GUI? I think at least a drop down menu with different fitting functions should be there, so the user can quickly check the results on a spectrum from a specific point in the image.
@Pierre how are you envisioning the GUI you are working on? As far as I understood it is mainly to get the raw data and save it to our HDF5 format with some treatment on it.
One idea could be to have a shared list of features that we are implementing in the GUI as we work on it, to avoid having the same functionality duplicated (or worst inconsistent) between the GUI for generating our file format and the GUI for visualization.
Let me know what you think about it.
Best,
Carlo
On Mon, Feb 17, 2025 at 11:04, Pierre Bouvet via Software <software@biobrillouin.org <mailto:software@biobrillouin.org>> wrote:
Hi everyone,
Sorry for the delayed response, I just went through the loss of Ren (my dog) and wasn’t at all able to answer.
First of, Sal, I am making progress and I should have everything you have made on your branch integrated to the GUI branch soon, at which point I will push everything to main.
Regarding the project, I think I align with Sal: keep things as simple as possible. My approach was to divide everything in 3 mostly independent layers:
- Store data in an organized file that anyone can use, and make it easy to do
- Convert these data into something that has physical significance: a Power Spectrum Density
- Extract information from this Power Spectrum Density
Each layer has its own challenge but they are independent on the challenge of having people using it: personally, if I had someone come to me with a new software to play with my measures, I would most likely only look at it for 1 minute (or less depending who made it) with a lot of apprehension and then based on how simple it looks and how much I understood of it, use it or - what is most likely - discard it. This is why Project.pdf <https://github.com/bio-brillouin/HDF5_BLS/blob/GUI_development/guides/Projec...> is essentially meant to say: we put data arrays in groups and give them attributes written in text, but you can also create groups within groups to organize your data!
I believe most of the people in the BioBrillouin society will have the same approach and before having something complex that can do a lot, I think it’s best to have something simple that can just unify the format (which in itself is a lot) and that people can use right away with a minimal impact on their own individual pipelines for data processing.
To be honest, I don’t think people will blindly trust our software at first to treat their data, but they will most likely use it at first to organize their raw spectra, and maybe add their own treated data if they are feeling particularly adventurous. But that is not a problem as long as we start a movement. From there yes, we can complexity and create custom file architectures but that is already too complex I think for this first project.
If we can all just import our data to the wrapper and specify their attributes, this will already be a success. Then for the paper, if we can all add a custom code to treat these data to obtain a PSD, I think this will be enough. As I said, the current API already allows you to add your data in a variety of format, so it’s just a question of developing the PSD conversion before having something we can publish (and then tell people to use).
A few extra points:
- Working with my setup, I realized if the user could choose between different algorithms to treat their own data, it would make the overall project much more usable (if an algorithm bugs for whatever reason, you can use another one) so I created 2 bottle necks in the form of functions (for PSD conversion and treatment) that would inspect modules dedicated to either PSD conversion or treatment, and list existing functions. It’s in between classical and modular programming but it makes the development of new PSD conversion code and treatment way way easier
- The GUI is developed using oriented-object programming. Therefore I have already made some low-level choices that kind of impact all the GUI. I’m not saying they are the best choices, I’m just saying that they work, so if you want to work on the GUI, I would either recommend getting familiar with these choices, or making sure that all the functionalities are preserved, particularly the ones that are invisible (logging of treatment steps, treatment errors…)
I’ll try merging the branches on Git asap and will definitely send you all an email when it’s done :)
Best,
Pierre
Pierre Bouvet, PhD
Post-doctoral Fellow
Medical University Vienna
Department of Anatomy and Cell Biology
Wahringer Straße 13, 1090 Wien, Austria
On 14/2/25, at 19:36, Sal La Cavera Iii via Software <software@biobrillouin.org <mailto:software@biobrillouin.org>> wrote:
Hi all,
I agree with the things enumerated and points made by Kareem/Carlo! I guess I would advocate for starting from a position of simplicity. We probably don't want to get weighed down by trying to include a bunch of bells and whistles from the start as these can be easily added once there is a minimally viable stable product.
As long as data can be loaded to local memory, then treated in various (initially simple) ways through the GUI (and maybe maintain non-GUI compatibility for command-line warriors like myself), then the bh5 formatting stuff can be sorted on the back end? I definitely agree with Carlo's structure set out in the file format document; but all of that data will be floating around the memory in some shape or form and just needs to be wrapped up and packaged (according to Carlo's structure e.g.) when the user is happy and presses the "generate h5 filestore" etc. (?)
Definitely agree with the recommendation to create the alpha using mainly requirements that our 3 labs would find useful (import filetypes, treatments, etc), and then we can add on more universal functionality second / get some beta testers in from other labs etc.
I'm able to support on whatever jobs need doing and am free to meet in the beginning of March like you mentioned Kareem.
Hope you guys have a nice weekend,
Cheers,
Sal
---------------------------------------------------------------
Salvatore La Cavera III
Royal Academy of Engineering Research Fellow
Nottingham Research Fellow
Optics and Photonics Group
University of Nottingham Email: salvatore.lacaveraiii@nottingham.ac.uk <mailto:salvatore.lacaveraiii@nottingham.ac.uk> ORCID iD: 0000-0003-0210-3102
<Outlook-tygjxucs.png> <https://outlook.office.com/bookwithme/user/6a3f960a8e89429cb6fc693c01d10119@...>
Book a Coffee and Research chat with me!
From: Carlo Bevilacqua via Software <software@biobrillouin.org <mailto:software@biobrillouin.org>> Sent: 12 February 2025 13:31 To: Kareem Elsayad <kareem.elsayad@meduniwien.ac.at <mailto:kareem.elsayad@meduniwien.ac.at>> Cc: sebastian.hambura@embl.de <mailto:sebastian.hambura@embl.de> <sebastian.hambura@embl.de <mailto:sebastian.hambura@embl.de>>; software@biobrillouin.org <mailto:software@biobrillouin.org> <software@biobrillouin.org <mailto:software@biobrillouin.org>> Subject: [Software] Re: Software manuscript / BLS microscopy
You don't often get email from software@biobrillouin.org <mailto:software@biobrillouin.org>. Learn why this is important <https://aka.ms/LearnAboutSenderIdentification>
Hi Kareem,
thanks for restarting this and sorry for my silence, I just came back from US and was planning to start working on this again.
Could you also add Sebastian (in CC) to the mailing list?
As you outlined, I would split the project into two parts: 1) getting from the raw data to some standard "processed' spectra and 2) do data analysis/visualization on that. For the second part the way I envision it is:
the most updated definition of the file format from Pierre is this one <https://github.com/bio-brillouin/HDF5_BLS/blob/GUI_development/guides/Projec...>, correct? In addition to this document I think it would be good to have a more structured description of the file (like this <https://github.com/prevedel-lab/Brillouin-standard-file/blob/main/docs/Bh5_f...>), where each field is clearly defined in terms of data type and dimensions. Sebastian was also suggesting that the document should contain the reasoning behind each specific choice in the specs and also things that we considered but decided had some issues (so in future we can look back at it). I still believe that the file format should contain the "processed" spectra (i.e. after FT and baseline subtraction for impulsive, or after taking a line profile and possibly linearization with VIPA,...) so we can apply standard data processing or visualization which is independent on the actual underlaying technique (e.g. VIPA, FP, stimulated, time domain, ...) agree on an API to read the data from our file format (most likely a Python class). For that we should: 1) decide on which information is important to extract (spectral information, spatial coordinates, hyper-parameters, metadata,...) 2) implement an interface to read the data (e.g. readSpectrumAtIndex(...), readImage(...), ...) build a GUI that use the previously defined API to show and process the data. I would say that, once we have a very solid description of the file format as in step 1, step 2 will come naturally and we can divide the actual implementation between us. Step 3 can also easily be implemented and divided between us once we have an API (and I am happy to work on the GUI myself).
The first half of the project is the trickiest and I know Pierre has already done a lot of work in that direction. We should definitely agree on which extent we can define a standard to store the raw data, given the variability between labs, (and probably we should do it for common techniques like FP or VIPA) and how to implement the treatments, leaving to possibility to load some custom code in the pipeline to do the conversion.
Let me know what you all think about this.
If you agree I would start by making a document which clearly defines the file format in a structured way (as in my step 1 before). @Pierre could you write a new document or modify the document I originally made <https://github.com/prevedel-lab/Brillouin-standard-file/blob/main/docs/Bh5_f...> to reflect the latest structure you implemented for the file format? The metadata can still be defined in a separated excel sheet, as long as the data type and format is well defined there.
Best regards,
Carlo
On Wed, Feb 12, 2025 at 02:19, Kareem Elsayad via Software <software@biobrillouin.org <mailto:software@biobrillouin.org>> wrote:
Hi Robert, Carlo, Sal, Pierre,
Think it would be good to follow up on software project. Pierre has made some progress here and would be good to try and define tasks a little bit clearer to make progress…
There is always the potential issue of having “too many cooks in the kitchen” (that have different recipes for same thing) to move forward efficiently, something that I noticed can get quite confusing/frustrating when writing software together with people. So would be good to clearly assign tasks. I talked to Pierre today and he would be happy to integrate things in framework we have to try tie things together. What would foremost be needed would be ways of treating data, meaning code that takes a raw spectral image and meta-data and converts it into “standard” format (spectral representation) that can then be fitted. Then also “plugins” that serve a specific purpose in the analysis/rendering that can be included in framework.
The way I see it (and please comment if you see differently), there are ~4 steps here:
Take raw data (in .tif,, .dat, txt, etc. format) and meta data (in .cvs, xlsx, .dat, .txt, etc.) and render a standard spectral presentation. Also take provided instrument response in one of these formats and extract key parameters from this Fit the data with drop-down menu list of functions, that will include different functional dependences and functions corrected for instrument response. Generate/display a visual representation of results (frequency shift(s) and linewidth(s)), that is ideally interactive to some extent (and maybe has some funky features like looking at spectra at different points. These can be spatial maps and/or evolution with some other parameter (time, temperature, angle, etc.). Also be able to display maps of relative peak intensities in case of multiple peak fits, and whatever else useful you can think of. Extract “mechanical” parameters given assigned refractive indices and densities
I think the idea of fitting modified functions (e.g. corrected based on instrument response) vs. deconvolving spectra makes more sense (as can account for more complex corrections due to non-optical anomalies in future –ultimately even functional variations in vicinity of e.g. phase transitions). It is also less error prone, as systematically doing decon with non-ideal registration data can really throw you off the cliff, so to speak.
My understanding is that we kind of agreed on initial meta-data reporting format. Getting from 1 to 2 will no doubt be most challenging as it is very instrument specific. So instructions will need to be written for different BLS implementations.
This is a huge project if we want it to be all inclusive.. so I would suggest to focus on making it work for just a couple of modalities first would be good (e.g. crossed VIPA, time-resolved, anisotropy, and maybe some time or temperature course of one of these). Extensions should then be more easy to navigate. At one point think would be good to involve SBS specific considerations also.
Think would be good to discuss a while per email to gather thoughts and opinions (and already start to share codes), and then plan a meeting beginning of March -- how does first week of March look for everyone?
I created this mailing list (software@biobrillouin.org <mailto:software@biobrillouin.org>) we can use for discussion. You should all be able to post to (and it makes it easier if we bring anyone else in along the way).
At moment on this mailing list is Robert, Carlo, Sal, Pierre and myself. Let me know if I should add anyone.
All the best,
Kareem
This message and any attachment are intended solely for the addressee and may contain confidential information. If you have received this message in error, please contact the sender and delete the email and attachment. Any views or opinions expressed by the author of this email do not necessarily reflect the views of the University of Nottingham. Email communications with the University of Nottingham may be monitored where permitted by law. _______________________________________________ Software mailing list -- software@biobrillouin.org <mailto:software@biobrillouin.org> To unsubscribe send an email to software-leave@biobrillouin.org <mailto:software-leave@biobrillouin.org>
_______________________________________________ Software mailing list --software@biobrillouin.org <mailto:software@biobrillouin.org> To unsubscribe send an email tosoftware-leave@biobrillouin.org <mailto:software-leave@biobrillouin.org>
_______________________________________________ Software mailing list -- software@biobrillouin.org <mailto:software@biobrillouin.org> To unsubscribe send an email to software-leave@biobrillouin.org <mailto:software-leave@biobrillouin.org>
_______________________________________________ Software mailing list -- software@biobrillouin.org <mailto:software@biobrillouin.org> To unsubscribe send an email to software-leave@biobrillouin.org <mailto:software-leave@biobrillouin.org>
_______________________________________________ Software mailing list -- software@biobrillouin.org <mailto:software@biobrillouin.org> To unsubscribe send an email to software-leave@biobrillouin.org <mailto:software-leave@biobrillouin.org>
_______________________________________________ Software mailing list -- software@biobrillouin.org <mailto:software@biobrillouin.org> To unsubscribe send an email to software-leave@biobrillouin.org <mailto:software-leave@biobrillouin.org>
_______________________________________________ Software mailing list -- software@biobrillouin.org <mailto:software@biobrillouin.org> To unsubscribe send an email to software-leave@biobrillouin.org <mailto:software-leave@biobrillouin.org>
_______________________________________________ Software mailing list -- software@biobrillouin.org To unsubscribe send an email to software-leave@biobrillouin.org
Dear All, Having read through the emails finally, here is what I gather. Keeping in mind that I may be misunderstanding things (correct me), this is how I would suggest we proceed. (Now it’s my go to write a long email 😊) Carlo’s vision appears to be to have (conceptually) the equivalent of a .tiff file used in e.g. fluorescence confocal microscopy that represents one particular measurement. this could be data (in the form of PSD for each voxel) pertaining to a spatial 2D or 3D scan/image. It may also be a time course 2D or 3D set of images (as is also possible in .tiff). The file also contains metadata (objective, laser wavelength/power, etc. used – basically the stuff in our consensus reporting xls). In addition it also (optionally) contains the Instrument Response Function (IRF). Potentially the latter is saved in the form of a control spectra of a known (indicated) material, but I would say more ideally it is stored as an IRF as this is more universal (between techniques), requires no additional info (measured sample), and is easier and faster to work with on analysis/fitting side (saves additional extraction of IRF which will be technique dependent). Now this is all well and good and I am fine with this. The downside is that it is limited to wanting to look at images /volume-images and (optionally) how they evolve over time. If you want to see how something changes with temperature or any other variable, or e.g. between two mutants, you would just save each as a separate file. This is usually what biologists are used to. Sure it might not be the most memory efficient (you would have to write all the metadata in each) but I don’t see that as an issue since this doesn’t take up too much memory (and we’ve become a lot better at working with large files than we were say 10 years ago). The downside comes when you want to look at say how the BLS spectra at a single position or a collection of voxels changes as you tune some parameter. Maybe for static maps you could “fake it” and save as a time series, which software recognizes? However, if you have 50 different BLS spectra for each voxel in a 3D space in a time series measurement (from e.g. 50 different angles) you have an extra degrees of freedom …would one need 50 files, one for each angle bin?. So it’s not necessarily different experiments, but just in this case one additional degree of freedom. Given dispersion only needs to be in one direction and we have two degrees of freedom on our camera, one can envision this extra degree of freedom being used for various other things (I.e not only spatial or angular multiplexing). Then there is maybe some physical-chemist-biologist who wants to say measure the change in linewidth as he/she induces a phase transition by tuning one thing or another at a single point (or few points). He/she is probably fine fitting each spectra with their own code as they scan e.g. the temperature across the transition. The question is do we also want to cater for him/her or are we just purely for BLS imaging? Pierre’s vision appears to be to have maximum flexibility in this regard, with a structure that is general enough to optimally accommodate for saving data for an entire multi-variable experiment. Namely if you do an angle-resolved map of a cell over time and repeat the experiments at different temperatures, and then say also for different mutants, you can store all that data in a single file. I think this is a very noble and cool idea, except that in practice you will (biology being biology) need to do this on >10 cells (in each case) to get anything statistically significant. You can in principle put that too into the same file, but now we are talking about firstly increased complexity (which I guess can theoretically be overcome since to most people this is a black box anyhow) but ultimately doing/reporting science in a way biologists – or indeed most scientists - are not used to (so it would be trend-setting in that sense – having an entire study in a single file, with statistics and so forth done not separately and differently between labs). This is certainly not a conceptually a crazy idea, and probably even the future of science (but maybe something best exploring firstly in a larger consortium with standard fluorescence, EM etc. techniques if it hasn’t already – which it probably has). It also makes things more amiable to be analyzed and compared (between different studies) by e.g. AI in a multi-variate/dimensional way (maybe should propose to Zuckerberg?). I digress. I think here it is worth keeping things not just as simple but also as basic as possible. With Nat Meth (assuming they consider interesting enough) the focus is biologists in their current state of mind, and with their current habits, and that is kind of what we need to cater for when trying to sell an exotic technique to the masses. So, following my rambling, here is how I think we should proceed, as we need to move forward and not dwell on this longer. As mentioned in previous emails, this is basically two separate projects (of equal importance) that just need to agree on their meeting point in the middle. It is ideal that the goals are already more or less defined between getting raw data to a “standard” format (Vienna/Nottingham side), and “fitting/presenting” data (Heidelberg side). Not reaching a general consensus on the h5 format I would suggest that Carlo/Sebastian work with their file format and Pierre/Sal with theirs and we figure how to patch together after (see below). It maybe would be good to clarify some of the lingo first to avoid misunderstandings. (Maybe the below has been defined, in which case ignore and see it as a reflection of my naivety)… Firstly, “treatment”. Is this “just” the step from getting from the raw acquired spectra to an agreed upon, universally applicable, presentation of the PDS for each voxel (excl. any decon., since we fit IRF modified Lorentzians/DHOs) which can be fed into the same fitting procedure(s)? This would I guess only include one peak (e.g. anti-Stokes) since in time domain that’s all you’ll get out anyhow. Does it refer to the entire construction of the h5 file? Does it include the fitting and extraction of the frequency shifts and linewidths? the calculation of viscoelastic moduli (if one provides auxiliary parameters like refractive index and density)? Secondly, and related, in dividing tasks it is also not clear to me if the “standard” h5 file contains also the fitted values for frequency shift/linewidth or just the raw data. From the division of work load my understanding is that the fitting will be done in Carlo/Sebastian’s code (?). Will the fitted values then also be included in the h5 file or not? (i.e. additionally written into it after it was generated from Pierre’s codes). There is no point of everybody doing their own fitting code, which would kinda miss the point of having some universality/standard? I guess to me it is unclear where the division of labor is. To keep things simple I would suggest that Pierre’s code simply generates the standard h5 file (unfitted, but in a standard PSD presentation for each voxel, and includes optional IRF), and then Carlo/Sebastian’s codes do the fitting and resaves the fitting parameters into some empty/assigned space in that same h5 file. If the h5 file already contains fitted paramaters (from previously running Carlo/Sebastian’s code) then these can directly be displayed (or one can chose to fit again and overwrite). How does this sound to everyone? This does not address the contention of the file format. The solution proposed in our last Zoom meeting was creating a code that converts one (Pierre’s) file format to the other (Carlo’s). This is I think in light of the recent emails I think the only reasonable solution, and probably maybe even a great solution, considering that Pierre’s file format may contain multiple additional information (entire experiments) and the conversion between the two can allow one to e.g. pick out specific ones if and as relevant. It doesn’t have to be elaborate at this point, but it can have the potential to be for multi-variate data down the line. So this divide is actually a plus as it keeps door open for more complex data sets, without them being a neccesity. Would it maybe be possible for Pierre and Carlo to write this conversion program together as a first step? Just needs to be rudimentary so that individual parties can start working on their sides independently asap? This code can then in the end be tacked on to one or the other codes developed by the two parties, depending on what we decide to be the standard reporting format. It is also not crazy to consider in the end two file formats that can be accepted, one maybe called “measurement”-file format, and one “experiment”-file format, that the user selects between when importing? As such if this conversion code is in Pierre’s code one may have the option to export as one of these two formats. If it is also in Carlo’s code, one has option to read either format. This way one has option of saving as and reading out from both a single image/series of images (as is normally done in bioimaging) as well as an entire experiment as one pleases and everybody is happy 😊 How does this sound? I hope the above is a suitable way to move forward, but ofcourse let me know your thoughts and happy with alternatives… Regarding the bi-weekly meetings suggested by Robert. I still think this makes sense… Ofcourse not everybody needs to attend all if busy, but having this time slot earmarked in calender for when it becomes necessary might be nice. I will send out an email with dates/invite info… All the best, and hope this moves forward from here!!:) Kareem From: Pierre Bouvet via Software <software@biobrillouin.org> Reply to: Pierre Bouvet <pierre.bouvet@meduniwien.ac.at> Date: Tuesday, 4. March 2025 at 11:20 To: Carlo Bevilacqua <carlo.bevilacqua@embl.de> Cc: "software@biobrillouin.org" <software@biobrillouin.org> Subject: [Software] Re: [EXTERN] Re: Software manuscript / BLS microscopy Hi everyone, The spec sheet I defined for the format is there (I thought I had pushed it already but it seems not). To make it simple, my aim is to have a simple way (emphasis on simple) to store any kind of data obtained with as many different setups as possible, follow a unified pipeline and allow a unified treatment of the data. From this spec sheet I built this structure which I’ve been using for a few months now and that seems robust enough, in fact what blocked me for adapting it to time-domain was not the structure but the code I already had written to implement it. Once again, visualizing data is not the priority for me, because I believe the main problem in the community today is that we don’t have a single, robust and well-characterized way of extracting information from a PSD. Best, Pierre Pierre Bouvet, PhD Post-doctoral Fellow Medical University Vienna Department of Anatomy and Cell Biology Wahringer Straße 13, 1090 Wien, Austria On 3/3/25, at 21:32, Carlo Bevilacqua via Software <software@biobrillouin.org> wrote: Hi all, we are still trying to find an agreement with Pierre but I think that, a part from the technicalities that we can probably figure out between ourselves, we have a different view on the aims of the file format and the project in general. Although I agree that for now we could work with separate files and convert between them, eventually we need to agree on a format to propose as a standard and I want to avoid postponing the decision (at least for the general structure, of course minor details can change during the process). Otherwise I am afraid that, once most of the code is written, it will be hard to unify it and this will make the decision even more difficult. What I see as the main points of this project are: to have some sort of TIFF for Brillouin data, with the main aim of storing images (i.e. spatial maps of a sample) together with the spectral data that it is used to generate them and the relevant metadata and calibration data while allowing the possibility of storing single spectra or spectra acquired in different conditions in multiple samples (i.e. having a whole study in a single file), I don't see this as a determinant in defining the file. That is because the same result can be achieved by having multiple file with a clear naming convention (e.g. ConcentrationX_TemperatureY_SampleN), which is commonly done in microscopy and I feel it is a "cleaner" solution than having everything in a single file the analysis part of the software should be able to perform standard Brillouin analysis (i.e. fit the spectra with different functions that the user can select) but possibly more advanced stuff (like PCA or non-negative matrix factorisation) the visualization part would be similar to this, where the user can click on a pixel and see the corresponding spectrum (possibly selecting different fit functions and see the result on the fly). If multiple images are stored in the file, some dropdown menus would appear to select the relevant parameters, which identify a single image. I discussed about these points with Robert and Sebastian and we agree on them. The structure of the file I proposed (and refined with input from Pierre and Sebastian) is designed with these aims in mind. @Pierre, can you please list your aims? I don't want write what I understood from you because I might misrapresent them. It would be good to have your feedback on what you consider to be the main aims and priorities, so we can have the last iteration on the format, as we'd like to proceed with the actual coding. Best regards, Carlo On Fri, Feb 28, 2025 at 19:01, Pierre Bouvet via Software <software@biobrillouin.org> wrote: Hi everyone :) As I told you during the meeting, I just pushed everything on Git and merged with main. You can normally clone the project and test it on your machines by running the HDF5_BLS_GUI/main.py script from base repository. If it doesn’t work, it might be an os compatibility issue on the paths, but I’m hopeful I won’t have to patch that ^^ You can quickly test it with the test data provided in tests/test_data, this will however only allow you to do the most basic things (import data and edit parameters). A first version of the parameter spreadsheet (the child of the Consensus paper) is located in “spreadsheets”. You can open this file and edit it and then export it as csv. The exported csv can be dragged and dropped into the right frame of the GUI to update all the parameters of the group or dataset that you have selected in the left frame. Naturally, this GUI is built on the hierarchical structure I propose for the HDF5 file (described in guides/Project/Project.pdf), note however that it can be adjusted to a linear approach (cf discussion of today) so see this more as a first “usability” test of a - relatively - stable version, and a way for you to make a list of everything that is wrong with the software. @ Sal: I’ll soon have the code to convert your data to PSD & frequency arrays, but I’m confident you can already use the format to store your spectra as time arrays (with abscissa) from your .dat and .con files (and .. Note that because I don’t have order of magnitudes for the parameters you use, I could only test the GUI and its usability. In case you are looking for the code for importing your data, it’s in HDF5_BLS/load_formats/load_dat.py in the “load_dat_TimeDomain” function Last thing: I located the developer guide I couldn’t find during the meeting and placed it back where I thought it was (guides/DeveloperGuide/ModuleDeveloperGuide.pdf). I’m underlining this document because this is maybe the most important one of the whole project since it’s where people that want to collaborate after it’s made public will go to. The goal of this document is to take people by the hand and help them making their additions compatible with the whole project. For now this document only talks about adding data. Best, Pierre Pierre Bouvet, PhD Post-doctoral Fellow Medical University Vienna Department of Anatomy and Cell Biology Wahringer Straße 13, 1090 Wien, Austria On 28/2/25, at 14:18, Carlo Bevilacqua via Software <software@biobrillouin.org> wrote: Hi all, I made a file describing the file format, you can find it here. I think that attributes are easy to add and names of groups/datasets can be changed (if they are unclear now), so these are details that we don't need to discuss now. What I find most important to agree on now is the general structure. In that sense that are still some points under discussion between me and Pierre, but hopefully we can iron them out during the meeting. Talk to you in a bit, Carlo On Wed, Feb 26, 2025 at 23:56, Kareem Elsayad <kareem.elsayad@meduniwien.ac.at> wrote: Hi Carlo, Sounds great! Yes, Fri 28th @3pm still works for me. If it works for others, here is Zoom we can use: https://us02web.zoom.us/j/5191046969?pwd=alpzaldoZEd3N2ZEQ0hYZU1RR1dOdz09 Meeting ID: 519 104 6969 Passcode: jY3zH8 All the best, kareem From: Carlo Bevilacqua via Software <software@biobrillouin.org> Reply to: Carlo Bevilacqua <carlo.bevilacqua@embl.de> Date: Wednesday, 26. February 2025 at 20:43 To: Kareem Elsayad <kareem.elsayad@meduniwien.ac.at> Cc: "software@biobrillouin.org" <software@biobrillouin.org> Subject: [Software] Re: [EXTERN] Re: Software manuscript / BLS microscopy Hi Kareem, thank you for your email. We are discussing with Pierre about the details of the file format and hopefully by our next meeting we will have agreed on a file format and we can divide the tasks. If it is still an option, Friday 28th at 3pm works for me. Best regards, Carlo On Mon, Feb 24, 2025 at 03:17, Kareem Elsayad <kareem.elsayad@meduniwien.ac.at> wrote: Dear All, I (and Robert) were hoping there would be some consensus on this h5 file format. Let us do a Zoom on Fri 28th Feb at 15:00? A couple of points pertaining to arguments… Firstly, the precise structure is not worth getting into big arguments or fuss about…as long as it contains all the information needed for the analysis/representation, and all parties can work with (able to write and read knowing what is what), it ultimately doesn’t matter. In my opinion better put more (optional) stuff in if that is issue, and make it as inclusive as possible. In the end this does not need to be read by analysis/representation side, and when we go through we can decide if and what needs to be stripped. It is after all the “black box” between doing the experiment and having your final plots/images. Take a look at say a Zeiss file and try figure all that’s in it (it is not ideally structured maybe, but no biologist ever cared) – that said, I am sure their team had very similar arguments concerning structure etc.! (you have as many opinions as people). Maybe the issue is that the boundary conditions were not as well defined, but I would say at this point make them more inclusive than they need to be (empty spaces cost little memory) Secondly, and following on from firstly. We need to simply agree and compromise to make any progress asap. Rather than building separate structures we need to add/modify a single existing structure or we might as well be working on independent projects. Carlo’s initially proposed structure seemed reasonable, maybe with some minor changes, and we should just go with that as a basis in my opinion. I would suggest that Pierre and Carlo have a Zoom together and try and come up with something that is acceptable to both. Like everything in life, this will involve making compromises. And then present it on 28th Feb. Quite simply, if there is no agreement we cannot do this project and in the end it doesn’t matter who is right or wrong. Finally, I hope the disagreements from both sides are not seen as negative or personal attacks –it is ok to disagree (that’s why we have so many meetings!) On the plus side we are still more effective than the Austrian government (that is still deciding who should be next prime minister like half a year after elections) 😊 All the best, Kareem From: Pierre Bouvet via Software <software@biobrillouin.org> Reply to: Pierre Bouvet <pierre.bouvet@meduniwien.ac.at> Date: Friday, 21. February 2025 at 11:55 To: Carlo Bevilacqua <carlo.bevilacqua@embl.de> Cc: <software@biobrillouin.org> Subject: [Software] Re: [EXTERN] Re: Software manuscript / BLS microscopy Hi Carlo, Thanks for your reply, here is the next pong of this ping pong series ^^ 1- I was talking indeed about the enums, but also the parameters that are defined as integers or floating point numbers and uint32. I think its easier (and that we already agreed on) having a spreadsheet with the parameters (easy to use, easy to update, easy to store and modify between two experiments using the same setup, allows to impose fixed choices for some parameters with drop-down lists, allows to detail the requirements for the attribute like its format or units and allows examples) and to just import it in the HDF5 file. >From there it’s easier to have every attribute as strings both for the import and for the concept of what an attribute is. 2- OK 3- The problem is not necessarily the number of experiments you put in the file but the number of hyper parameters you want to take into account. Let’s take an example with a doubtable sense: I want to study the effect of low-frequency temperature fluctuations on micro mechanics in active samples both eukaryote and prokaryote showing a layered structure (endothelial cells arranged in epidermis, biofilms, …) with different cell types, and as a function of aging. I would then create a file with a first range of groups for the age of the sample, then inside these groups 2 groups for eukaryote and prokaryote samples, then inside these groups N groups for the samples I’m looking at, then inside these groups M groups for the temperature fluctuations I impose, then inside these groups the individual measures I make (this is fictional, I’m scared just to think at the amount of work to have all the samples, let alone measure them), this is simply not possible with your approach I think, and even simpler experiments like to measure the Allan variance on an instrument using 2 samples is not possible with your structure I think. 4- / 5- I think the real question is what we expect to get from a wrapper: for me is to wrap the measures of a given study, to then share, link to papers, treat using new approaches… Having a structure that can wrap both a full study and an experiment is in my opinion better in the long run than forcing the format to be used with only one experiment. 6- Yes, I understand it is an identifier, but why an integer? Why not a tuple? Why not a hash? And what if there’s a bug and instead of 3 you store you store 3.0, or 2, or ‘e'? Do you imagine the amount of work to understand where this bug comes from? Assuming it’s a bug because it might very well be just an inexperienced user making a mistake and then your file is broken. The idea is good but the safer way to have this is to work with nD arrays where the dimensionality is conserved I think, or just have all the information in the same group. 7- Here again, it’s more useful for your application but many people don’t use maps, so why force them to have even an empty array for that? Plus if they need to have a dedicated array for the concentration of crosslinkers (for example), they are faced with a non-trivial solution, which means they won’t use the format. 8- Yes, we could add an additional layer, but then it means that if you don’t need it, your datasets are in plain in the group and if you need it, then you don’t have the same structure. The solution I think is to already have the treated data in a group, if you don’t need more than one group (which will be most of the time the case) then you’ll only have one group of treated data. 9- I think it’s not useful. The SNR on the other hand is useful, because in shot-noise regime it’s a marker of variance, and this is one of the ways to spot outliers from treatment (if the SNR doesn’t match the returned standard deviation on the shift of one peak, there’s a problem somewhere). 10- The std of a fit is obtained by taking the square root of the diagonalized covariant matrix returned by the fit as long as your parameters are independent (it’s super interesting actually and a little bit more complicated but it’s true enough for lorentzian, DHO, Gaussian...) 11- OK but then why not have the calibration curves placed with your measures if they are only applicable to this measure? Once again, I think having indexes that are modifiable by the user is not safe (the technical term is “idiot proof”) 12- I don’t agree, if you are capturing points at a fixed interval, then you can reconstruct the timestamp from the timestamp of the first acquisition and either the delay between two acquisitions or the timestamp of the last acquisition. Most of the time however we don’t even need this as we consider the sample to be time-invariant on the scale of our measure, so a single timestamp for all the measure is enough and is better stored as an attribute. In the special case where we are not time-invariant, then time becomes the abscissa of the measures and in that case yes, it can be a dataset, but then it’s better to not impose a fixed name for this dataset and rather let the user decide what hyper parameter is changed during he’s measure, this way the user is free to use whatever hyper parameters he feels like it. 13- OK 14- Still not clear to me. My approach is to consider an experiment to be a measure of a sample as function of one or more controlled or measured hyper parameter. So my general approach for storing experiments is have 3 files: abscissa (with the hyper parameters that vary), measure and metadata, which translates to “Raw_data”, “Abscissa_i” and attributes for this format. 15- OK, I think more than brainstorming about how to treat correctly a VIPA spectrum, we need to allow people to tell how they do it if we want this project to be used in short term, unification is a goal of this project and we will advertise it in the paper, but to be honest, I doubt people like Giuliano will run with it without second guessing it, particularly with its clinical setups, so there will be some going back and forth before we have something stable, and this means we need to allow for this back and forth to appear somewhere, I propose having it as a parameter. 16- Here I think you allow too much liberty, changing the frequency of an array to GHz is trivial and I think most people do use GHz as the unit of their frequency arrays anyway. We need to make it clear that the frequency axis is in GHz but I think we don’t need a full element for this. If you really want to specify the unit of the Frequency dataset, I would suggest putting it in its attributes in any case, and not as another element in the structure. 17- OK 18- I think it’s one way to do it but it is not intuitive: I won’t have the reflex to go check in the attributes if there is a parameter “sam_as” to see if the calibration applies to all the curves. The way I would expect it to be is using the hierarchical logic of the format: if I’m looking at a dataset in a sub-group of a group containing a calibration dataset, then I know this calibration applies to my data: Data |- Data_0 (group) | |- Calibration (dataset) | |- Data_0 (group) | | |- Raw_data (dataset) | |- Data_1 (group) | | |- Raw_data (dataset) |- Data_1 (group) | |- Calibration (dataset) | |- Data_0 (group) | | |- Raw_data (dataset) I think in this example most people would suppose Data/Data_0/Calibration applies both to Data/Data_0/Data_0/Raw_data and Data/Data_0/Data_1/Raw_data but not Data/Data_1/Data_0/Raw_data whose calibration is intuitively Data/Data_1/Calibration Once again, my approach of the structure is trying to make it intuitive and most of all, simple. For instance if I place myself in the position of someone that is willing to try “just to see how it works”, I would give myself 10s to understand how I could have a file for only one measure that complies with the new (hope to be) standard. It is my opinion as I already told you before, that your approach is too complete and therefore complex, which will inevitably lead to people not using the format unless there’s a GUI to do it for them (and even then they might not use it). I don’t want to impose my vision here, and like you I have put a lot of thinking (and testing) into building the format I propose, but I’m convinced that if we go with your structure, not only will it make it hard for anyone to understand how to use it but we’ll have problems using it ourselves. I want to repeat that I don’t have the solution, I’m just confident that my approach is much easier to conceptually understand and less restrictive than yours. In any case we can agree to disagree on that, but then it’ll be good to have an alternative backend like the one I did with your format to try and use it, and see if indeed it’s better, because if it’s not and people don’t use it, I don’t want to go back to all the trouble I had building the library, docs and GUI just to try. I don’t want to impose you anything but it would be awesome if you took the time to read the document I made and completed for you yesterday. Then you can just tell me where you think I’m missing something and you had a better solution because as you might see, I’m having problems with nearly all your structure and we can’t really use it as a starting point at this stage since most of the backend is written and the front-end is already functional for my setup (and soon Sal’s and the TFP). Best, Pierre Pierre Bouvet, PhD Post-doctoral Fellow Medical University Vienna Department of Anatomy and Cell Biology Wahringer Straße 13, 1090 Wien, Austria On 20/2/25, at 22:55, Carlo Bevilacqua <carlo.bevilacqua@embl.de> wrote: Hi Pierre, thank you for your feedback. I appreciate that you took the time to go through my definition and highlighting the critical points. I much prefer this rather than starting working with a file format where problem might arise in the future. If we understand what are the reasons behind our choices in the definition we can merge the best of the two approaches, rather than defining two "standards" for the same thing with each of them having their limitations. I will provide an answer to each of the points you raised (I gave numbers to the points in your email below, so it is easier to reference): I am not sure to which attribute you are referring specifically, but I am completely fine with text; I defined enums where I felt it makes sense to do so because there is a discrete number of options (one could always add elements at the end of an enum) I defined the attributes before we started working together and I am very much open to changing them so they reflect what you have in the spreadsheet; in the document defining the file format we can just state that the attributes and their type are defined in the excel sheet I did it this way because in my idea an individual HDF5 file corresponds to a single experiment. If you feel there is an advantage in keeping different experiments in the same file I am open to introduce your structure of subgroups; I honestly feel like this will only make the file unnecessarly large and different experiments would mostly not share much (apart from the metadata, which is anyway a small overhead in terms of filesize). Now of course the question is what you define as an 'experiment': for me different timepoints or measurements at different temperatures/angles/etc on the same sample are a single experiment and I defined the file so that it is possible to save them in a single file; measurements on different samples are not the same experiment in my original idea same as the point 3 same as before, I would put different samples in different files but happy to introduce your structure if you feel there is an advantage the index is used to uniquely identify an entry in the 'Analysed_data' table; it is important in the contest of reconstructing the image (see the definition of the 'tn/image' group) in my opinion spatial coordinates have a privileged role since we are doing imaging and having them well defined it is important to reconstruct the image; for different abscissas I defined the 'parameters' dataset (more in point 14). If one is not doing imaging this dataset can be set to an empty array or a single element (we can include this in the definition) in my idea the "Analyzed_data" group doesn't contain multiple treatments but the result of the fit on the 'final' spectra, which are unique; if you are referring to the 'n' in the 'Shift_n_GHz' that is included in case a multipeak fit is performed. Now, if we want to include the possibility of multiple treatments like you are doing (which I didn't originally consider) we could just add an additional layer to the hierarchy that is the amplitude of the peak from the fit. I am not sure if you didn't understand what I meant or you think it is not an useful information The fit error actually contains 2 quantities: R2 and RMSE (as defined in the type). I am not sure how you would calculate a std from a single spectrum the calibration curves are stored in the 'calibration_spectra' group with the name of the dataset matching the respective 'Calibration_index'. In our VIPA setup we are acquiring multiple calibration curves during a single acquisition to compensate for laser drift, that's why I introduced the possibility of having multiple calibration curves. Note that the 'Calibration_index' is defined as optional exactly because it might not be needed each spectrum can have its own timestamp if it is acquired from a different camera image or scan of a FP, etc that's why it needs to be a dataset. Note that it is an optional dataset good point, we can rename it to PSD that is exactly to account for the general case of the abscissa not being a spatial coordinate and it contains the values for the parameters (e.g. the angles in an angle resolved measurement). It is a dataset whose dimensions are defined in the description (happy to elaborate more if it is not clear) float is the type of each element; it is a dataset whose dimensions are defined in the description; the way to define the frequency axis in general for setups which don't have an absolute frequency (like VIPAs) is tricky and would be good to brainstorm about possibile solutions as for the name we can change it, but the problem on how to deal with the situation when one doesn't have the frequency in GHz remains. My idea here was to leave the possibility of different units because the fit and most of the data analysis can be performed even if the x-axis is not in GHz and the actual conversion of the shift to GHz can be done at the end and requires the calibration data. As in my previous point, I am happy to brainstorm different solutions to this problem it is indeed redundant with 'Analyzed_data' and I pushed a change on GitHub to correct this see point 11; also note that the group is optional (in case people don't need it) and I introduced the attribute "same_as" to avoid repeating it multiple times if it is always the same for all the 'tn' As you see we agree with some of the points or we could find a common solution, for others it was mainly a misunderstanding on what were my intentions (probably my bad in expressing them, but you could have asked if it was not clear). Hope this helps claryfing my reasoning in the file definition and I am happy to discuss all the open points. I will look in details at your newest definition that you shared in the next days. Best, Carlo On Thu, Feb 20, 2025 at 18:25, Pierre Bouvet via Software <software@biobrillouin.org> wrote: Hi, My goal with this project is to unify the treatment of BLS spectra, to then allow us to address fundamental biophysical questions with BLS as a community in the mid-long term. Therefore my principal concern for this format is simplicity: measure are datasets called “Raw_data”, if they need one or more abscissa to be understood, this/these abscissa are called “Abscissa_i” and they are placed in groups called “Data_i” where we can store their attributes in the group’s attributes. From there, I can put groups in groups to store an experiment with different ... (e.g. : samples, time points, positions, techniques, wavelengths, patients, …). This structure is trivial but lacks usability so I added an attribute called “Name” to all groups that the user can define as he wants without impacting the structure. Now here are a few critics on Carlo’s approach. I didn’t want to share them because I hate criticizing anyone’s work, and I do think that what Carlo presented is great, but I don’t want you to think that I just trashed what he did, to the contrary, it’s because I see limitations in his approach that I tried developing another, simpler one. So here are the points I have problems with in Carlo’s approach: The preferred type of the information on an experiment should be text as we’ll likely see new devices (like your super nice FT approach) appear in the next months/years that will require new parameters to be defined to describe them. I think we should really try not to use anything else than strings in the attributes. The experiment information should not be defined by the HDF5 file structure but rather by a spreadsheet because everyone knows how to use Excel, and it’s way easier to edit an Excel file than an HDF5 file. Experiment information should apply to measures and not to files, because they might vary from experiment to experiment, I think their preferred allocation is thus the attributes of the groups storing individual measures (in my approach) The characterization of the instrument might also be experiment-dependent (if for some reason you change the tilt of a VIPA during the experiment for example), therefore having a dedicated group for it might not work for some experiments The groups are named “tn” and the structure does not present the nomenclature of sub-groups, this is a big problem if we want to store in the same format say different samples measured at different times (the logic patch would be to have sub-groups follow the same structure so tn/tm/tl/… but it should be mentioned in the definition of the structure) The dataset “index” in Analyzed_data is difficult to understand, what is it used for? I think it’s not useful, I would delete it. The "spatial position" in Analyzed_data supposes that we are doing mappings. This is too restrictive for no reason, it’s better to generalize the abscissa and allow the user to specify a non-limiting parameter (the “Name” attribute for example) with whatever value he wants (position, temperature, concentration of whatever, …). A concrete example of a limit here: angle measurements, I want my data to be dependent on the angle, not the position. Having different datasets in the same “Analyzed_data” group corresponding to the result of different treatments raises the question of where the process followed to treat the data is stored. A better approach would be to create n groups “Analyzed_data_n” with only one dataset of treated values, allowing for the process to be stored in the attributes of the group Analyzed_data_n I don’t understand why store an array of amplitude in “Analyzed_data”, is it for the SNR? Then maybe we could name this array “SNR”? The array “Fit_error_n” is super important but ill defined. I’d rather choose a statistical quantity like the variance, standard deviation (what I think is best), least-square error… and have it apply to both the Shift and Linewidth array as so: “Shift_std” and “Linewidth_std" I don’t understand “Calibration_index”: where are the calibration curves? Are they in “experiment_info”? If so, we expect people to already process their calibration curves to create an array before adding them to the hdf5 file? I’m not very familiar with all devices, so I might not see the limitations here but do we ever have more than one calibration curve per measure? Could we not add it to the group as a “Calibration” dataset? Or just have one group with the calibration curve? Timestamp is typically an attribute, it shouldn’t be present inside the group as an element. In tn/Spectra_n , “Amplitude” is the PSD so I would call it PSD because there are other “Amplitude” datasets so it’s confusing. If it’s not the PSD, I would call it “Raw_data”. I don’t understand what “Parameters” is meant to do in tn/Spectra_n, plus it’s not a dataset so I would put it in attributes or most likely not use it as I don’t understand what it does. Frequency is a dataset, not a float (I think). We also need to have a place where to store the process to obtain it. In VIPA spectrometers for instance this is likely a big (the main even I think) source of error. I would put this process in attributes (as a text). I don’t think “Unit” is useful, if we have a frequency axis, then we should define it directly in GHz, and if it’s a pixel axis, then for one we should not call it “Frequency” and then it’s better not to put anything since by default we will consider the abscissa (in absence of Frequency) as a simple range of the size of the “Amplitude” dataset. /tn/Images: it’s a good idea, but I believe this is redundant with “Analyzed_data” (?) If it’s not then I don’t understand how we get the datasets inside it. “Calibration_spectra” is a separate group, wouldn’t it be better to have it in “Experiment_info” in the presented structure? Also might scare off people that might not want to store a calibration file every time they create a HDF5 file (I might or might not be one of them) Like I said before, I don’t want this to be taken as more than what lead me to defining a new approach to the format. I want to state once again that Carlo's structure is complete, only it’s useful for specific instruments and applications, and difficultly applicable to other techniques and scenarios (and more lazy people like myself). Following Carlo’s mail, I’ve also completed the PDF I made to describe the structure I use in the HDF5_BLS library, I’m joining it to this email and pushing its code to GitHub, feel free to edit it and criticize it at length (I feel like I deserve it after this email I really tried not to write). Best, Pierre Pierre Bouvet, PhD Post-doctoral Fellow Medical University Vienna Department of Anatomy and Cell Biology Wahringer Straße 13, 1090 Wien, Austria On 20/2/25, at 16:12, Robert Prevedel via Software <software@biobrillouin.org> wrote: Dear all, great to see all this discussion in this thread, and thanks to especially Pierre and Carlo for driving this forward. I’ve been following the various emails and arguments closely but simply didn’t have any time to chip in due to some important committments in the past days. I understand that there was a bit of a disagreement about what the focus of this effort should be, so maybe it just helps to highlight my lab's view on this (which I just discussed in depth with Carlo and Sebastian): Our original motivation was to come up with and define a common file-format, as we regard this to be key to unify the processing and visualization of Brillouin data by the community. In this respect, we would be happy to focus our efforts on defining this format and taking care of implementing the necessary processing/visualization software and interface that allows anyone to look at the data in the same way. We also regard this to be crucial if we want to standardize the reporting of Brillouin data from diverse setups/users/applications. Therefore, at this stage it would be extremely important to agree on the structure of the file format. Carlo has proposed a very well thought-through structure for this, and it would be great to get your concrete feedback on this, as I understand this hasn’t really happened yet. To aid in this, e.g. Pierre and/or Sal could try to convert or save your standard data into this structure, and report on any difficulties or ambiguities that he encounters. Based on this I agree it’s best to meet and discuss and iron this out as a next step, however it either has to be next week (ideally Fri?), or after March 12 as I am travelling back-to-back in the meantime. Of course feel free to also meet without me for more technical discussions if this speeds up things. Either way we could then also discuss the file format etc. for the ‘raw’ data that Pierre proposed (and which is indeed very valuable as well). Let me know your thoughts, and let’s keep up the great momentum and excitement on this work! Best, Robert -- Dr. Robert Prevedel Group Leader Cell Biology and Biophysics Unit European Molecular Biology Laboratory Meyerhofstr. 1 69117 Heidelberg, Germany Phone: +49 6221 387-8722 Email: robert.prevedel@embl.de http://www.prevedel.embl.de On 20.02.2025, at 10:29, Carlo Bevilacqua via Software <software@biobrillouin.org> wrote: Hi Kareem, thanks for the suggestion, I agree that it is a good (and easy) way to divide the tasks! Just to be clear, it is not that I don't see the need/advantage of providing some standard treatment going from raw data to standard spectra, it is just that was not my priority when proposing the idea of a unified file format. Regarding the file format, splitting the one containing the raw data and the treatments from the one containing the spectra and the image in a standard format might be a good solution and we can always merge them at a later stage. As for the file containing the "standard" spectra, it would be very helpful if you can give some feedback on the structure I originally proposed. Keep in mind that the idea is to be able to associate spectrum/spectra to each pixel in the image, in a way that is independent of the scanning strategy and underlaying technique. I tried to find a solution that works for the techniques I am aware of, considering the peculiarities (e.g. for most VIPA setups there is no absolute frequency axis but only relative to water). If am happy to discuss why I made some specific choices and if you see a better way to achieve the same or see things differently. Both the 3rd and the 4th of March work for me. Best, Carlo On Thu, Feb 20, 2025 at 02:50, Kareem Elsayad via Software <software@biobrillouin.org> wrote: Dear All, (and I guess especially Carlo & Pierre 😊) I understand both your (main) points concerning what this all should be, and I think this is actually perfect for dividing tasks. The format of the hf or bh5 file being where things meet and what needs to be agreed on. The thing with raw data is ofcourse that it is variable between instruments and labs, and the conversion to “standard spectra” that can then be fitted etc. is going to be unique (maybe even between experiments in same project). That said, asking people to create some complex file from their data that works with a developed software is also unlikely to get a following. So (the way I see it) there are basically two parts. Getting from raw data to h5 (or bh5) format which contains the spectra in standard format. And then the whole analysis part and visualization (GUI, pretty features, etc.). While the latter may get the spotlight, it obviously relies heavily on the former being done right. Given that there are numerous “standard” BLS setup implementations the development of software for getting from raw data to h5 I think makes sense, since the h5 will no doubt be cryptic, and creating a working h5 is not something everyone will want to program by themselves (it is not an insignificant step given we are also trying to ultimately cater to biologists). As such a software that generates the h5 files, with drag and drop features and entering system parameters, for different setups makes sense and will save many labs a headache if they don’t have a good programmer on hand. So I would suggest that Pierre & Sal lead the work on developing this, while Carlo & Sebastian lead the work on developing the analysis/interface-presentation part. This way things are nicely divided and we just need to agree on the h5 file that is transferred between the two. From the side of Pierre & Sal there could maybe also be a second h5 generated that contains all the raw data and details on how it was converted to the transferred h5 file (for complete transparency this could then also be reported in papers if people wish). These could exist as two separate programs with respective GUIs but also eventually combined to a single one. How does this sound to everyone? To clear up details and try assign tasks going forward how about a Zoom first week of March (I would be free Monday 3rd and Tue 4th after 1pm)? All the best, Kareem From: Carlo Bevilacqua via Software <software@biobrillouin.org> Reply to: Carlo Bevilacqua <carlo.bevilacqua@embl.de> Date: Wednesday, 19. February 2025 at 20:43 To: Pierre Bouvet <pierre.bouvet@meduniwien.ac.at> Cc: <software@biobrillouin.org> Subject: [Software] Re: [EXTERN] Re: Software manuscript / BLS microscopy Hi Pierre, I realized that we might have slightly different aims. For me the most important part of this project is to have a unified file format that can be read and visualized by a standard software. The file format you are proposing is not sufficient for that in my opinion. For example one of my main motivation was to have an interface where the user can see the reconstructed image, click on a pixel, see the corresponding spectrum to check its quality and maybe try different fitting functions; that would already not be possible with your structure because the software would have no notion on where the spectral data is stored and how to associate it to a specific pixel. I don't see the structure of the file to be too complex as an issue, as long as it is functional: we can always provide an API and/or a GUI that allow people to take their spectra and save them in whatever format we decide without bothering about understanding the actual structure, the same way you can work with HDF5 file without having any understanding on how the data is actually stored on the disk. My idea of making a webapp as a GUI follows directly from there. Typical case: I sent some data to a collaborator and they can just run the app in their browser and check if the outliers they see in the image are real or a bad spectra. Similarly if we make a common database of Brillouin spectra, people can explore it easily using the webapp. From what I understood, you are instead more interested in going from raw data to an actual spectrum, which I don't see so much as a priority because each lab has their own code already and the actual procedure would be different for each lab (apart from standard instruments like the FP). I am not saying this should not be part of the software but not as a priority and rather has a layer where people can easily implement their own code (of course we could already implement code for standard instruments). I think it would be good to cleary define what is our common aim now, so we are sure we are working in the same direction. Let me know if you agree or I misunderstood what is your idea. Best, Carlo On Wed, Feb 19, 2025 at 16:11, Pierre Bouvet <pierre.bouvet@meduniwien.ac.at> wrote: Hi, I think you're trying to go too far too fast. The approach I present here is intentionally simple, so that people can very quickly get to storing their data in a HDF5 file format together with the parameters they used to acquire them with minimal effort. The closest to what you did is therefore as follows: - data are datasets with no other restriction and they are stored in groups - each group can have a set of attribute proper to the data they are storing - attributes have a nomenclature imposed by a spreadsheet and are in the form of text - the default name of a data is the name of a raw data: “Raw_data”, other arrays can have whatever name they want (Shift_5GHz, Frequency, ...) - arrays and attributes are hierarchical, so they apply to their groups and all groups under it. This is the bare minimum to meet our needs, so we need to stop here in the definition of the format since it’s already enough to have the GUI working correctly, and therefore the first version of the unified software advertised. Of course we will have to refine things later on, but we don’t want to scare people off by presenting them a file description that for one might not match their measurements and that is extremely hard to conceptually understand. To make my point clearer, take your definition of the format for example: there are 3 different amplitude arrays in your description, two different shift arrays and width arrays that are of different dimension, then we have a calibration group on one side but a spectrometer characterization array in another group that is called “experiment_info”, that’s just too complicated to use correctly. On the other hand, placing your raw data “as is” in a group dedicated to this data is conceptually easy and straightforward. Where you are right, is that should we have hundreds of people using it, we might in a near future want to store abscissa, impulse responses, … in a standardized manner. In that case, the question falls down to either adding sub-groups or storing the data together with the measure. Both are fine and don’t really pose a problem for now, essentially because we are not trying to visualize the results but just trying to unify the way to get them. Now regarding Dash, if I understand correctly, it’s just a way to change the frontend you propose? If that’s so, why not, but then I don’t really see the benefits: if you really want to use dash, you can always embed it inside a Qt app. Also Dash being browser based, you will only have one window for the whole interface, which will be a pain to deal with if you want to use the interface to do everything the GUI is expected to do (inspect an H5 file, convert PSD, treat data, edit parameters, inspect a failed treatment, simulate results using setups with slight changes of parameters…). We agree that at one point when people receive an h5 file, it will be useful to have a web interface that can do what yours or Sal’s GUI do (seeing the mapping results together with the spectrum, eventually the time-domain signal) but here again, it’s going too far too soon: let’s first have a simple and reliable GUI that can convert data from any spectrometer to PSDs and treat them with a unified code. This is the real challenge, visualization and nomenclature of results are both important but secondary. Also keep in mind that, the frontend can easily be generated by anyone really, with Copilot or ChatGPT or whatever AI, but you can’t ask them to develop the function that will correctly read your data and convert them to a PSD nor treat the PSD. This is done on the backend and is the priority since the unification essentially happens there. Best, Pierre Pierre Bouvet, PhD Post-doctoral Fellow Medical University Vienna Department of Anatomy and Cell Biology Wahringer Straße 13, 1090 Wien, Austria On 19/2/25, at 13:21, Carlo Bevilacqua <carlo.bevilacqua@embl.de> wrote: Hi Pierre, thanks for your reply. Regarding the file structure, what I am still not very clear about is what you define as Raw_data and data, how the actual spectra are stored and how the association to spatial coordinates and parameters is made. That's why I would really appreciate if you could make a document similar to what I did, where it is clear what each group should (or can) contain, what is the shape of each dataset, which attributes they have, etc... I am not saying that this should be the final structure of the file but I strongly believe that having it written in a structured way helps defining it and seeing potential issues. Regarding the webapp, it works by separating the frontend, which run in the browser and is responsible of running the GUI, and the backend which is doing the actual computation and that you can structure as you like with multithreading or any optimization you wish. The communication between frontend and backend is handled transparently by the framework, so you don't have to take care of it. When you run Dash locally a local server is created so the data stays on your computer and there is no issue with data transfer/privacy. If we want to move it to a server at a later stage, then you are right about the fact that data needs to be transferred to a server (although there might be solutions that allow you to still run the computation on the local browser, like WebAssembly, but I think it is too complex to look into this at this stage). Regarding safety and privacy, the data will be stored on the server only for the time that the user is using the app and then deleted (of course we will need to make a disclaimer on the website about this). Regarding space I don't think people at the beginning will load their 1Tb dataset on the webapp but rather look at some small dataset of few tens of Gb; in that case 1Tb of server space is more than enough (remember that the file will be stored only for the time the user is using the app). If people really start to use the webapp and space becomes a limitation, I would be super happy to look into WebAssembly so that the data can be handled locally from the browser without transferring it to the server. To summarize I would agree that, at this stage, there might be no advantage of a webapp over a local GUI (and might actually be a bit more work to develop it). But, if this project really flies, the potential of a webapp is huge, especially in the context of the BioBrillouin society where we want to have a database of spectral data and the webapp could be used to explore that without downloading anything on your computer. My main point is that moving now to a webapp would not be too much work, but if we want to do it at a later stage it will basically entail re-writing everything from scratch. Let me know what are your thoughts about it. Best, Carlo On Wed, Feb 19, 2025 at 08:51, Pierre Bouvet <pierre.bouvet@meduniwien.ac.at> wrote: Hi Carlo, You’re right, the format is still a little fuzzy. The main idea is to have a data-based hierarchy for storage: each data is stored in an individual group. From there, abscissa dependent on the data are stored in the same group and the treated data are stored in sub-groups. The names of the groups and sub-groups are fixed (Data_i), as is the name of the raw data (Raw_data) and abscissa (Abscissa_i). Also, the measure and spectrometer-dependent arguments have a defined nomenclature. To differentiate groups between them, we preferably attribute them a name as an attribute that is not used as an identifier, the identifier being either the path to the data/group from file root (Data_0/Data_42/Data_2/Raw_data) or potentially a hash value (not implemented). This I think allows all possible configurations, and using an hierarchical approach we can also pass common attributes and arrays (parameters of the spectrometer or abscissa arrays for example) on parent to reduce memory complexity. Now regarding the use of server-based GUI, first off, I’ve never used them so I’m just making supposition here but if the platform is able to treat data online, it will have to store the spectra somewhere in memory and it will not be local. My primary concerns with this approach is safety, particularly in terms of intellectual property protection, ethical considerations, and potential security vulnerabilities. Additionally, managing storage space will be a headache. Now, this doesn’t mean that we can’t have a server-based data plotter, or a server-based interface that does treatments locally but I don’t really see the benefits of this over a local software that can have multiple windows, which could at one point be multithreaded, and that could wrap c code to speed regressions for example (some of this might apply to Dash, I’m not super familiar with it). Now regarding memory complexity, having all the data we treat go on a server is a bad idea as it will raise the question of cost which will very rapidly become a real problem. Just an example: for a 100x100 map, I need 10Gb of memory (1Mo/point) with my setup (1To of archive storage is approximately 1euro/month) so this would get out of hands super fast assuming people use it. Now maybe there are solutions I don’t see for these problems and someone can take care of them but for me it’s just not worth the effort when having a local GUI solves all of these issues at once. But if you find a solution, then I’ll be happy to migrate to Dash, it won’t be fast to translate every feature but I can totally join you on the platform. Best, Pierre Pierre Bouvet, PhD Post-doctoral Fellow Medical University Vienna Department of Anatomy and Cell Biology Wahringer Straße 13, 1090 Wien, Austria On 18/2/25, at 20:26, Carlo Bevilacqua <carlo.bevilacqua@embl.de> wrote: Hi Pierre, regarding the structure of the file, I agree that we should keep it simple. I am not suggesting to make it more complex, rather to have a document where we define it in a clear and structured way rather than as a general description, to make sure that we are all on the same page. I am saying this because, to be honest, I am not sure I fully understand how you are structuring the HDF5 and I think it is important to agree on this now, rather than finding at a later stage that we had different ideas. Ideally if the GUI should be part of a single application, we should write it using a unified framework. The reasons why, after considering it for a bit, I lean towards Dash rather than Qt are: it can run in a web browser so it will be easy to eventually move it to a website, thus people can use it without installing it (which will hopefully help in promoting its use) it is based on plotly which is a graphical library with very good plotting capabilites and highly customizable, that would make the data visualization easier/more appealing Let me know what you think about it and if you see any advantage of Qt over a web app which I am not considering. Also, if we agree that Dash might be a better option, would you consider migrating to Dash? It might not be too much work if most of the code you wrote is for data processing rather that for the GUI itself and I could help you with that. Alternatively one workaround is to have a QtWebEngine in your Qt app and have the Dash app run inside that, but that would make only the Dash part portable to a server later on. Best, Carlo On Tue, Feb 18, 2025 at 10:24, Pierre Bouvet <pierre.bouvet@meduniwien.ac.at> wrote: Hi, Thanks, More than merge them later, just keep them separate in the process and rather than trying to build "one code to do it all", build one library and GUI that encapsulate codes to do everything. Having a structure is a must but it needs to be kept as simple as possible else we’ll rapidly find situations where we need to change the structure. The middle ground I think is to force the use of hierarchies and impose nomenclatures where problem are expected to appear: each dataset has its own group, each group can encapsulate other groups, each parameter of a group applies to all its sub-groups if the subgroup does not change its value, each array of a group applies to all of its sub-groups if the sub-group does not redefine an array with same name, the names of the groups are held as parameters and their ID are managed by the software. For the Plotly interface, I don’t know how to integrate it to Qt but if you find a way to do it, that’s perfect with me :) My vision of the GUI is something that unifies the format and can then execute scripts on the data stored in this format. I have pushed the application of the GUI to my data up to the point where I can do the whole information extraction process from it (add data, convert to PSD, fit curves). I think this could be super interesting if we implement it for all techniques. I think we could formalize the project in milestones, in particular define the minimal denominator that will allow us to have the paper. The milestone I reached for my spectro encompasses the following points: - Being able to add data to the file easily (by dragging & dropping to the GUI) - Being able to assign properties to these data easily (again by dragging & dropping) - Being able to structure the added data in groups/folders/containers/however we want to call it - Making it easy for new data types to be loaded - Allowing data from same type but different structure to be added (e.g. .dat files) - Execute scripts on the data easily and allowing parameters of these scripts to be defined from the GUI (e.g. select a peak on a curve to fit this peak) - Make it easy to add scripts for treating or extracting PSD from raw data. - Allow the export of a Python code to access the data from the file (we cans see them as “break points” in the treatment pipeline) - Edit of properties inside the GUI In any case I think we could build a spec sheet for the project with what we want to have in it based on what we want to advertise in the paper. We can always add things later on but if we agree on a strict minimum to have the project advertised, then that will set its first milestone on which we’ll be able to build later on. Best, Pierre Pierre Bouvet, PhD Post-doctoral Fellow Medical University Vienna Department of Anatomy and Cell Biology Wahringer Straße 13, 1090 Wien, Austria On 17/2/25, at 14:53, Carlo Bevilacqua via Software <software@biobrillouin.org> wrote: Hi Pierre, hi Sal, thanks for sharing your thoughts about it. @Pierre I am very sorry that Ren passed away :( As far as I understood you are suggesting to work on the individual aspects separately and then merge them together at a later stage? I am fine with that but I still think it is very important to now agree on what should be in the file format we are defining, because that is kind of the core of the project and will affect a lot of the design choices. I am happy to start working on the GUI for data visualization. In my idea, it will be something similar to this but written in dash, so it is a web app that for now can run locally (so no transfer of data to an external server is required) but in the future can easily be uploaded to a website that people can just use without installing anything on their computer. The question is how much of the data processing should be possible to do (or trigger) from the same GUI? I think at least a drop down menu with different fitting functions should be there, so the user can quickly check the results on a spectrum from a specific point in the image. @Pierre how are you envisioning the GUI you are working on? As far as I understood it is mainly to get the raw data and save it to our HDF5 format with some treatment on it. One idea could be to have a shared list of features that we are implementing in the GUI as we work on it, to avoid having the same functionality duplicated (or worst inconsistent) between the GUI for generating our file format and the GUI for visualization. Let me know what you think about it. Best, Carlo On Mon, Feb 17, 2025 at 11:04, Pierre Bouvet via Software <software@biobrillouin.org> wrote: Hi everyone, Sorry for the delayed response, I just went through the loss of Ren (my dog) and wasn’t at all able to answer. First of, Sal, I am making progress and I should have everything you have made on your branch integrated to the GUI branch soon, at which point I will push everything to main. Regarding the project, I think I align with Sal: keep things as simple as possible. My approach was to divide everything in 3 mostly independent layers: - Store data in an organized file that anyone can use, and make it easy to do - Convert these data into something that has physical significance: a Power Spectrum Density - Extract information from this Power Spectrum Density Each layer has its own challenge but they are independent on the challenge of having people using it: personally, if I had someone come to me with a new software to play with my measures, I would most likely only look at it for 1 minute (or less depending who made it) with a lot of apprehension and then based on how simple it looks and how much I understood of it, use it or - what is most likely - discard it. This is why Project.pdf is essentially meant to say: we put data arrays in groups and give them attributes written in text, but you can also create groups within groups to organize your data! I believe most of the people in the BioBrillouin society will have the same approach and before having something complex that can do a lot, I think it’s best to have something simple that can just unify the format (which in itself is a lot) and that people can use right away with a minimal impact on their own individual pipelines for data processing. To be honest, I don’t think people will blindly trust our software at first to treat their data, but they will most likely use it at first to organize their raw spectra, and maybe add their own treated data if they are feeling particularly adventurous. But that is not a problem as long as we start a movement. From there yes, we can complexity and create custom file architectures but that is already too complex I think for this first project. If we can all just import our data to the wrapper and specify their attributes, this will already be a success. Then for the paper, if we can all add a custom code to treat these data to obtain a PSD, I think this will be enough. As I said, the current API already allows you to add your data in a variety of format, so it’s just a question of developing the PSD conversion before having something we can publish (and then tell people to use). A few extra points: - Working with my setup, I realized if the user could choose between different algorithms to treat their own data, it would make the overall project much more usable (if an algorithm bugs for whatever reason, you can use another one) so I created 2 bottle necks in the form of functions (for PSD conversion and treatment) that would inspect modules dedicated to either PSD conversion or treatment, and list existing functions. It’s in between classical and modular programming but it makes the development of new PSD conversion code and treatment way way easier - The GUI is developed using oriented-object programming. Therefore I have already made some low-level choices that kind of impact all the GUI. I’m not saying they are the best choices, I’m just saying that they work, so if you want to work on the GUI, I would either recommend getting familiar with these choices, or making sure that all the functionalities are preserved, particularly the ones that are invisible (logging of treatment steps, treatment errors…) I’ll try merging the branches on Git asap and will definitely send you all an email when it’s done :) Best, Pierre Pierre Bouvet, PhD Post-doctoral Fellow Medical University Vienna Department of Anatomy and Cell Biology Wahringer Straße 13, 1090 Wien, Austria On 14/2/25, at 19:36, Sal La Cavera Iii via Software <software@biobrillouin.org> wrote: Hi all, I agree with the things enumerated and points made by Kareem/Carlo! I guess I would advocate for starting from a position of simplicity. We probably don't want to get weighed down by trying to include a bunch of bells and whistles from the start as these can be easily added once there is a minimally viable stable product. As long as data can be loaded to local memory, then treated in various (initially simple) ways through the GUI (and maybe maintain non-GUI compatibility for command-line warriors like myself), then the bh5 formatting stuff can be sorted on the back end? I definitely agree with Carlo's structure set out in the file format document; but all of that data will be floating around the memory in some shape or form and just needs to be wrapped up and packaged (according to Carlo's structure e.g.) when the user is happy and presses the "generate h5 filestore" etc. (?) Definitely agree with the recommendation to create the alpha using mainly requirements that our 3 labs would find useful (import filetypes, treatments, etc), and then we can add on more universal functionality second / get some beta testers in from other labs etc. I'm able to support on whatever jobs need doing and am free to meet in the beginning of March like you mentioned Kareem. Hope you guys have a nice weekend, Cheers, Sal --------------------------------------------------------------- Salvatore La Cavera III Royal Academy of Engineering Research Fellow Nottingham Research Fellow Optics and Photonics Group University of Nottingham Email: salvatore.lacaveraiii@nottingham.ac.uk ORCID iD: 0000-0003-0210-3102 <Outlook-tygjxucs.png> Book a Coffee and Research chat with me! From: Carlo Bevilacqua via Software <software@biobrillouin.org> Sent: 12 February 2025 13:31 To: Kareem Elsayad <kareem.elsayad@meduniwien.ac.at> Cc: sebastian.hambura@embl.de <sebastian.hambura@embl.de>; software@biobrillouin.org <software@biobrillouin.org> Subject: [Software] Re: Software manuscript / BLS microscopy You don't often get email from software@biobrillouin.org. Learn why this is important Hi Kareem, thanks for restarting this and sorry for my silence, I just came back from US and was planning to start working on this again. Could you also add Sebastian (in CC) to the mailing list? As you outlined, I would split the project into two parts: 1) getting from the raw data to some standard "processed' spectra and 2) do data analysis/visualization on that. For the second part the way I envision it is: the most updated definition of the file format from Pierre is this one, correct? In addition to this document I think it would be good to have a more structured description of the file (like this), where each field is clearly defined in terms of data type and dimensions. Sebastian was also suggesting that the document should contain the reasoning behind each specific choice in the specs and also things that we considered but decided had some issues (so in future we can look back at it). I still believe that the file format should contain the "processed" spectra (i.e. after FT and baseline subtraction for impulsive, or after taking a line profile and possibly linearization with VIPA,...) so we can apply standard data processing or visualization which is independent on the actual underlaying technique (e.g. VIPA, FP, stimulated, time domain, ...) agree on an API to read the data from our file format (most likely a Python class). For that we should: 1) decide on which information is important to extract (spectral information, spatial coordinates, hyper-parameters, metadata,...) 2) implement an interface to read the data (e.g. readSpectrumAtIndex(...), readImage(...), ...) build a GUI that use the previously defined API to show and process the data. I would say that, once we have a very solid description of the file format as in step 1, step 2 will come naturally and we can divide the actual implementation between us. Step 3 can also easily be implemented and divided between us once we have an API (and I am happy to work on the GUI myself). The first half of the project is the trickiest and I know Pierre has already done a lot of work in that direction. We should definitely agree on which extent we can define a standard to store the raw data, given the variability between labs, (and probably we should do it for common techniques like FP or VIPA) and how to implement the treatments, leaving to possibility to load some custom code in the pipeline to do the conversion. Let me know what you all think about this. If you agree I would start by making a document which clearly defines the file format in a structured way (as in my step 1 before). @Pierre could you write a new document or modify the document I originally made to reflect the latest structure you implemented for the file format? The metadata can still be defined in a separated excel sheet, as long as the data type and format is well defined there. Best regards, Carlo On Wed, Feb 12, 2025 at 02:19, Kareem Elsayad via Software <software@biobrillouin.org> wrote: Hi Robert, Carlo, Sal, Pierre, Think it would be good to follow up on software project. Pierre has made some progress here and would be good to try and define tasks a little bit clearer to make progress… There is always the potential issue of having “too many cooks in the kitchen” (that have different recipes for same thing) to move forward efficiently, something that I noticed can get quite confusing/frustrating when writing software together with people. So would be good to clearly assign tasks. I talked to Pierre today and he would be happy to integrate things in framework we have to try tie things together. What would foremost be needed would be ways of treating data, meaning code that takes a raw spectral image and meta-data and converts it into “standard” format (spectral representation) that can then be fitted. Then also “plugins” that serve a specific purpose in the analysis/rendering that can be included in framework. The way I see it (and please comment if you see differently), there are ~4 steps here: Take raw data (in .tif,, .dat, txt, etc. format) and meta data (in .cvs, xlsx, .dat, .txt, etc.) and render a standard spectral presentation. Also take provided instrument response in one of these formats and extract key parameters from this Fit the data with drop-down menu list of functions, that will include different functional dependences and functions corrected for instrument response. Generate/display a visual representation of results (frequency shift(s) and linewidth(s)), that is ideally interactive to some extent (and maybe has some funky features like looking at spectra at different points. These can be spatial maps and/or evolution with some other parameter (time, temperature, angle, etc.). Also be able to display maps of relative peak intensities in case of multiple peak fits, and whatever else useful you can think of. Extract “mechanical” parameters given assigned refractive indices and densities I think the idea of fitting modified functions (e.g. corrected based on instrument response) vs. deconvolving spectra makes more sense (as can account for more complex corrections due to non-optical anomalies in future –ultimately even functional variations in vicinity of e.g. phase transitions). It is also less error prone, as systematically doing decon with non-ideal registration data can really throw you off the cliff, so to speak. My understanding is that we kind of agreed on initial meta-data reporting format. Getting from 1 to 2 will no doubt be most challenging as it is very instrument specific. So instructions will need to be written for different BLS implementations. This is a huge project if we want it to be all inclusive.. so I would suggest to focus on making it work for just a couple of modalities first would be good (e.g. crossed VIPA, time-resolved, anisotropy, and maybe some time or temperature course of one of these). Extensions should then be more easy to navigate. At one point think would be good to involve SBS specific considerations also. Think would be good to discuss a while per email to gather thoughts and opinions (and already start to share codes), and then plan a meeting beginning of March -- how does first week of March look for everyone? I created this mailing list (software@biobrillouin.org) we can use for discussion. You should all be able to post to (and it makes it easier if we bring anyone else in along the way). At moment on this mailing list is Robert, Carlo, Sal, Pierre and myself. Let me know if I should add anyone. All the best, Kareem This message and any attachment are intended solely for the addressee and may contain confidential information. If you have received this message in error, please contact the sender and delete the email and attachment. Any views or opinions expressed by the author of this email do not necessarily reflect the views of the University of Nottingham. Email communications with the University of Nottingham may be monitored where permitted by law. _______________________________________________ Software mailing list -- software@biobrillouin.org To unsubscribe send an email to software-leave@biobrillouin.org _______________________________________________ Software mailing list -- software@biobrillouin.org To unsubscribe send an email to software-leave@biobrillouin.org _______________________________________________ Software mailing list -- software@biobrillouin.org To unsubscribe send an email to software-leave@biobrillouin.org _______________________________________________ Software mailing list -- software@biobrillouin.org To unsubscribe send an email to software-leave@biobrillouin.org _______________________________________________ Software mailing list -- software@biobrillouin.org To unsubscribe send an email to software-leave@biobrillouin.org _______________________________________________ Software mailing list -- software@biobrillouin.org To unsubscribe send an email to software-leave@biobrillouin.org _______________________________________________ Software mailing list -- software@biobrillouin.org To unsubscribe send an email to software-leave@biobrillouin.org _______________________________________________ Software mailing list -- software@biobrillouin.org To unsubscribe send an email to software-leave@biobrillouin.org
Hi, On the principle I think that’s OK :) Regarding the treatment, I have created a first structure to do this inside the GUI. My idea was to have the fitting functions automatically found by the UI, and then used to generate an interactive GUI window with a graph of PSD vs Frequency where the user can indicate the parameters or extract them from clicks on the graph. The goal is to have an easily extendable UI (with the ability to compare treatments automatically) where every code can be added “rapidly” by everyone wanting to participate in the project (there are some limitations, like all the treatment has to be wrapped in one function, the type of the parameters have to be indicated in the header of the function, the docstring has to be written using Numpy docstring method… but these adaptations are pretty easy to do once the code is written). This development follows my initial idea of using the HDF5_BLS Python library as the backend of the project to be used independently of any UI. I think it would therefore be good to at least keep the treatments for any UIs we develop in the same library. Now to the reason why I’m just "OK with the principle": I might have not understood everything in Carlo’s approach so maybe there’s always a way to convert nested structures to his file format, but I am tempted to say this is not possible or at least very unpractical for some particular (like mine) cases. A concrete example: in an angle measurement using the angle resolved VIPA, I will have an IRF with the laser and at least at the beginning, an angle calibration sample obtained with the TFP, then a calibration of the ar-VIPA with the same sample, and then I will have my sample(s), which I will observe with different illumination angles, leading, for a multi sample measure, to a structure like this on my side (without using a unified nomenclature but just what each group contains): File.h5 -Data - TFP -Water (Angle calibration) - or whatever sample used for calibrating the angles - VIPA - Laser (IRF) - Water (Calibration) - or whatever sample used for calibrating the angles - Left Illumination - Right Illumination - Center Illumination - Samples - Sample 0 - Left Illumination - Raw_data - Frequency - PSD - Treat - Shift - Shift_std - Linewidth - Linewidth_std - Right Illumination... - Center Illumination... - Sample 1 ... By design here I have 2 distinct calibrations: TFP and ar-BLS VIPA. The calibration of the VIPA is in this case, three arrays of 512x512 points. I guess we could change the dimensionality of the arrays in “Calibration_spectra” to have a 3x512x512 array and place the TFP measures in another file (which therefore would force us to have 2 files for 1 measure, but OK) but then how do I store my 3 illumination angles in the same file? If I create a 3x512x512 PSD with a 3x512x512 Frequency array, technically it works but then how would it be visualized ? To be clear, I’m not even sure how to do it without the format. Now there’s another issue: in the previous example I was considering that I was acquiring the measures without touching at the illumination (or having a way to precisely switching between left, right and center). If I now have to mechanically move the illumination between samples, I will not use the above format but most likely this one (still compatible with my structure definition): File.h5 -Data - TFP -Water (Angle calibration) - or whatever sample used for calibrating the angles - VIPA - Laser (IRF) - Samples - Sample 0 - Water (Calibration) - or whatever sample used for calibrating the angles - Left Illumination - Right Illumination - Center Illumination - Left Illumination - Raw_data - Frequency - PSD - Treat - Shift - Shift_std - Linewidth - Linewidth_std - Right Illumination... - Center Illumination... - Sample 1 - Water (Calibration) - or whatever sample used for calibrating the angles - Left Illumination ... - Right Illumination... - Center Illumination… - Sample 2 ... Making a file with Carlo’s structure from case 1 is not the same as making it from case 2, and I’m not even talking about adding other hyper parameters, so this means having to do the conversion manually, to in the end have a structure that has been modified to allow for the storage of 3 different calibration angles (and therefore arguably not compatible with Carlo’s format definition), and possibly even not one but two files because of the TFP, that in the end would not be visualizable because I don’t even know how to visualize that yet… I agree that I have a very particular case and that if you store mappings with my structure, the conversion can be standardized relatively easily (and rapidly if I ask ChatGPT to read both Carlo’s and my documents and do the conversion) but then I would argue that we are deliberately building a format that I just cannot use with my measures (and I’m just one guy in our growing community)… Best, Pierre Pierre Bouvet, PhD Post-doctoral Fellow Medical University Vienna Department of Anatomy and Cell Biology Wahringer Straße 13, 1090 Wien, Austria
On 5/3/25, at 10:31, Kareem Elsayad via Software <software@biobrillouin.org> wrote:
Dear All,
Having read through the emails finally, here is what I gather. Keeping in mind that I may be misunderstanding things (correct me), this is how I would suggest we proceed. (Now it’s my go to write a long email 😊)
Carlo’s vision appears to be to have (conceptually) the equivalent of a .tiff file used in e.g. fluorescence confocal microscopy that represents one particular measurement. this could be data (in the form of PSD for each voxel) pertaining to a spatial 2D or 3D scan/image. It may also be a time course 2D or 3D set of images (as is also possible in .tiff). The file also contains metadata (objective, laser wavelength/power, etc. used – basically the stuff in our consensus reporting xls). In addition it also (optionally) contains the Instrument Response Function (IRF). Potentially the latter is saved in the form of a control spectra of a known (indicated) material, but I would say more ideally it is stored as an IRF as this is more universal (between techniques), requires no additional info (measured sample), and is easier and faster to work with on analysis/fitting side (saves additional extraction of IRF which will be technique dependent). Now this is all well and good and I am fine with this. The downside is that it is limited to wanting to look at images /volume-images and (optionally) how they evolve over time. If you want to see how something changes with temperature or any other variable, or e.g. between two mutants, you would just save each as a separate file. This is usually what biologists are used to. Sure it might not be the most memory efficient (you would have to write all the metadata in each) but I don’t see that as an issue since this doesn’t take up too much memory (and we’ve become a lot better at working with large files than we were say 10 years ago). The downside comes when you want to look at say how the BLS spectra at a single position or a collection of voxels changes as you tune some parameter. Maybe for static maps you could “fake it” and save as a time series, which software recognizes? However, if you have 50 different BLS spectra for each voxel in a 3D space in a time series measurement (from e.g. 50 different angles) you have an extra degrees of freedom …would one need 50 files, one for each angle bin?. So it’s not necessarily different experiments, but just in this case one additional degree of freedom. Given dispersion only needs to be in one direction and we have two degrees of freedom on our camera, one can envision this extra degree of freedom being used for various other things (I.e not only spatial or angular multiplexing). Then there is maybe some physical-chemist-biologist who wants to say measure the change in linewidth as he/she induces a phase transition by tuning one thing or another at a single point (or few points). He/she is probably fine fitting each spectra with their own code as they scan e.g. the temperature across the transition. The question is do we also want to cater for him/her or are we just purely for BLS imaging?
Pierre’s vision appears to be to have maximum flexibility in this regard, with a structure that is general enough to optimally accommodate for saving data for an entire multi-variable experiment. Namely if you do an angle-resolved map of a cell over time and repeat the experiments at different temperatures, and then say also for different mutants, you can store all that data in a single file. I think this is a very noble and cool idea, except that in practice you will (biology being biology) need to do this on >10 cells (in each case) to get anything statistically significant. You can in principle put that too into the same file, but now we are talking about firstly increased complexity (which I guess can theoretically be overcome since to most people this is a black box anyhow) but ultimately doing/reporting science in a way biologists – or indeed most scientists - are not used to (so it would be trend-setting in that sense – having an entire study in a single file, with statistics and so forth done not separately and differently between labs). This is certainly not a conceptually a crazy idea, and probably even the future of science (but maybe something best exploring firstly in a larger consortium with standard fluorescence, EM etc. techniques if it hasn’t already – which it probably has). It also makes things more amiable to be analyzed and compared (between different studies) by e.g. AI in a multi-variate/dimensional way (maybe should propose to Zuckerberg?). I digress. I think here it is worth keeping things not just as simple but also as basic as possible. With Nat Meth (assuming they consider interesting enough) the focus is biologists in their current state of mind, and with their current habits, and that is kind of what we need to cater for when trying to sell an exotic technique to the masses.
So, following my rambling, here is how I think we should proceed, as we need to move forward and not dwell on this longer. As mentioned in previous emails, this is basically two separate projects (of equal importance) that just need to agree on their meeting point in the middle. It is ideal that the goals are already more or less defined between getting raw data to a “standard” format (Vienna/Nottingham side), and “fitting/presenting” data (Heidelberg side). Not reaching a general consensus on the h5 format I would suggest that Carlo/Sebastian work with their file format and Pierre/Sal with theirs and we figure how to patch together after (see below).
It maybe would be good to clarify some of the lingo first to avoid misunderstandings. (Maybe the below has been defined, in which case ignore and see it as a reflection of my naivety)… Firstly, “treatment”. Is this “just” the step from getting from the raw acquired spectra to an agreed upon, universally applicable, presentation of the PDS for each voxel (excl. any decon., since we fit IRF modified Lorentzians/DHOs) which can be fed into the same fitting procedure(s)? This would I guess only include one peak (e.g. anti-Stokes) since in time domain that’s all you’ll get out anyhow. Does it refer to the entire construction of the h5 file? Does it include the fitting and extraction of the frequency shifts and linewidths? the calculation of viscoelastic moduli (if one provides auxiliary parameters like refractive index and density)? Secondly, and related, in dividing tasks it is also not clear to me if the “standard” h5 file contains also the fitted values for frequency shift/linewidth or just the raw data. From the division of work load my understanding is that the fitting will be done in Carlo/Sebastian’s code (?). Will the fitted values then also be included in the h5 file or not? (i.e. additionally written into it after it was generated from Pierre’s codes). There is no point of everybody doing their own fitting code, which would kinda miss the point of having some universality/standard? I guess to me it is unclear where the division of labor is. To keep things simple I would suggest that Pierre’s code simply generates the standard h5 file (unfitted, but in a standard PSD presentation for each voxel, and includes optional IRF), and then Carlo/Sebastian’s codes do the fitting and resaves the fitting parameters into some empty/assigned space in that same h5 file. If the h5 file already contains fitted paramaters (from previously running Carlo/Sebastian’s code) then these can directly be displayed (or one can chose to fit again and overwrite). How does this sound to everyone?
This does not address the contention of the file format. The solution proposed in our last Zoom meeting was creating a code that converts one (Pierre’s) file format to the other (Carlo’s). This is I think in light of the recent emails I think the only reasonable solution, and probably maybe even a great solution, considering that Pierre’s file format may contain multiple additional information (entire experiments) and the conversion between the two can allow one to e.g. pick out specific ones if and as relevant. It doesn’t have to be elaborate at this point, but it can have the potential to be for multi-variate data down the line. So this divide is actually a plus as it keeps door open for more complex data sets, without them being a neccesity. Would it maybe be possible for Pierre and Carlo to write this conversion program together as a first step? Just needs to be rudimentary so that individual parties can start working on their sides independently asap? This code can then in the end be tacked on to one or the other codes developed by the two parties, depending on what we decide to be the standard reporting format. It is also not crazy to consider in the end two file formats that can be accepted, one maybe called “measurement”-file format, and one “experiment”-file format, that the user selects between when importing? As such if this conversion code is in Pierre’s code one may have the option to export as one of these two formats. If it is also in Carlo’s code, one has option to read either format. This way one has option of saving as and reading out from both a single image/series of images (as is normally done in bioimaging) as well as an entire experiment as one pleases and everybody is happy 😊 How does this sound?
I hope the above is a suitable way to move forward, but ofcourse let me know your thoughts and happy with alternatives…
Regarding the bi-weekly meetings suggested by Robert. I still think this makes sense… Ofcourse not everybody needs to attend all if busy, but having this time slot earmarked in calender for when it becomes necessary might be nice. I will send out an email with dates/invite info…
All the best, and hope this moves forward from here!!:) Kareem
From: Pierre Bouvet via Software <software@biobrillouin.org <mailto:software@biobrillouin.org>> Reply to: Pierre Bouvet <pierre.bouvet@meduniwien.ac.at <mailto:pierre.bouvet@meduniwien.ac.at>> Date: Tuesday, 4. March 2025 at 11:20 To: Carlo Bevilacqua <carlo.bevilacqua@embl.de> Cc: "software@biobrillouin.org" <software@biobrillouin.org> Subject: [Software] Re: [EXTERN] Re: Software manuscript / BLS microscopy
Hi everyone,
The spec sheet I defined for the format is there <https://github.com/bio-brillouin/HDF5_BLS/blob/main/guides/SpecSheet/SpecShe...> (I thought I had pushed it already but it seems not). To make it simple, my aim is to have a simple way (emphasis on simple) to store any kind of data obtained with as many different setups as possible, follow a unified pipeline <https://github.com/bio-brillouin/HDF5_BLS/blob/main/guides/Pipeline/Pipeline...> and allow a unified treatment of the data. From this spec sheet I built this structure <https://github.com/bio-brillouin/HDF5_BLS/blob/main/guides/Project/Project.p...> which I’ve been using for a few months now and that seems robust enough, in fact what blocked me for adapting it to time-domain was not the structure but the code I already had written to implement it. Once again, visualizing data is not the priority for me, because I believe the main problem in the community today is that we don’t have a single, robust and well-characterized way of extracting information from a PSD.
Best,
Pierre
Pierre Bouvet, PhD Post-doctoral Fellow Medical University Vienna Department of Anatomy and Cell Biology Wahringer Straße 13, 1090 Wien, Austria
On 3/3/25, at 21:32, Carlo Bevilacqua via Software <software@biobrillouin.org> wrote:
Hi all, we are still trying to find an agreement with Pierre but I think that, a part from the technicalities that we can probably figure out between ourselves, we have a different view on the aims of the file format and the project in general.
Although I agree that for now we could work with separate files and convert between them, eventually we need to agree on a format to propose as a standard and I want to avoid postponing the decision (at least for the general structure, of course minor details can change during the process). Otherwise I am afraid that, once most of the code is written, it will be hard to unify it and this will make the decision even more difficult.
What I see as the main points of this project are: to have some sort of TIFF for Brillouin data, with the main aim of storing images (i.e. spatial maps of a sample) together with the spectral data that it is used to generate them and the relevant metadata and calibration data while allowing the possibility of storing single spectra or spectra acquired in different conditions in multiple samples (i.e. having a whole study in a single file), I don't see this as a determinant in defining the file. That is because the same result can be achieved by having multiple file with a clear naming convention (e.g. ConcentrationX_TemperatureY_SampleN), which is commonly done in microscopy and I feel it is a "cleaner" solution than having everything in a single file the analysis part of the software should be able to perform standard Brillouin analysis (i.e. fit the spectra with different functions that the user can select) but possibly more advanced stuff (like PCA or non-negative matrix factorisation) the visualization part would be similar to this <https://www.nature.com/articles/s41592-023-02054-z/figures/10>, where the user can click on a pixel and see the corresponding spectrum (possibly selecting different fit functions and see the result on the fly). If multiple images are stored in the file, some dropdown menus would appear to select the relevant parameters, which identify a single image. I discussed about these points with Robert and Sebastian and we agree on them. The structure of the file I proposed (and refined with input from Pierre and Sebastian) is designed with these aims in mind.
@Pierre, can you please list your aims? I don't want write what I understood from you because I might misrapresent them.
It would be good to have your feedback on what you consider to be the main aims and priorities, so we can have the last iteration on the format, as we'd like to proceed with the actual coding.
Best regards, Carlo
On Fri, Feb 28, 2025 at 19:01, Pierre Bouvet via Software <software@biobrillouin.org <mailto:software@biobrillouin.org>> wrote:
Hi everyone :)
As I told you during the meeting, I just pushed everything on Git and merged with main. You can normally clone the project and test it on your machines by running the HDF5_BLS_GUI/main.py script from base repository. If it doesn’t work, it might be an os compatibility issue on the paths, but I’m hopeful I won’t have to patch that ^^ You can quickly test it with the test data provided in tests/test_data, this will however only allow you to do the most basic things (import data and edit parameters). A first version of the parameter spreadsheet (the child of the Consensus paper) is located in “spreadsheets”. You can open this file and edit it and then export it as csv. The exported csv can be dragged and dropped into the right frame of the GUI to update all the parameters of the group or dataset that you have selected in the left frame. Naturally, this GUI is built on the hierarchical structure I propose for the HDF5 file (described in guides/Project/Project.pdf), note however that it can be adjusted to a linear approach (cf discussion of today) so see this more as a first “usability” test of a - relatively - stable version, and a way for you to make a list of everything that is wrong with the software. @ Sal: I’ll soon have the code to convert your data to PSD & frequency arrays, but I’m confident you can already use the format to store your spectra as time arrays (with abscissa) from your .dat and .con files (and .. Note that because I don’t have order of magnitudes for the parameters you use, I could only test the GUI and its usability. In case you are looking for the code for importing your data, it’s in HDF5_BLS/load_formats/load_dat.py in the “load_dat_TimeDomain” function Last thing: I located the developer guide I couldn’t find during the meeting and placed it back where I thought it was (guides/DeveloperGuide/ModuleDeveloperGuide.pdf). I’m underlining this document because this is maybe the most important one of the whole project since it’s where people that want to collaborate after it’s made public will go to. The goal of this document is to take people by the hand and help them making their additions compatible with the whole project. For now this document only talks about adding data.
Best,
Pierre
Pierre Bouvet, PhD Post-doctoral Fellow Medical University Vienna Department of Anatomy and Cell Biology Wahringer Straße 13, 1090 Wien, Austria
On 28/2/25, at 14:18, Carlo Bevilacqua via Software <software@biobrillouin.org <mailto:software@biobrillouin.org>> wrote:
Hi all,
I made a file describing the file format, you can find it here <https://github.com/bio-brillouin/HDF5_BLS/blob/main/Bh5_file_spec.md>. I think that attributes are easy to add and names of groups/datasets can be changed (if they are unclear now), so these are details that we don't need to discuss now. What I find most important to agree on now is the general structure. In that sense that are still some points under discussion between me and Pierre, but hopefully we can iron them out during the meeting.
Talk to you in a bit, Carlo
On Wed, Feb 26, 2025 at 23:56, Kareem Elsayad <kareem.elsayad@meduniwien.ac.at <mailto:kareem.elsayad@meduniwien.ac.at>> wrote:
Hi Carlo,
Sounds great!
Yes, Fri 28th @3pm still works for me. If it works for others, here is Zoom we can use:
https://us02web.zoom.us/j/5191046969?pwd=alpzaldoZEd3N2ZEQ0hYZU1RR1dOdz09
Meeting ID: 519 104 6969
Passcode: jY3zH8
All the best,
kareem
From: Carlo Bevilacqua via Software <software@biobrillouin.org <mailto:software@biobrillouin.org>> Reply to: Carlo Bevilacqua <carlo.bevilacqua@embl.de <mailto:carlo.bevilacqua@embl.de>> Date: Wednesday, 26. February 2025 at 20:43 To: Kareem Elsayad <kareem.elsayad@meduniwien.ac.at <mailto:kareem.elsayad@meduniwien.ac.at>> Cc: "software@biobrillouin.org <mailto:software@biobrillouin.org>" <software@biobrillouin.org <mailto:software@biobrillouin.org>> Subject: [Software] Re: [EXTERN] Re: Software manuscript / BLS microscopy
Hi Kareem,
thank you for your email.
We are discussing with Pierre about the details of the file format and hopefully by our next meeting we will have agreed on a file format and we can divide the tasks.
If it is still an option, Friday 28th at 3pm works for me.
Best regards,
Carlo
On Mon, Feb 24, 2025 at 03:17, Kareem Elsayad <kareem.elsayad@meduniwien.ac.at <mailto:kareem.elsayad@meduniwien.ac.at>> wrote:
Dear All,
I (and Robert) were hoping there would be some consensus on this h5 file format. Let us do a Zoom on Fri 28th Feb at 15:00?
A couple of points pertaining to arguments…
Firstly, the precise structure is not worth getting into big arguments or fuss about…as long as it contains all the information needed for the analysis/representation, and all parties can work with (able to write and read knowing what is what), it ultimately doesn’t matter. In my opinion better put more (optional) stuff in if that is issue, and make it as inclusive as possible. In the end this does not need to be read by analysis/representation side, and when we go through we can decide if and what needs to be stripped. It is after all the “black box” between doing the experiment and having your final plots/images. Take a look at say a Zeiss file and try figure all that’s in it (it is not ideally structured maybe, but no biologist ever cared) – that said, I am sure their team had very similar arguments concerning structure etc.! (you have as many opinions as people). Maybe the issue is that the boundary conditions were not as well defined, but I would say at this point make them more inclusive than they need to be (empty spaces cost little memory)
Secondly, and following on from firstly. We need to simply agree and compromise to make any progress asap. Rather than building separate structures we need to add/modify a single existing structure or we might as well be working on independent projects. Carlo’s initially proposed structure seemed reasonable, maybe with some minor changes, and we should just go with that as a basis in my opinion. I would suggest that Pierre and Carlo have a Zoom together and try and come up with something that is acceptable to both. Like everything in life, this will involve making compromises. And then present it on 28th Feb. Quite simply, if there is no agreement we cannot do this project and in the end it doesn’t matter who is right or wrong.
Finally, I hope the disagreements from both sides are not seen as negative or personal attacks –it is ok to disagree (that’s why we have so many meetings!) On the plus side we are still more effective than the Austrian government (that is still deciding who should be next prime minister like half a year after elections) 😊
All the best,
Kareem
From: Pierre Bouvet via Software <software@biobrillouin.org <mailto:software@biobrillouin.org>> Reply to: Pierre Bouvet <pierre.bouvet@meduniwien.ac.at <mailto:pierre.bouvet@meduniwien.ac.at>> Date: Friday, 21. February 2025 at 11:55 To: Carlo Bevilacqua <carlo.bevilacqua@embl.de <mailto:carlo.bevilacqua@embl.de>> Cc: <software@biobrillouin.org <mailto:software@biobrillouin.org>> Subject: [Software] Re: [EXTERN] Re: Software manuscript / BLS microscopy
Hi Carlo,
Thanks for your reply, here is the next pong of this ping pong series ^^
1- I was talking indeed about the enums, but also the parameters that are defined as integers or floating point numbers and uint32. I think its easier (and that we already agreed on) having a spreadsheet with the parameters (easy to use, easy to update, easy to store and modify between two experiments using the same setup, allows to impose fixed choices for some parameters with drop-down lists, allows to detail the requirements for the attribute like its format or units and allows examples) and to just import it in the HDF5 file. >From there it’s easier to have every attribute as strings both for the import and for the concept of what an attribute is.
2- OK
3- The problem is not necessarily the number of experiments you put in the file but the number of hyper parameters you want to take into account. Let’s take an example with a doubtable sense: I want to study the effect of low-frequency temperature fluctuations on micro mechanics in active samples both eukaryote and prokaryote showing a layered structure (endothelial cells arranged in epidermis, biofilms, …) with different cell types, and as a function of aging. I would then create a file with a first range of groups for the age of the sample, then inside these groups 2 groups for eukaryote and prokaryote samples, then inside these groups N groups for the samples I’m looking at, then inside these groups M groups for the temperature fluctuations I impose, then inside these groups the individual measures I make (this is fictional, I’m scared just to think at the amount of work to have all the samples, let alone measure them), this is simply not possible with your approach I think, and even simpler experiments like to measure the Allan variance on an instrument using 2 samples is not possible with your structure I think.
4- /
5- I think the real question is what we expect to get from a wrapper: for me is to wrap the measures of a given study, to then share, link to papers, treat using new approaches… Having a structure that can wrap both a full study and an experiment is in my opinion better in the long run than forcing the format to be used with only one experiment.
6- Yes, I understand it is an identifier, but why an integer? Why not a tuple? Why not a hash? And what if there’s a bug and instead of 3 you store you store 3.0, or 2, or ‘e'? Do you imagine the amount of work to understand where this bug comes from? Assuming it’s a bug because it might very well be just an inexperienced user making a mistake and then your file is broken. The idea is good but the safer way to have this is to work with nD arrays where the dimensionality is conserved I think, or just have all the information in the same group.
7- Here again, it’s more useful for your application but many people don’t use maps, so why force them to have even an empty array for that? Plus if they need to have a dedicated array for the concentration of crosslinkers (for example), they are faced with a non-trivial solution, which means they won’t use the format.
8- Yes, we could add an additional layer, but then it means that if you don’t need it, your datasets are in plain in the group and if you need it, then you don’t have the same structure. The solution I think is to already have the treated data in a group, if you don’t need more than one group (which will be most of the time the case) then you’ll only have one group of treated data.
9- I think it’s not useful. The SNR on the other hand is useful, because in shot-noise regime it’s a marker of variance, and this is one of the ways to spot outliers from treatment (if the SNR doesn’t match the returned standard deviation on the shift of one peak, there’s a problem somewhere).
10- The std of a fit is obtained by taking the square root of the diagonalized covariant matrix returned by the fit as long as your parameters are independent (it’s super interesting actually and a little bit more complicated but it’s true enough for lorentzian, DHO, Gaussian...)
11- OK but then why not have the calibration curves placed with your measures if they are only applicable to this measure? Once again, I think having indexes that are modifiable by the user is not safe (the technical term is “idiot proof”)
12- I don’t agree, if you are capturing points at a fixed interval, then you can reconstruct the timestamp from the timestamp of the first acquisition and either the delay between two acquisitions or the timestamp of the last acquisition. Most of the time however we don’t even need this as we consider the sample to be time-invariant on the scale of our measure, so a single timestamp for all the measure is enough and is better stored as an attribute. In the special case where we are not time-invariant, then time becomes the abscissa of the measures and in that case yes, it can be a dataset, but then it’s better to not impose a fixed name for this dataset and rather let the user decide what hyper parameter is changed during he’s measure, this way the user is free to use whatever hyper parameters he feels like it.
13- OK
14- Still not clear to me. My approach is to consider an experiment to be a measure of a sample as function of one or more controlled or measured hyper parameter. So my general approach for storing experiments is have 3 files: abscissa (with the hyper parameters that vary), measure and metadata, which translates to “Raw_data”, “Abscissa_i” and attributes for this format.
15- OK, I think more than brainstorming about how to treat correctly a VIPA spectrum, we need to allow people to tell how they do it if we want this project to be used in short term, unification is a goal of this project and we will advertise it in the paper, but to be honest, I doubt people like Giuliano will run with it without second guessing it, particularly with its clinical setups, so there will be some going back and forth before we have something stable, and this means we need to allow for this back and forth to appear somewhere, I propose having it as a parameter.
16- Here I think you allow too much liberty, changing the frequency of an array to GHz is trivial and I think most people do use GHz as the unit of their frequency arrays anyway. We need to make it clear that the frequency axis is in GHz but I think we don’t need a full element for this. If you really want to specify the unit of the Frequency dataset, I would suggest putting it in its attributes in any case, and not as another element in the structure.
17- OK
18- I think it’s one way to do it but it is not intuitive: I won’t have the reflex to go check in the attributes if there is a parameter “sam_as” to see if the calibration applies to all the curves. The way I would expect it to be is using the hierarchical logic of the format: if I’m looking at a dataset in a sub-group of a group containing a calibration dataset, then I know this calibration applies to my data:
Data
|- Data_0 (group)
| |- Calibration (dataset)
| |- Data_0 (group) | | |- Raw_data (dataset)
| |- Data_1 (group) | | |- Raw_data (dataset)
|- Data_1 (group)
| |- Calibration (dataset)
| |- Data_0 (group)
| | |- Raw_data (dataset)
I think in this example most people would suppose Data/Data_0/Calibration applies both to Data/Data_0/Data_0/Raw_data and Data/Data_0/Data_1/Raw_data but not Data/Data_1/Data_0/Raw_data whose calibration is intuitively Data/Data_1/Calibration
Once again, my approach of the structure is trying to make it intuitive and most of all, simple. For instance if I place myself in the position of someone that is willing to try “just to see how it works”, I would give myself 10s to understand how I could have a file for only one measure that complies with the new (hope to be) standard. It is my opinion as I already told you before, that your approach is too complete and therefore complex, which will inevitably lead to people not using the format unless there’s a GUI to do it for them (and even then they might not use it). I don’t want to impose my vision here, and like you I have put a lot of thinking (and testing) into building the format I propose, but I’m convinced that if we go with your structure, not only will it make it hard for anyone to understand how to use it but we’ll have problems using it ourselves. I want to repeat that I don’t have the solution, I’m just confident that my approach is much easier to conceptually understand and less restrictive than yours. In any case we can agree to disagree on that, but then it’ll be good to have an alternative backend like the one I did with your format to try and use it, and see if indeed it’s better, because if it’s not and people don’t use it, I don’t want to go back to all the trouble I had building the library, docs and GUI just to try.
I don’t want to impose you anything but it would be awesome if you took the time to read the document I made and completed for you yesterday. Then you can just tell me where you think I’m missing something and you had a better solution because as you might see, I’m having problems with nearly all your structure and we can’t really use it as a starting point at this stage since most of the backend is written and the front-end is already functional for my setup (and soon Sal’s and the TFP).
Best,
Pierre
Pierre Bouvet, PhD
Post-doctoral Fellow
Medical University Vienna
Department of Anatomy and Cell Biology
Wahringer Straße 13, 1090 Wien, Austria
> On 20/2/25, at 22:55, Carlo Bevilacqua <carlo.bevilacqua@embl.de <mailto:carlo.bevilacqua@embl.de>> wrote: > > > > > > > > > Hi Pierre, > > > > > thank you for your feedback. I appreciate that you took the time to go through my definition and highlighting the critical points. > > > > > I much prefer this rather than starting working with a file format where problem might arise in the future. If we understand what are the reasons behind our choices in the definition we can merge the best of the two approaches, rather than defining two "standards" for the same thing with each of them having their limitations. > > > > > > > > > I will provide an answer to each of the points you raised (I gave numbers to the points in your email below, so it is easier to reference): > > > > > I am not sure to which attribute you are referring specifically, but I am completely fine with text; I defined enums where I felt it makes sense to do so because there is a discrete number of options (one could always add elements at the end of an enum) > I defined the attributes before we started working together and I am very much open to changing them so they reflect what you have in the spreadsheet; in the document defining the file format we can just state that the attributes and their type are defined in the excel sheet > I did it this way because in my idea an individual HDF5 file corresponds to a single experiment. If you feel there is an advantage in keeping different experiments in the same file I am open to introduce your structure of subgroups; I honestly feel like this will only make the file unnecessarly large and different experiments would mostly not share much (apart from the metadata, which is anyway a small overhead in terms of filesize). Now of course the question is what you define as an 'experiment': for me different timepoints or measurements at different temperatures/angles/etc on the same sample are a single experiment and I defined the file so that it is possible to save them in a single file; measurements on different samples are not the same experiment in my original idea > same as the point 3 > same as before, I would put different samples in different files but happy to introduce your structure if you feel there is an advantage > the index is used to uniquely identify an entry in the 'Analysed_data' table; it is important in the contest of reconstructing the image (see the definition of the 'tn/image' group) > in my opinion spatial coordinates have a privileged role since we are doing imaging and having them well defined it is important to reconstruct the image; for different abscissas I defined the 'parameters' dataset (more in point 14). If one is not doing imaging this dataset can be set to an empty array or a single element (we can include this in the definition) > in my idea the "Analyzed_data" group doesn't contain multiple treatments but the result of the fit on the 'final' spectra, which are unique; if you are referring to the 'n' in the 'Shift_n_GHz' that is included in case a multipeak fit is performed. Now, if we want to include the possibility of multiple treatments like you are doing (which I didn't originally consider) we could just add an additional layer to the hierarchy > that is the amplitude of the peak from the fit. I am not sure if you didn't understand what I meant or you think it is not an useful information > The fit error actually contains 2 quantities: R2 and RMSE (as defined in the type). I am not sure how you would calculate a std from a single spectrum > the calibration curves are stored in the 'calibration_spectra' group with the name of the dataset matching the respective 'Calibration_index'. In our VIPA setup we are acquiring multiple calibration curves during a single acquisition to compensate for laser drift, that's why I introduced the possibility of having multiple calibration curves. Note that the 'Calibration_index' is defined as optional exactly because it might not be needed > each spectrum can have its own timestamp if it is acquired from a different camera image or scan of a FP, etc that's why it needs to be a dataset. Note that it is an optional dataset > good point, we can rename it to PSD > that is exactly to account for the general case of the abscissa not being a spatial coordinate and it contains the values for the parameters (e.g. the angles in an angle resolved measurement). It is a dataset whose dimensions are defined in the description (happy to elaborate more if it is not clear) > float is the type of each element; it is a dataset whose dimensions are defined in the description; the way to define the frequency axis in general for setups which don't have an absolute frequency (like VIPAs) is tricky and would be good to brainstorm about possibile solutions > as for the name we can change it, but the problem on how to deal with the situation when one doesn't have the frequency in GHz remains. My idea here was to leave the possibility of different units because the fit and most of the data analysis can be performed even if the x-axis is not in GHz and the actual conversion of the shift to GHz can be done at the end and requires the calibration data. As in my previous point, I am happy to brainstorm different solutions to this problem > it is indeed redundant with 'Analyzed_data' and I pushed a change on GitHub to correct this > see point 11; also note that the group is optional (in case people don't need it) and I introduced the attribute "same_as" to avoid repeating it multiple times if it is always the same for all the 'tn' > As you see we agree with some of the points or we could find a common solution, for others it was mainly a misunderstanding on what were my intentions (probably my bad in expressing them, but you could have asked if it was not clear). > > > > > > > > > Hope this helps claryfing my reasoning in the file definition and I am happy to discuss all the open points. > > > > > I will look in details at your newest definition that you shared in the next days. > > > > > > > > > Best, > > > > > Carlo > > > > > > > On Thu, Feb 20, 2025 at 18:25, Pierre Bouvet via Software <software@biobrillouin.org <mailto:software@biobrillouin.org>> wrote: > > > > >> Hi, >> >> >> >> >> >> >> >> >> My goal with this project is to unify the treatment of BLS spectra, to then allow us to address fundamental biophysical questions with BLS as a community in the mid-long term. Therefore my principal concern for this format is simplicity: measure are datasets called “Raw_data”, if they need one or more abscissa to be understood, this/these abscissa are called “Abscissa_i” and they are placed in groups called “Data_i” where we can store their attributes in the group’s attributes. From there, I can put groups in groups to store an experiment with different ... (e.g. : samples, time points, positions, techniques, wavelengths, patients, …). This structure is trivial but lacks usability so I added an attribute called “Name” to all groups that the user can define as he wants without impacting the structure. >> >> >> >> >> Now here are a few critics on Carlo’s approach. I didn’t want to share them because I hate criticizing anyone’s work, and I do think that what Carlo presented is great, but I don’t want you to think that I just trashed what he did, to the contrary, it’s because I see limitations in his approach that I tried developing another, simpler one. So here are the points I have problems with in Carlo’s approach: >> >> >> >> >> The preferred type of the information on an experiment should be text as we’ll likely see new devices (like your super nice FT approach) appear in the next months/years that will require new parameters to be defined to describe them. I think we should really try not to use anything else than strings in the attributes. >> The experiment information should not be defined by the HDF5 file structure but rather by a spreadsheet because everyone knows how to use Excel, and it’s way easier to edit an Excel file than an HDF5 file. >> Experiment information should apply to measures and not to files, because they might vary from experiment to experiment, I think their preferred allocation is thus the attributes of the groups storing individual measures (in my approach) >> The characterization of the instrument might also be experiment-dependent (if for some reason you change the tilt of a VIPA during the experiment for example), therefore having a dedicated group for it might not work for some experiments >> The groups are named “tn” and the structure does not present the nomenclature of sub-groups, this is a big problem if we want to store in the same format say different samples measured at different times (the logic patch would be to have sub-groups follow the same structure so tn/tm/tl/… but it should be mentioned in the definition of the structure) >> The dataset “index” in Analyzed_data is difficult to understand, what is it used for? I think it’s not useful, I would delete it. >> The "spatial position" in Analyzed_data supposes that we are doing mappings. This is too restrictive for no reason, it’s better to generalize the abscissa and allow the user to specify a non-limiting parameter (the “Name” attribute for example) with whatever value he wants (position, temperature, concentration of whatever, …). A concrete example of a limit here: angle measurements, I want my data to be dependent on the angle, not the position. >> Having different datasets in the same “Analyzed_data” group corresponding to the result of different treatments raises the question of where the process followed to treat the data is stored. A better approach would be to create n groups “Analyzed_data_n” with only one dataset of treated values, allowing for the process to be stored in the attributes of the group Analyzed_data_n >> I don’t understand why store an array of amplitude in “Analyzed_data”, is it for the SNR? Then maybe we could name this array “SNR”? >> The array “Fit_error_n” is super important but ill defined. I’d rather choose a statistical quantity like the variance, standard deviation (what I think is best), least-square error… and have it apply to both the Shift and Linewidth array as so: “Shift_std” and “Linewidth_std" >> I don’t understand “Calibration_index”: where are the calibration curves? Are they in “experiment_info”? If so, we expect people to already process their calibration curves to create an array before adding them to the hdf5 file? I’m not very familiar with all devices, so I might not see the limitations here but do we ever have more than one calibration curve per measure? Could we not add it to the group as a “Calibration” dataset? Or just have one group with the calibration curve? >> Timestamp is typically an attribute, it shouldn’t be present inside the group as an element. >> In tn/Spectra_n , “Amplitude” is the PSD so I would call it PSD because there are other “Amplitude” datasets so it’s confusing. If it’s not the PSD, I would call it “Raw_data”. >> I don’t understand what “Parameters” is meant to do in tn/Spectra_n, plus it’s not a dataset so I would put it in attributes or most likely not use it as I don’t understand what it does. >> Frequency is a dataset, not a float (I think). We also need to have a place where to store the process to obtain it. In VIPA spectrometers for instance this is likely a big (the main even I think) source of error. I would put this process in attributes (as a text). >> I don’t think “Unit” is useful, if we have a frequency axis, then we should define it directly in GHz, and if it’s a pixel axis, then for one we should not call it “Frequency” and then it’s better not to put anything since by default we will consider the abscissa (in absence of Frequency) as a simple range of the size of the “Amplitude” dataset. >> /tn/Images: it’s a good idea, but I believe this is redundant with “Analyzed_data” (?) If it’s not then I don’t understand how we get the datasets inside it. >> “Calibration_spectra” is a separate group, wouldn’t it be better to have it in “Experiment_info” in the presented structure? Also might scare off people that might not want to store a calibration file every time they create a HDF5 file (I might or might not be one of them) >> Like I said before, I don’t want this to be taken as more than what lead me to defining a new approach to the format. I want to state once again that Carlo's structure is complete, only it’s useful for specific instruments and applications, and difficultly applicable to other techniques and scenarios (and more lazy people like myself). >> >> >> >> >> Following Carlo’s mail, I’ve also completed the PDF I made to describe the structure I use in the HDF5_BLS library, I’m joining it to this email and pushing its code to GitHub <https://github.com/bio-brillouin/HDF5_BLS/blob/GUI_development/guides/Projec...>, feel free to edit it and criticize it at length (I feel like I deserve it after this email I really tried not to write). >> >> >> >> >> >> >> >> >> Best, >> >> >> >> >> >> >> >> >> Pierre >> >> >> >> >> >> >> >> >> >> >> >> >> Pierre Bouvet, PhD >> >> >> >> >> Post-doctoral Fellow >> >> >> >> >> Medical University Vienna >> >> >> >> >> Department of Anatomy and Cell Biology >> >> >> >> >> Wahringer Straße 13, 1090 Wien, Austria >> >> >> >> >> >> >> >> >> >> >> >> >> >> >> >> >> >> >> >> >> >> >> >> >> >> >> >>> On 20/2/25, at 16:12, Robert Prevedel via Software <software@biobrillouin.org <mailto:software@biobrillouin.org>> wrote: >>> >>> >>> >>> >>> >>> >>> >>> >>> Dear all, >>> >>> >>> >>> >>> >>> >>> >>> >>> great to see all this discussion in this thread, and thanks to especially Pierre and Carlo for driving this forward. I’ve been following the various emails and arguments closely but simply didn’t have any time to chip in due to some important committments in the past days. >>> >>> >>> >>> >>> >>> >>> >>> >>> I understand that there was a bit of a disagreement about what the focus of this effort should be, so maybe it just helps to highlight my lab's view on this (which I just discussed in depth with Carlo and Sebastian): >>> >>> >>> >>> >>> >>> >>> >>> >>> Our original motivation was to come up with and define a common file-format, as we regard this to be key to unify the processing and visualization of Brillouin data by the community. In this respect, we would be happy to focus our efforts on defining this format and taking care of implementing the necessary processing/visualization software and interface that allows anyone to look at the data in the same way. We also regard this to be crucial if we want to standardize the reporting of Brillouin data from diverse setups/users/applications. >>> >>> >>> >>> >>> >>> >>> >>> >>> Therefore, at this stage it would be extremely important to agree on the structure of the file format. Carlo has proposed a very well thought-through structure for this, and it would be great to get your concrete feedback on this, as I understand this hasn’t really happened yet. To aid in this, e.g. Pierre and/or Sal could try to convert or save your standard data into this structure, and report on any difficulties or ambiguities that he encounters. >>> >>> >>> >>> >>> >>> >>> >>> >>> Based on this I agree it’s best to meet and discuss and iron this out as a next step, however it either has to be next week (ideally Fri?), or after March 12 as I am travelling back-to-back in the meantime. Of course feel free to also meet without me for more technical discussions if this speeds up things. Either way we could then also discuss the file format etc. for the ‘raw’ data that Pierre proposed (and which is indeed very valuable as well). >>> >>> >>> >>> >>> >>> >>> >>> >>> Let me know your thoughts, and let’s keep up the great momentum and excitement on this work! >>> >>> >>> >>> >>> >>> >>> >>> >>> Best, >>> >>> >>> >>> >>> >>> >>> >>> >>> Robert >>> >>> >>> >>> >>> -- >>> >>> >>> >>> >>> Dr. Robert Prevedel >>> >>> >>> >>> >>> Group Leader >>> >>> >>> >>> >>> Cell Biology and Biophysics Unit >>> >>> >>> >>> >>> European Molecular Biology Laboratory >>> >>> >>> >>> >>> Meyerhofstr. 1 >>> >>> >>> >>> >>> 69117 Heidelberg, Germany >>> >>> >>> >>> >>> >>> >>> >>> >>> Phone: +49 6221 387-8722 >>> >>> >>> >>> >>> Email: robert.prevedel@embl.de <mailto:robert.prevedel@embl.de> >>> >>> >>> >>> http://www.prevedel.embl.de <http://www.prevedel.embl.de/> >>> >>> >>> >>> >>> >>> >>> >>> >>> >>> >>> >>> >>> >>> >>> >>> >>> >>> >>> >>> >>> >>> >>>> On 20.02.2025, at 10:29, Carlo Bevilacqua via Software <software@biobrillouin.org <mailto:software@biobrillouin.org>> wrote: >>>> >>>> >>>> >>>> >>>> >>>> >>>> >>>> >>>> Hi Kareem, >>>> >>>> >>>> >>>> >>>> >>>> >>>> >>>> >>>> thanks for the suggestion, I agree that it is a good (and easy) way to divide the tasks! Just to be clear, it is not that I don't see the need/advantage of providing some standard treatment going from raw data to standard spectra, it is just that was not my priority when proposing the idea of a unified file format. >>>> >>>> >>>> >>>> >>>> >>>> >>>> >>>> >>>> Regarding the file format, splitting the one containing the raw data and the treatments from the one containing the spectra and the image in a standard format might be a good solution and we can always merge them at a later stage. >>>> >>>> >>>> >>>> >>>> >>>> >>>> >>>> >>>> As for the file containing the "standard" spectra, it would be very helpful if you can give some feedback on the structure I originally proposed <https://github.com/prevedel-lab/Brillouin-standard-file/blob/main/docs/Bh5_f...>. Keep in mind that the idea is to be able to associate spectrum/spectra to each pixel in the image, in a way that is independent of the scanning strategy and underlaying technique. I tried to find a solution that works for the techniques I am aware of, considering the peculiarities (e.g. for most VIPA setups there is no absolute frequency axis but only relative to water). If am happy to discuss why I made some specific choices and if you see a better way to achieve the same or see things differently. >>>> >>>> >>>> >>>> >>>> >>>> >>>> >>>> >>>> Both the 3rd and the 4th of March work for me. >>>> >>>> >>>> >>>> >>>> >>>> >>>> >>>> Best, >>>> >>>> >>>> >>>> >>>> Carlo >>>> >>>> >>>> >>>> >>>> On Thu, Feb 20, 2025 at 02:50, Kareem Elsayad via Software <software@biobrillouin.org <mailto:software@biobrillouin.org>> wrote: >>>> >>>> >>>> >>>> >>>>> Dear All, (and I guess especially Carlo & Pierre 😊) >>>>> >>>>> >>>>> >>>>> >>>>> >>>>> I understand both your (main) points concerning what this all should be, and I think this is actually perfect for dividing tasks. The format of the hf or bh5 file being where things meet and what needs to be agreed on. >>>>> >>>>> >>>>> >>>>> >>>>> >>>>> The thing with raw data is ofcourse that it is variable between instruments and labs, and the conversion to “standard spectra” that can then be fitted etc. is going to be unique (maybe even between experiments in same project). That said, asking people to create some complex file from their data that works with a developed software is also unlikely to get a following. >>>>> >>>>> >>>>> >>>>> >>>>> >>>>> So (the way I see it) there are basically two parts. Getting from raw data to h5 (or bh5) format which contains the spectra in standard format. And then the whole analysis part and visualization (GUI, pretty features, etc.). >>>>> >>>>> >>>>> While the latter may get the spotlight, it obviously relies heavily on the former being done right. Given that there are numerous “standard” BLS setup implementations the development of software for getting from raw data to h5 I think makes sense, since the h5 will no doubt be cryptic, and creating a working h5 is not something everyone will want to program by themselves (it is not an insignificant step given we are also trying to ultimately cater to biologists). As such a software that generates the h5 files, with drag and drop features and entering system parameters, for different setups makes sense and will save many labs a headache if they don’t have a good programmer on hand. >>>>> >>>>> >>>>> >>>>> >>>>> >>>>> So I would suggest that Pierre & Sal lead the work on developing this, while Carlo & Sebastian lead the work on developing the analysis/interface-presentation part. This way things are nicely divided and we just need to agree on the h5 file that is transferred between the two. From the side of Pierre & Sal there could maybe also be a second h5 generated that contains all the raw data and details on how it was converted to the transferred h5 file (for complete transparency this could then also be reported in papers if people wish). These could exist as two separate programs with respective GUIs but also eventually combined to a single one. >>>>> >>>>> >>>>> How does this sound to everyone? >>>>> >>>>> >>>>> >>>>> >>>>> >>>>> To clear up details and try assign tasks going forward how about a Zoom first week of March (I would be free Monday 3rd and Tue 4th after 1pm)? >>>>> >>>>> >>>>> >>>>> >>>>> >>>>> All the best, >>>>> >>>>> >>>>> Kareem >>>>> >>>>> >>>>> >>>>> >>>>> >>>>> >>>>> >>>>> >>>>> >>>>> >>>>> >>>>> From: Carlo Bevilacqua via Software <software@biobrillouin.org <mailto:software@biobrillouin.org>> >>>>> Reply to: Carlo Bevilacqua <carlo.bevilacqua@embl.de <mailto:carlo.bevilacqua@embl.de>> >>>>> Date: Wednesday, 19. February 2025 at 20:43 >>>>> To: Pierre Bouvet <pierre.bouvet@meduniwien.ac.at <mailto:pierre.bouvet@meduniwien.ac.at>> >>>>> Cc: <software@biobrillouin.org <mailto:software@biobrillouin.org>> >>>>> Subject: [Software] Re: [EXTERN] Re: Software manuscript / BLS microscopy >>>>> >>>>> >>>>> >>>>> >>>>> >>>>> >>>>> >>>>> >>>>> >>>>> >>>>> >>>>> >>>>> Hi Pierre, >>>>> >>>>> >>>>> >>>>> >>>>> >>>>> >>>>> >>>>> >>>>> >>>>> >>>>> >>>>> >>>>> I realized that we might have slightly different aims. >>>>> >>>>> >>>>> >>>>> >>>>> >>>>> >>>>> >>>>> >>>>> >>>>> >>>>> >>>>> >>>>> For me the most important part of this project is to have a unified file format that can be read and visualized by a standard software. The file format you are proposing is not sufficient for that in my opinion. For example one of my main motivation was to have an interface where the user can see the reconstructed image, click on a pixel, see the corresponding spectrum to check its quality and maybe try different fitting functions; that would already not be possible with your structure because the software would have no notion on where the spectral data is stored and how to associate it to a specific pixel. >>>>> >>>>> >>>>> >>>>> >>>>> >>>>> >>>>> I don't see the structure of the file to be too complex as an issue, as long as it is functional: we can always provide an API and/or a GUI that allow people to take their spectra and save them in whatever format we decide without bothering about understanding the actual structure, the same way you can work with HDF5 file without having any understanding on how the data is actually stored on the disk. >>>>> >>>>> >>>>> >>>>> >>>>> >>>>> >>>>> >>>>> >>>>> >>>>> >>>>> >>>>> >>>>> My idea of making a webapp as a GUI follows directly from there. Typical case: I sent some data to a collaborator and they can just run the app in their browser and check if the outliers they see in the image are real or a bad spectra. Similarly if we make a common database of Brillouin spectra, people can explore it easily using the webapp. >>>>> >>>>> >>>>> >>>>> >>>>> >>>>> >>>>> >>>>> From what I understood, you are instead more interested in going from raw data to an actual spectrum, which I don't see so much as a priority because each lab has their own code already and the actual procedure would be different for each lab (apart from standard instruments like the FP). I am not saying this should not be part of the software but not as a priority and rather has a layer where people can easily implement their own code (of course we could already implement code for standard instruments). >>>>> >>>>> >>>>> >>>>> >>>>> >>>>> >>>>> >>>>> >>>>> >>>>> >>>>> >>>>> >>>>> I think it would be good to cleary define what is our common aim now, so we are sure we are working in the same direction. >>>>> >>>>> >>>>> >>>>> >>>>> >>>>> >>>>> >>>>> >>>>> >>>>> >>>>> >>>>> >>>>> Let me know if you agree or I misunderstood what is your idea. >>>>> >>>>> >>>>> >>>>> >>>>> >>>>> >>>>> >>>>> >>>>> >>>>> >>>>> >>>>> >>>>> Best, >>>>> >>>>> >>>>> >>>>> >>>>> >>>>> >>>>> Carlo >>>>> >>>>> >>>>> >>>>> >>>>> >>>>> >>>>> >>>>> >>>>> On Wed, Feb 19, 2025 at 16:11, Pierre Bouvet <pierre.bouvet@meduniwien.ac.at <mailto:pierre.bouvet@meduniwien.ac.at>> wrote: >>>>> >>>>> >>>>> >>>>> >>>>> >>>>> >>>>>> Hi, >>>>>> >>>>>> >>>>>> >>>>>> >>>>>> >>>>>> >>>>>> >>>>>> >>>>>> >>>>>> >>>>>> >>>>>> >>>>>> I think you're trying to go too far too fast. The approach I present here <https://github.com/bio-brillouin/HDF5_BLS/blob/GUI_development/guides/Projec...> is intentionally simple, so that people can very quickly get to storing their data in a HDF5 file format together with the parameters they used to acquire them with minimal effort. The closest to what you did is therefore as follows: >>>>>> >>>>>> >>>>>> >>>>>> >>>>>> >>>>>> >>>>>> - data are datasets with no other restriction and they are stored in groups >>>>>> >>>>>> >>>>>> >>>>>> >>>>>> >>>>>> >>>>>> - each group can have a set of attribute proper to the data they are storing >>>>>> >>>>>> >>>>>> >>>>>> >>>>>> >>>>>> >>>>>> - attributes have a nomenclature imposed by a spreadsheet and are in the form of text >>>>>> >>>>>> >>>>>> >>>>>> >>>>>> >>>>>> >>>>>> - the default name of a data is the name of a raw data: “Raw_data”, other arrays can have whatever name they want (Shift_5GHz, Frequency, ...) >>>>>> >>>>>> >>>>>> >>>>>> >>>>>> >>>>>> >>>>>> - arrays and attributes are hierarchical, so they apply to their groups and all groups under it. >>>>>> >>>>>> >>>>>> >>>>>> >>>>>> >>>>>> >>>>>> This is the bare minimum to meet our needs, so we need to stop here in the definition of the format since it’s already enough to have the GUI working correctly, and therefore the first version of the unified software advertised. Of course we will have to refine things later on, but we don’t want to scare people off by presenting them a file description that for one might not match their measurements and that is extremely hard to conceptually understand. To make my point clearer, take your definition of the format for example: there are 3 different amplitude arrays in your description, two different shift arrays and width arrays that are of different dimension, then we have a calibration group on one side but a spectrometer characterization array in another group that is called “experiment_info”, that’s just too complicated to use correctly. On the other hand, placing your raw data “as is” in a group dedicated to this data is conceptually easy and straightforward. >>>>>> >>>>>> >>>>>> >>>>>> >>>>>> >>>>>> >>>>>> Where you are right, is that should we have hundreds of people using it, we might in a near future want to store abscissa, impulse responses, … in a standardized manner. In that case, the question falls down to either adding sub-groups or storing the data together with the measure. Both are fine and don’t really pose a problem for now, essentially because we are not trying to visualize the results but just trying to unify the way to get them. >>>>>> >>>>>> >>>>>> >>>>>> >>>>>> >>>>>> >>>>>> Now regarding Dash, if I understand correctly, it’s just a way to change the frontend you propose? If that’s so, why not, but then I don’t really see the benefits: if you really want to use dash, you can always embed it inside a Qt app. Also Dash being browser based, you will only have one window for the whole interface, which will be a pain to deal with if you want to use the interface to do everything the GUI is expected to do (inspect an H5 file, convert PSD, treat data, edit parameters, inspect a failed treatment, simulate results using setups with slight changes of parameters…). We agree that at one point when people receive an h5 file, it will be useful to have a web interface that can do what yours or Sal’s GUI do (seeing the mapping results together with the spectrum, eventually the time-domain signal) but here again, it’s going too far too soon: let’s first have a simple and reliable GUI that can convert data from any spectrometer to PSDs and treat them with a unified code. This is the real challenge, visualization and nomenclature of results are both important but secondary. Also keep in mind that, the frontend can easily be generated by anyone really, with Copilot or ChatGPT or whatever AI, but you can’t ask them to develop the function that will correctly read your data and convert them to a PSD nor treat the PSD. This is done on the backend and is the priority since the unification essentially happens there. >>>>>> >>>>>> >>>>>> >>>>>> >>>>>> >>>>>> >>>>>> >>>>>> >>>>>> >>>>>> >>>>>> >>>>>> >>>>>> Best, >>>>>> >>>>>> >>>>>> >>>>>> >>>>>> >>>>>> >>>>>> >>>>>> >>>>>> >>>>>> >>>>>> >>>>>> >>>>>> Pierre >>>>>> >>>>>> >>>>>> >>>>>> >>>>>> >>>>>> >>>>>> >>>>>> >>>>>> >>>>>> >>>>>> >>>>>> >>>>>> Pierre Bouvet, PhD >>>>>> >>>>>> >>>>>> >>>>>> >>>>>> >>>>>> >>>>>> Post-doctoral Fellow >>>>>> >>>>>> >>>>>> >>>>>> >>>>>> >>>>>> >>>>>> Medical University Vienna >>>>>> >>>>>> >>>>>> >>>>>> >>>>>> >>>>>> >>>>>> Department of Anatomy and Cell Biology >>>>>> >>>>>> >>>>>> >>>>>> >>>>>> >>>>>> >>>>>> Wahringer Straße 13, 1090 Wien, Austria >>>>>> >>>>>> >>>>>> >>>>>> >>>>>> >>>>>> >>>>>> >>>>>> >>>>>> >>>>>> >>>>>> >>>>>> >>>>>> >>>>>> >>>>>> >>>>>> >>>>>> >>>>>> >>>>>> >>>>>> >>>>>> >>>>>> >>>>>> >>>>>> >>>>>> >>>>>> >>>>>> >>>>>> >>>>>> >>>>>> >>>>>> >>>>>> >>>>>> >>>>>>> On 19/2/25, at 13:21, Carlo Bevilacqua <carlo.bevilacqua@embl.de <mailto:carlo.bevilacqua@embl.de>> wrote: >>>>>>> >>>>>>> >>>>>>> >>>>>>> >>>>>>> >>>>>>> >>>>>>> >>>>>>> >>>>>>> >>>>>>> >>>>>>> >>>>>>> >>>>>>> Hi Pierre, >>>>>>> >>>>>>> >>>>>>> >>>>>>> >>>>>>> >>>>>>> >>>>>>> thanks for your reply. >>>>>>> >>>>>>> >>>>>>> >>>>>>> >>>>>>> >>>>>>> >>>>>>> >>>>>>> >>>>>>> >>>>>>> >>>>>>> >>>>>>> >>>>>>> Regarding the file structure, what I am still not very clear about is what you define as Raw_data and data, how the actual spectra are stored and how the association to spatial coordinates and parameters is made. That's why I would really appreciate if you could make a document similar to what I did <https://github.com/prevedel-lab/Brillouin-standard-file/blob/main/docs/Bh5_f...>, where it is clear what each group should (or can) contain, what is the shape of each dataset, which attributes they have, etc... >>>>>>> >>>>>>> >>>>>>> >>>>>>> >>>>>>> >>>>>>> >>>>>>> I am not saying that this should be the final structure of the file but I strongly believe that having it written in a structured way helps defining it and seeing potential issues. >>>>>>> >>>>>>> >>>>>>> >>>>>>> >>>>>>> >>>>>>> >>>>>>> >>>>>>> >>>>>>> >>>>>>> >>>>>>> >>>>>>> >>>>>>> Regarding the webapp, it works by separating the frontend, which run in the browser and is responsible of running the GUI, and the backend which is doing the actual computation and that you can structure as you like with multithreading or any optimization you wish. The communication between frontend and backend is handled transparently by the framework, so you don't have to take care of it. >>>>>>> >>>>>>> >>>>>>> >>>>>>> >>>>>>> >>>>>>> >>>>>>> When you run Dash locally a local server is created so the data stays on your computer and there is no issue with data transfer/privacy. >>>>>>> >>>>>>> >>>>>>> >>>>>>> >>>>>>> >>>>>>> >>>>>>> If we want to move it to a server at a later stage, then you are right about the fact that data needs to be transferred to a server (although there might be solutions that allow you to still run the computation on the local browser, like WebAssembly <https://webassembly.org/>, but I think it is too complex to look into this at this stage). Regarding safety and privacy, the data will be stored on the server only for the time that the user is using the app and then deleted (of course we will need to make a disclaimer on the website about this). Regarding space I don't think people at the beginning will load their 1Tb dataset on the webapp but rather look at some small dataset of few tens of Gb; in that case 1Tb of server space is more than enough (remember that the file will be stored only for the time the user is using the app). If people really start to use the webapp and space becomes a limitation, I would be super happy to look into WebAssembly so that the data can be handled locally from the browser without transferring it to the server. >>>>>>> >>>>>>> >>>>>>> >>>>>>> >>>>>>> >>>>>>> >>>>>>> >>>>>>> >>>>>>> >>>>>>> >>>>>>> >>>>>>> >>>>>>> To summarize I would agree that, at this stage, there might be no advantage of a webapp over a local GUI (and might actually be a bit more work to develop it). But, if this project really flies, the potential of a webapp is huge, especially in the context of the BioBrillouin society where we want to have a database of spectral data and the webapp could be used to explore that without downloading anything on your computer. My main point is that moving now to a webapp would not be too much work, but if we want to do it at a later stage it will basically entail re-writing everything from scratch. >>>>>>> >>>>>>> >>>>>>> >>>>>>> >>>>>>> >>>>>>> >>>>>>> >>>>>>> >>>>>>> >>>>>>> >>>>>>> >>>>>>> >>>>>>> Let me know what are your thoughts about it. >>>>>>> >>>>>>> >>>>>>> >>>>>>> >>>>>>> >>>>>>> >>>>>>> >>>>>>> >>>>>>> >>>>>>> >>>>>>> >>>>>>> >>>>>>> Best, >>>>>>> >>>>>>> >>>>>>> >>>>>>> >>>>>>> >>>>>>> >>>>>>> Carlo >>>>>>> >>>>>>> >>>>>>> >>>>>>> >>>>>>> >>>>>>> >>>>>>> >>>>>>> >>>>>>> >>>>>>> >>>>>>> >>>>>>> >>>>>>> >>>>>>> >>>>>>> >>>>>>> On Wed, Feb 19, 2025 at 08:51, Pierre Bouvet <pierre.bouvet@meduniwien.ac.at <mailto:pierre.bouvet@meduniwien.ac.at>> wrote: >>>>>>> >>>>>>> >>>>>>> >>>>>>> >>>>>>> >>>>>>> >>>>>>>> Hi Carlo, >>>>>>>> >>>>>>>> >>>>>>>> >>>>>>>> >>>>>>>> >>>>>>>> >>>>>>>> >>>>>>>> >>>>>>>> >>>>>>>> >>>>>>>> >>>>>>>> >>>>>>>> You’re right, the format is still a little fuzzy. The main idea is to have a data-based hierarchy for storage: each data is stored in an individual group. From there, abscissa dependent on the data are stored in the same group and the treated data are stored in sub-groups. The names of the groups and sub-groups are fixed (Data_i), as is the name of the raw data (Raw_data) and abscissa (Abscissa_i). Also, the measure and spectrometer-dependent arguments have a defined nomenclature. To differentiate groups between them, we preferably attribute them a name as an attribute that is not used as an identifier, the identifier being either the path to the data/group from file root (Data_0/Data_42/Data_2/Raw_data) or potentially a hash value (not implemented). This I think allows all possible configurations, and using an hierarchical approach we can also pass common attributes and arrays (parameters of the spectrometer or abscissa arrays for example) on parent to reduce memory complexity. >>>>>>>> >>>>>>>> >>>>>>>> >>>>>>>> >>>>>>>> >>>>>>>> >>>>>>>> Now regarding the use of server-based GUI, first off, I’ve never used them so I’m just making supposition here but if the platform is able to treat data online, it will have to store the spectra somewhere in memory and it will not be local. My primary concerns with this approach is safety, particularly in terms of intellectual property protection, ethical considerations, and potential security vulnerabilities. Additionally, managing storage space will be a headache. >>>>>>>> >>>>>>>> >>>>>>>> >>>>>>>> >>>>>>>> >>>>>>>> >>>>>>>> Now, this doesn’t mean that we can’t have a server-based data plotter, or a server-based interface that does treatments locally but I don’t really see the benefits of this over a local software that can have multiple windows, which could at one point be multithreaded, and that could wrap c code to speed regressions for example (some of this might apply to Dash, I’m not super familiar with it). Now regarding memory complexity, having all the data we treat go on a server is a bad idea as it will raise the question of cost which will very rapidly become a real problem. Just an example: for a 100x100 map, I need 10Gb of memory (1Mo/point) with my setup (1To of archive storage is approximately 1euro/month) so this would get out of hands super fast assuming people use it. >>>>>>>> >>>>>>>> >>>>>>>> >>>>>>>> >>>>>>>> >>>>>>>> >>>>>>>> Now maybe there are solutions I don’t see for these problems and someone can take care of them but for me it’s just not worth the effort when having a local GUI solves all of these issues at once. But if you find a solution, then I’ll be happy to migrate to Dash, it won’t be fast to translate every feature but I can totally join you on the platform. >>>>>>>> >>>>>>>> >>>>>>>> >>>>>>>> >>>>>>>> >>>>>>>> >>>>>>>> >>>>>>>> >>>>>>>> >>>>>>>> >>>>>>>> >>>>>>>> >>>>>>>> Best, >>>>>>>> >>>>>>>> >>>>>>>> >>>>>>>> >>>>>>>> >>>>>>>> >>>>>>>> >>>>>>>> >>>>>>>> >>>>>>>> >>>>>>>> >>>>>>>> >>>>>>>> Pierre >>>>>>>> >>>>>>>> >>>>>>>> >>>>>>>> >>>>>>>> >>>>>>>> >>>>>>>> >>>>>>>> >>>>>>>> >>>>>>>> >>>>>>>> >>>>>>>> >>>>>>>> Pierre Bouvet, PhD >>>>>>>> >>>>>>>> >>>>>>>> >>>>>>>> >>>>>>>> >>>>>>>> >>>>>>>> Post-doctoral Fellow >>>>>>>> >>>>>>>> >>>>>>>> >>>>>>>> >>>>>>>> >>>>>>>> >>>>>>>> Medical University Vienna >>>>>>>> >>>>>>>> >>>>>>>> >>>>>>>> >>>>>>>> >>>>>>>> >>>>>>>> Department of Anatomy and Cell Biology >>>>>>>> >>>>>>>> >>>>>>>> >>>>>>>> >>>>>>>> >>>>>>>> >>>>>>>> Wahringer Straße 13, 1090 Wien, Austria >>>>>>>> >>>>>>>> >>>>>>>> >>>>>>>> >>>>>>>> >>>>>>>> >>>>>>>> >>>>>>>> >>>>>>>> >>>>>>>> >>>>>>>> >>>>>>>> >>>>>>>> >>>>>>>> >>>>>>>> >>>>>>>> >>>>>>>> >>>>>>>> >>>>>>>> >>>>>>>> >>>>>>>> >>>>>>>> >>>>>>>> >>>>>>>> >>>>>>>> >>>>>>>> >>>>>>>> >>>>>>>> >>>>>>>> >>>>>>>> >>>>>>>> >>>>>>>> >>>>>>>> >>>>>>>>> On 18/2/25, at 20:26, Carlo Bevilacqua <carlo.bevilacqua@embl.de <mailto:carlo.bevilacqua@embl.de>> wrote: >>>>>>>>> >>>>>>>>> >>>>>>>>> >>>>>>>>> >>>>>>>>> >>>>>>>>> >>>>>>>>> >>>>>>>>> >>>>>>>>> >>>>>>>>> >>>>>>>>> >>>>>>>>> >>>>>>>>> Hi Pierre, >>>>>>>>> >>>>>>>>> >>>>>>>>> >>>>>>>>> >>>>>>>>> >>>>>>>>> >>>>>>>>> >>>>>>>>> >>>>>>>>> >>>>>>>>> >>>>>>>>> >>>>>>>>> >>>>>>>>> regarding the structure of the file, I agree that we should keep it simple. I am not suggesting to make it more complex, rather to have a document where we define it in a clear and structured way rather than as a general description, to make sure that we are all on the same page. >>>>>>>>> >>>>>>>>> >>>>>>>>> >>>>>>>>> >>>>>>>>> >>>>>>>>> >>>>>>>>> I am saying this because, to be honest, I am not sure I fully understand how you are structuring the HDF5 and I think it is important to agree on this now, rather than finding at a later stage that we had different ideas. >>>>>>>>> >>>>>>>>> >>>>>>>>> >>>>>>>>> >>>>>>>>> >>>>>>>>> >>>>>>>>> >>>>>>>>> >>>>>>>>> >>>>>>>>> >>>>>>>>> >>>>>>>>> >>>>>>>>> Ideally if the GUI should be part of a single application, we should write it using a unified framework. >>>>>>>>> >>>>>>>>> >>>>>>>>> >>>>>>>>> >>>>>>>>> >>>>>>>>> >>>>>>>>> The reasons why, after considering it for a bit, I lean towards Dash rather than Qt are: >>>>>>>>> >>>>>>>>> >>>>>>>>> >>>>>>>>> >>>>>>>>> >>>>>>>>> >>>>>>>>> it can run in a web browser so it will be easy to eventually move it to a website, thus people can use it without installing it (which will hopefully help in promoting its use) >>>>>>>>> it is based on plotly <https://plotly.com/python/>which is a graphical library with very good plotting capabilites and highly customizable, that would make the data visualization easier/more appealing >>>>>>>>> Let me know what you think about it and if you see any advantage of Qt over a web app which I am not considering. Also, if we agree that Dash might be a better option, would you consider migrating to Dash? It might not be too much work if most of the code you wrote is for data processing rather that for the GUI itself and I could help you with that. Alternatively one workaround is to have a QtWebEngine <https://doc.qt.io/qtforpython-6/overviews/qtwebengine-overview.html> in your Qt app and have the Dash app run inside that, but that would make only the Dash part portable to a server later on. >>>>>>>>> >>>>>>>>> >>>>>>>>> >>>>>>>>> >>>>>>>>> >>>>>>>>> >>>>>>>>> >>>>>>>>> >>>>>>>>> >>>>>>>>> >>>>>>>>> >>>>>>>>> >>>>>>>>> Best, >>>>>>>>> >>>>>>>>> >>>>>>>>> >>>>>>>>> >>>>>>>>> >>>>>>>>> >>>>>>>>> Carlo >>>>>>>>> >>>>>>>>> >>>>>>>>> >>>>>>>>> >>>>>>>>> >>>>>>>>> >>>>>>>>> >>>>>>>>> >>>>>>>>> >>>>>>>>> >>>>>>>>> >>>>>>>>> >>>>>>>>> >>>>>>>>> >>>>>>>>> >>>>>>>>> On Tue, Feb 18, 2025 at 10:24, Pierre Bouvet <pierre.bouvet@meduniwien.ac.at <mailto:pierre.bouvet@meduniwien.ac.at>> wrote: >>>>>>>>> >>>>>>>>> >>>>>>>>> >>>>>>>>> >>>>>>>>> >>>>>>>>> >>>>>>>>>> Hi, >>>>>>>>>> >>>>>>>>>> >>>>>>>>>> >>>>>>>>>> >>>>>>>>>> >>>>>>>>>> >>>>>>>>>> >>>>>>>>>> >>>>>>>>>> >>>>>>>>>> >>>>>>>>>> >>>>>>>>>> >>>>>>>>>> Thanks, >>>>>>>>>> >>>>>>>>>> >>>>>>>>>> >>>>>>>>>> >>>>>>>>>> >>>>>>>>>> >>>>>>>>>> >>>>>>>>>> >>>>>>>>>> >>>>>>>>>> >>>>>>>>>> >>>>>>>>>> >>>>>>>>>> More than merge them later, just keep them separate in the process and rather than trying to build "one code to do it all", build one library and GUI that encapsulate codes to do everything. >>>>>>>>>> >>>>>>>>>> >>>>>>>>>> >>>>>>>>>> >>>>>>>>>> >>>>>>>>>> >>>>>>>>>> Having a structure is a must but it needs to be kept as simple as possible else we’ll rapidly find situations where we need to change the structure. The middle ground I think is to force the use of hierarchies and impose nomenclatures where problem are expected to appear: each dataset has its own group, each group can encapsulate other groups, each parameter of a group applies to all its sub-groups if the subgroup does not change its value, each array of a group applies to all of its sub-groups if the sub-group does not redefine an array with same name, the names of the groups are held as parameters and their ID are managed by the software. >>>>>>>>>> >>>>>>>>>> >>>>>>>>>> >>>>>>>>>> >>>>>>>>>> >>>>>>>>>> >>>>>>>>>> For the Plotly interface, I don’t know how to integrate it to Qt but if you find a way to do it, that’s perfect with me :) >>>>>>>>>> >>>>>>>>>> >>>>>>>>>> >>>>>>>>>> >>>>>>>>>> >>>>>>>>>> >>>>>>>>>> My vision of the GUI is something that unifies the format and can then execute scripts on the data stored in this format. I have pushed the application of the GUI to my data up to the point where I can do the whole information extraction process from it (add data, convert to PSD, fit curves). I think this could be super interesting if we implement it for all techniques. >>>>>>>>>> >>>>>>>>>> >>>>>>>>>> >>>>>>>>>> >>>>>>>>>> >>>>>>>>>> >>>>>>>>>> I think we could formalize the project in milestones, in particular define the minimal denominator that will allow us to have the paper. The milestone I reached for my spectro encompasses the following points: >>>>>>>>>> >>>>>>>>>> >>>>>>>>>> >>>>>>>>>> >>>>>>>>>> >>>>>>>>>> >>>>>>>>>> - Being able to add data to the file easily (by dragging & dropping to the GUI) >>>>>>>>>> >>>>>>>>>> >>>>>>>>>> >>>>>>>>>> >>>>>>>>>> >>>>>>>>>> >>>>>>>>>> - Being able to assign properties to these data easily (again by dragging & dropping) >>>>>>>>>> >>>>>>>>>> >>>>>>>>>> >>>>>>>>>> >>>>>>>>>> >>>>>>>>>> >>>>>>>>>> - Being able to structure the added data in groups/folders/containers/however we want to call it >>>>>>>>>> >>>>>>>>>> >>>>>>>>>> >>>>>>>>>> >>>>>>>>>> >>>>>>>>>> >>>>>>>>>> - Making it easy for new data types to be loaded >>>>>>>>>> >>>>>>>>>> >>>>>>>>>> >>>>>>>>>> >>>>>>>>>> >>>>>>>>>> >>>>>>>>>> - Allowing data from same type but different structure to be added (e.g. .dat files) >>>>>>>>>> >>>>>>>>>> >>>>>>>>>> >>>>>>>>>> >>>>>>>>>> >>>>>>>>>> >>>>>>>>>> - Execute scripts on the data easily and allowing parameters of these scripts to be defined from the GUI (e.g. select a peak on a curve to fit this peak) >>>>>>>>>> >>>>>>>>>> >>>>>>>>>> >>>>>>>>>> >>>>>>>>>> >>>>>>>>>> >>>>>>>>>> - Make it easy to add scripts for treating or extracting PSD from raw data. >>>>>>>>>> >>>>>>>>>> >>>>>>>>>> >>>>>>>>>> >>>>>>>>>> >>>>>>>>>> >>>>>>>>>> - Allow the export of a Python code to access the data from the file (we cans see them as “break points” in the treatment pipeline) >>>>>>>>>> >>>>>>>>>> >>>>>>>>>> >>>>>>>>>> >>>>>>>>>> >>>>>>>>>> >>>>>>>>>> - Edit of properties inside the GUI >>>>>>>>>> >>>>>>>>>> >>>>>>>>>> >>>>>>>>>> >>>>>>>>>> >>>>>>>>>> >>>>>>>>>> In any case I think we could build a spec sheet for the project with what we want to have in it based on what we want to advertise in the paper. We can always add things later on but if we agree on a strict minimum to have the project advertised, then that will set its first milestone on which we’ll be able to build later on. >>>>>>>>>> >>>>>>>>>> >>>>>>>>>> >>>>>>>>>> >>>>>>>>>> >>>>>>>>>> >>>>>>>>>> >>>>>>>>>> >>>>>>>>>> >>>>>>>>>> >>>>>>>>>> >>>>>>>>>> >>>>>>>>>> Best, >>>>>>>>>> >>>>>>>>>> >>>>>>>>>> >>>>>>>>>> >>>>>>>>>> >>>>>>>>>> >>>>>>>>>> >>>>>>>>>> >>>>>>>>>> >>>>>>>>>> >>>>>>>>>> >>>>>>>>>> >>>>>>>>>> Pierre >>>>>>>>>> >>>>>>>>>> >>>>>>>>>> >>>>>>>>>> >>>>>>>>>> >>>>>>>>>> >>>>>>>>>> >>>>>>>>>> >>>>>>>>>> >>>>>>>>>> >>>>>>>>>> >>>>>>>>>> >>>>>>>>>> >>>>>>>>>> >>>>>>>>>> >>>>>>>>>> >>>>>>>>>> >>>>>>>>>> >>>>>>>>>> Pierre Bouvet, PhD >>>>>>>>>> >>>>>>>>>> >>>>>>>>>> >>>>>>>>>> >>>>>>>>>> >>>>>>>>>> >>>>>>>>>> Post-doctoral Fellow >>>>>>>>>> >>>>>>>>>> >>>>>>>>>> >>>>>>>>>> >>>>>>>>>> >>>>>>>>>> >>>>>>>>>> Medical University Vienna >>>>>>>>>> >>>>>>>>>> >>>>>>>>>> >>>>>>>>>> >>>>>>>>>> >>>>>>>>>> >>>>>>>>>> Department of Anatomy and Cell Biology >>>>>>>>>> >>>>>>>>>> >>>>>>>>>> >>>>>>>>>> >>>>>>>>>> >>>>>>>>>> >>>>>>>>>> Wahringer Straße 13, 1090 Wien, Austria >>>>>>>>>> >>>>>>>>>> >>>>>>>>>> >>>>>>>>>> >>>>>>>>>> >>>>>>>>>> >>>>>>>>>> >>>>>>>>>> >>>>>>>>>> >>>>>>>>>> >>>>>>>>>> >>>>>>>>>> >>>>>>>>>> >>>>>>>>>> >>>>>>>>>> >>>>>>>>>> >>>>>>>>>> >>>>>>>>>> >>>>>>>>>> >>>>>>>>>> >>>>>>>>>> >>>>>>>>>> >>>>>>>>>> >>>>>>>>>> >>>>>>>>>> >>>>>>>>>> >>>>>>>>>> >>>>>>>>>> >>>>>>>>>> >>>>>>>>>> >>>>>>>>>> >>>>>>>>>> >>>>>>>>>> >>>>>>>>>>> On 17/2/25, at 14:53, Carlo Bevilacqua via Software <software@biobrillouin.org <mailto:software@biobrillouin.org>> wrote: >>>>>>>>>>> >>>>>>>>>>> >>>>>>>>>>> >>>>>>>>>>> >>>>>>>>>>> >>>>>>>>>>> >>>>>>>>>>> >>>>>>>>>>> >>>>>>>>>>> >>>>>>>>>>> >>>>>>>>>>> >>>>>>>>>>> >>>>>>>>>>> Hi Pierre, hi Sal, >>>>>>>>>>> >>>>>>>>>>> >>>>>>>>>>> >>>>>>>>>>> >>>>>>>>>>> >>>>>>>>>>> >>>>>>>>>>> thanks for sharing your thoughts about it. >>>>>>>>>>> >>>>>>>>>>> >>>>>>>>>>> >>>>>>>>>>> >>>>>>>>>>> >>>>>>>>>>> >>>>>>>>>>> @Pierre I am very sorry that Ren passed away :( >>>>>>>>>>> >>>>>>>>>>> >>>>>>>>>>> >>>>>>>>>>> >>>>>>>>>>> >>>>>>>>>>> >>>>>>>>>>> >>>>>>>>>>> >>>>>>>>>>> >>>>>>>>>>> >>>>>>>>>>> >>>>>>>>>>> >>>>>>>>>>> As far as I understood you are suggesting to work on the individual aspects separately and then merge them together at a later stage? I am fine with that but I still think it is very important to now agree on what should be in the file format we are defining, because that is kind of the core of the project and will affect a lot of the design choices. >>>>>>>>>>> >>>>>>>>>>> >>>>>>>>>>> >>>>>>>>>>> >>>>>>>>>>> >>>>>>>>>>> >>>>>>>>>>> >>>>>>>>>>> >>>>>>>>>>> >>>>>>>>>>> >>>>>>>>>>> >>>>>>>>>>> >>>>>>>>>>> I am happy to start working on the GUI for data visualization. In my idea, it will be something similar to this <https://www.nature.com/articles/s41592-023-02054-z/figures/10>but written in dash <https://dash.plotly.com/>, so it is a web app that for now can run locally (so no transfer of data to an external server is required) but in the future can easily be uploaded to a website that people can just use without installing anything on their computer. >>>>>>>>>>> >>>>>>>>>>> >>>>>>>>>>> >>>>>>>>>>> >>>>>>>>>>> >>>>>>>>>>> >>>>>>>>>>> The question is how much of the data processing should be possible to do (or trigger) from the same GUI? I think at least a drop down menu with different fitting functions should be there, so the user can quickly check the results on a spectrum from a specific point in the image. >>>>>>>>>>> >>>>>>>>>>> >>>>>>>>>>> >>>>>>>>>>> >>>>>>>>>>> >>>>>>>>>>> >>>>>>>>>>> @Pierre how are you envisioning the GUI you are working on? As far as I understood it is mainly to get the raw data and save it to our HDF5 format with some treatment on it. >>>>>>>>>>> >>>>>>>>>>> >>>>>>>>>>> >>>>>>>>>>> >>>>>>>>>>> >>>>>>>>>>> >>>>>>>>>>> One idea could be to have a shared list of features that we are implementing in the GUI as we work on it, to avoid having the same functionality duplicated (or worst inconsistent) between the GUI for generating our file format and the GUI for visualization. >>>>>>>>>>> >>>>>>>>>>> >>>>>>>>>>> >>>>>>>>>>> >>>>>>>>>>> >>>>>>>>>>> >>>>>>>>>>> >>>>>>>>>>> >>>>>>>>>>> >>>>>>>>>>> >>>>>>>>>>> >>>>>>>>>>> >>>>>>>>>>> Let me know what you think about it. >>>>>>>>>>> >>>>>>>>>>> >>>>>>>>>>> >>>>>>>>>>> >>>>>>>>>>> >>>>>>>>>>> >>>>>>>>>>> >>>>>>>>>>> >>>>>>>>>>> >>>>>>>>>>> >>>>>>>>>>> >>>>>>>>>>> >>>>>>>>>>> Best, >>>>>>>>>>> >>>>>>>>>>> >>>>>>>>>>> >>>>>>>>>>> >>>>>>>>>>> >>>>>>>>>>> >>>>>>>>>>> Carlo >>>>>>>>>>> >>>>>>>>>>> >>>>>>>>>>> >>>>>>>>>>> >>>>>>>>>>> >>>>>>>>>>> >>>>>>>>>>> >>>>>>>>>>> >>>>>>>>>>> On Mon, Feb 17, 2025 at 11:04, Pierre Bouvet via Software <software@biobrillouin.org <mailto:software@biobrillouin.org>> wrote: >>>>>>>>>>> >>>>>>>>>>> >>>>>>>>>>> >>>>>>>>>>> >>>>>>>>>>> >>>>>>>>>>> >>>>>>>>>>>> Hi everyone, >>>>>>>>>>>> >>>>>>>>>>>> >>>>>>>>>>>> >>>>>>>>>>>> >>>>>>>>>>>> >>>>>>>>>>>> >>>>>>>>>>>> >>>>>>>>>>>> >>>>>>>>>>>> >>>>>>>>>>>> >>>>>>>>>>>> >>>>>>>>>>>> >>>>>>>>>>>> Sorry for the delayed response, I just went through the loss of Ren (my dog) and wasn’t at all able to answer. >>>>>>>>>>>> >>>>>>>>>>>> >>>>>>>>>>>> >>>>>>>>>>>> >>>>>>>>>>>> >>>>>>>>>>>> >>>>>>>>>>>> First of, Sal, I am making progress and I should have everything you have made on your branch integrated to the GUI branch soon, at which point I will push everything to main. >>>>>>>>>>>> >>>>>>>>>>>> >>>>>>>>>>>> >>>>>>>>>>>> >>>>>>>>>>>> >>>>>>>>>>>> >>>>>>>>>>>> Regarding the project, I think I align with Sal: keep things as simple as possible. My approach was to divide everything in 3 mostly independent layers: >>>>>>>>>>>> >>>>>>>>>>>> >>>>>>>>>>>> >>>>>>>>>>>> >>>>>>>>>>>> >>>>>>>>>>>> >>>>>>>>>>>> - Store data in an organized file that anyone can use, and make it easy to do >>>>>>>>>>>> >>>>>>>>>>>> >>>>>>>>>>>> >>>>>>>>>>>> >>>>>>>>>>>> >>>>>>>>>>>> >>>>>>>>>>>> - Convert these data into something that has physical significance: a Power Spectrum Density >>>>>>>>>>>> >>>>>>>>>>>> >>>>>>>>>>>> >>>>>>>>>>>> >>>>>>>>>>>> >>>>>>>>>>>> >>>>>>>>>>>> - Extract information from this Power Spectrum Density >>>>>>>>>>>> >>>>>>>>>>>> >>>>>>>>>>>> >>>>>>>>>>>> >>>>>>>>>>>> >>>>>>>>>>>> >>>>>>>>>>>> Each layer has its own challenge but they are independent on the challenge of having people using it: personally, if I had someone come to me with a new software to play with my measures, I would most likely only look at it for 1 minute (or less depending who made it) with a lot of apprehension and then based on how simple it looks and how much I understood of it, use it or - what is most likely - discard it. This is why Project.pdf <https://github.com/bio-brillouin/HDF5_BLS/blob/GUI_development/guides/Projec...> is essentially meant to say: we put data arrays in groups and give them attributes written in text, but you can also create groups within groups to organize your data! >>>>>>>>>>>> >>>>>>>>>>>> >>>>>>>>>>>> >>>>>>>>>>>> >>>>>>>>>>>> >>>>>>>>>>>> >>>>>>>>>>>> I believe most of the people in the BioBrillouin society will have the same approach and before having something complex that can do a lot, I think it’s best to have something simple that can just unify the format (which in itself is a lot) and that people can use right away with a minimal impact on their own individual pipelines for data processing. >>>>>>>>>>>> >>>>>>>>>>>> >>>>>>>>>>>> >>>>>>>>>>>> >>>>>>>>>>>> >>>>>>>>>>>> >>>>>>>>>>>> To be honest, I don’t think people will blindly trust our software at first to treat their data, but they will most likely use it at first to organize their raw spectra, and maybe add their own treated data if they are feeling particularly adventurous. But that is not a problem as long as we start a movement. From there yes, we can complexity and create custom file architectures but that is already too complex I think for this first project. >>>>>>>>>>>> >>>>>>>>>>>> >>>>>>>>>>>> >>>>>>>>>>>> >>>>>>>>>>>> >>>>>>>>>>>> >>>>>>>>>>>> If we can all just import our data to the wrapper and specify their attributes, this will already be a success. Then for the paper, if we can all add a custom code to treat these data to obtain a PSD, I think this will be enough. As I said, the current API already allows you to add your data in a variety of format, so it’s just a question of developing the PSD conversion before having something we can publish (and then tell people to use). >>>>>>>>>>>> >>>>>>>>>>>> >>>>>>>>>>>> >>>>>>>>>>>> >>>>>>>>>>>> >>>>>>>>>>>> >>>>>>>>>>>> >>>>>>>>>>>> >>>>>>>>>>>> >>>>>>>>>>>> >>>>>>>>>>>> >>>>>>>>>>>> >>>>>>>>>>>> A few extra points: >>>>>>>>>>>> >>>>>>>>>>>> >>>>>>>>>>>> >>>>>>>>>>>> >>>>>>>>>>>> >>>>>>>>>>>> >>>>>>>>>>>> - Working with my setup, I realized if the user could choose between different algorithms to treat their own data, it would make the overall project much more usable (if an algorithm bugs for whatever reason, you can use another one) so I created 2 bottle necks in the form of functions (for PSD conversion and treatment) that would inspect modules dedicated to either PSD conversion or treatment, and list existing functions. It’s in between classical and modular programming but it makes the development of new PSD conversion code and treatment way way easier >>>>>>>>>>>> >>>>>>>>>>>> >>>>>>>>>>>> >>>>>>>>>>>> >>>>>>>>>>>> >>>>>>>>>>>> >>>>>>>>>>>> - The GUI is developed using oriented-object programming. Therefore I have already made some low-level choices that kind of impact all the GUI. I’m not saying they are the best choices, I’m just saying that they work, so if you want to work on the GUI, I would either recommend getting familiar with these choices, or making sure that all the functionalities are preserved, particularly the ones that are invisible (logging of treatment steps, treatment errors…) >>>>>>>>>>>> >>>>>>>>>>>> >>>>>>>>>>>> >>>>>>>>>>>> >>>>>>>>>>>> >>>>>>>>>>>> >>>>>>>>>>>> >>>>>>>>>>>> >>>>>>>>>>>> >>>>>>>>>>>> >>>>>>>>>>>> >>>>>>>>>>>> >>>>>>>>>>>> I’ll try merging the branches on Git asap and will definitely send you all an email when it’s done :) >>>>>>>>>>>> >>>>>>>>>>>> >>>>>>>>>>>> >>>>>>>>>>>> >>>>>>>>>>>> >>>>>>>>>>>> >>>>>>>>>>>> >>>>>>>>>>>> >>>>>>>>>>>> >>>>>>>>>>>> >>>>>>>>>>>> >>>>>>>>>>>> >>>>>>>>>>>> Best, >>>>>>>>>>>> >>>>>>>>>>>> >>>>>>>>>>>> >>>>>>>>>>>> >>>>>>>>>>>> >>>>>>>>>>>> >>>>>>>>>>>> >>>>>>>>>>>> >>>>>>>>>>>> >>>>>>>>>>>> >>>>>>>>>>>> >>>>>>>>>>>> >>>>>>>>>>>> Pierre >>>>>>>>>>>> >>>>>>>>>>>> >>>>>>>>>>>> >>>>>>>>>>>> >>>>>>>>>>>> >>>>>>>>>>>> >>>>>>>>>>>> >>>>>>>>>>>> >>>>>>>>>>>> >>>>>>>>>>>> >>>>>>>>>>>> >>>>>>>>>>>> >>>>>>>>>>>> Pierre Bouvet, PhD >>>>>>>>>>>> >>>>>>>>>>>> >>>>>>>>>>>> >>>>>>>>>>>> >>>>>>>>>>>> >>>>>>>>>>>> >>>>>>>>>>>> Post-doctoral Fellow >>>>>>>>>>>> >>>>>>>>>>>> >>>>>>>>>>>> >>>>>>>>>>>> >>>>>>>>>>>> >>>>>>>>>>>> >>>>>>>>>>>> Medical University Vienna >>>>>>>>>>>> >>>>>>>>>>>> >>>>>>>>>>>> >>>>>>>>>>>> >>>>>>>>>>>> >>>>>>>>>>>> >>>>>>>>>>>> Department of Anatomy and Cell Biology >>>>>>>>>>>> >>>>>>>>>>>> >>>>>>>>>>>> >>>>>>>>>>>> >>>>>>>>>>>> >>>>>>>>>>>> >>>>>>>>>>>> Wahringer Straße 13, 1090 Wien, Austria >>>>>>>>>>>> >>>>>>>>>>>> >>>>>>>>>>>> >>>>>>>>>>>> >>>>>>>>>>>> >>>>>>>>>>>> >>>>>>>>>>>> >>>>>>>>>>>> >>>>>>>>>>>> >>>>>>>>>>>> >>>>>>>>>>>> >>>>>>>>>>>> >>>>>>>>>>>> >>>>>>>>>>>> >>>>>>>>>>>> >>>>>>>>>>>> >>>>>>>>>>>> >>>>>>>>>>>> >>>>>>>>>>>> >>>>>>>>>>>> >>>>>>>>>>>> >>>>>>>>>>>> >>>>>>>>>>>> >>>>>>>>>>>> >>>>>>>>>>>> >>>>>>>>>>>> >>>>>>>>>>>> >>>>>>>>>>>> >>>>>>>>>>>> >>>>>>>>>>>> >>>>>>>>>>>> >>>>>>>>>>>> >>>>>>>>>>>> >>>>>>>>>>>>> On 14/2/25, at 19:36, Sal La Cavera Iii via Software <software@biobrillouin.org <mailto:software@biobrillouin.org>> wrote: >>>>>>>>>>>>> >>>>>>>>>>>>> >>>>>>>>>>>>> >>>>>>>>>>>>> >>>>>>>>>>>>> >>>>>>>>>>>>> >>>>>>>>>>>>> >>>>>>>>>>>>> >>>>>>>>>>>>> >>>>>>>>>>>>> >>>>>>>>>>>>> >>>>>>>>>>>>> >>>>>>>>>>>>> Hi all, >>>>>>>>>>>>> >>>>>>>>>>>>> >>>>>>>>>>>>> >>>>>>>>>>>>> >>>>>>>>>>>>> >>>>>>>>>>>>> >>>>>>>>>>>>> >>>>>>>>>>>>> >>>>>>>>>>>>> >>>>>>>>>>>>> >>>>>>>>>>>>> >>>>>>>>>>>>> >>>>>>>>>>>>> I agree with the things enumerated and points made by Kareem/Carlo! I guess I would advocate for starting from a position of simplicity. We probably don't want to get weighed down by trying to include a bunch of bells and whistles from the start as these can be easily added once there is a minimally viable stable product. >>>>>>>>>>>>> >>>>>>>>>>>>> >>>>>>>>>>>>> >>>>>>>>>>>>> >>>>>>>>>>>>> >>>>>>>>>>>>> >>>>>>>>>>>>> >>>>>>>>>>>>> >>>>>>>>>>>>> >>>>>>>>>>>>> >>>>>>>>>>>>> >>>>>>>>>>>>> >>>>>>>>>>>>> As long as data can be loaded to local memory, then treated in various (initially simple) ways through the GUI (and maybe maintain non-GUI compatibility for command-line warriors like myself), then the bh5 formatting stuff can be sorted on the back end? I definitely agree with Carlo's structure set out in the file format document; but all of that data will be floating around the memory in some shape or form and just needs to be wrapped up and packaged (according to Carlo's structure e.g.) when the user is happy and presses the "generate h5 filestore" etc. (?) >>>>>>>>>>>>> >>>>>>>>>>>>> >>>>>>>>>>>>> >>>>>>>>>>>>> >>>>>>>>>>>>> >>>>>>>>>>>>> >>>>>>>>>>>>> >>>>>>>>>>>>> >>>>>>>>>>>>> >>>>>>>>>>>>> >>>>>>>>>>>>> >>>>>>>>>>>>> >>>>>>>>>>>>> Definitely agree with the recommendation to create the alpha using mainly requirements that our 3 labs would find useful (import filetypes, treatments, etc), and then we can add on more universal functionality second / get some beta testers in from other labs etc. >>>>>>>>>>>>> >>>>>>>>>>>>> >>>>>>>>>>>>> >>>>>>>>>>>>> >>>>>>>>>>>>> >>>>>>>>>>>>> >>>>>>>>>>>>> >>>>>>>>>>>>> >>>>>>>>>>>>> >>>>>>>>>>>>> >>>>>>>>>>>>> >>>>>>>>>>>>> >>>>>>>>>>>>> I'm able to support on whatever jobs need doing and am free to meet in the beginning of March like you mentioned Kareem. >>>>>>>>>>>>> >>>>>>>>>>>>> >>>>>>>>>>>>> >>>>>>>>>>>>> >>>>>>>>>>>>> >>>>>>>>>>>>> >>>>>>>>>>>>> >>>>>>>>>>>>> >>>>>>>>>>>>> >>>>>>>>>>>>> >>>>>>>>>>>>> >>>>>>>>>>>>> >>>>>>>>>>>>> Hope you guys have a nice weekend, >>>>>>>>>>>>> >>>>>>>>>>>>> >>>>>>>>>>>>> >>>>>>>>>>>>> >>>>>>>>>>>>> >>>>>>>>>>>>> >>>>>>>>>>>>> >>>>>>>>>>>>> >>>>>>>>>>>>> >>>>>>>>>>>>> >>>>>>>>>>>>> >>>>>>>>>>>>> >>>>>>>>>>>>> Cheers, >>>>>>>>>>>>> >>>>>>>>>>>>> >>>>>>>>>>>>> >>>>>>>>>>>>> >>>>>>>>>>>>> >>>>>>>>>>>>> >>>>>>>>>>>>> >>>>>>>>>>>>> >>>>>>>>>>>>> >>>>>>>>>>>>> >>>>>>>>>>>>> >>>>>>>>>>>>> >>>>>>>>>>>>> Sal >>>>>>>>>>>>> >>>>>>>>>>>>> >>>>>>>>>>>>> >>>>>>>>>>>>> >>>>>>>>>>>>> >>>>>>>>>>>>> >>>>>>>>>>>>> >>>>>>>>>>>>> >>>>>>>>>>>>> >>>>>>>>>>>>> >>>>>>>>>>>>> >>>>>>>>>>>>> >>>>>>>>>>>>> --------------------------------------------------------------- >>>>>>>>>>>>> >>>>>>>>>>>>> >>>>>>>>>>>>> >>>>>>>>>>>>> >>>>>>>>>>>>> >>>>>>>>>>>>> >>>>>>>>>>>>> Salvatore La Cavera III >>>>>>>>>>>>> >>>>>>>>>>>>> >>>>>>>>>>>>> Royal Academy of Engineering Research Fellow >>>>>>>>>>>>> >>>>>>>>>>>>> >>>>>>>>>>>>> Nottingham Research Fellow >>>>>>>>>>>>> >>>>>>>>>>>>> >>>>>>>>>>>>> Optics and Photonics Group >>>>>>>>>>>>> >>>>>>>>>>>>> >>>>>>>>>>>>> University of Nottingham >>>>>>>>>>>>> Email: salvatore.lacaveraiii@nottingham.ac.uk <mailto:salvatore.lacaveraiii@nottingham.ac.uk> >>>>>>>>>>>>> ORCID iD: 0000-0003-0210-3102 >>>>>>>>>>>>> >>>>>>>>>>>>> >>>>>>>>>>>>> >>>>>>>>>>>>> >>>>>>>>>>>>> >>>>>>>>>>>>> >>>>>>>>>>>>> <Outlook-tygjxucs.png> <https://outlook.office.com/bookwithme/user/6a3f960a8e89429cb6fc693c01d10119@...> >>>>>>>>>>>>> >>>>>>>>>>>>> >>>>>>>>>>>>> >>>>>>>>>>>>> >>>>>>>>>>>>> >>>>>>>>>>>>> Book a Coffee and Research chat with me! >>>>>>>>>>>>> >>>>>>>>>>>>> >>>>>>>>>>>>> >>>>>>>>>>>>> >>>>>>>>>>>>> >>>>>>>>>>>>> >>>>>>>>>>>>> From: Carlo Bevilacqua via Software <software@biobrillouin.org <mailto:software@biobrillouin.org>> >>>>>>>>>>>>> Sent: 12 February 2025 13:31 >>>>>>>>>>>>> To: Kareem Elsayad <kareem.elsayad@meduniwien.ac.at <mailto:kareem.elsayad@meduniwien.ac.at>> >>>>>>>>>>>>> Cc: sebastian.hambura@embl.de <mailto:sebastian.hambura@embl.de> <sebastian.hambura@embl.de <mailto:sebastian.hambura@embl.de>>; software@biobrillouin.org <mailto:software@biobrillouin.org> <software@biobrillouin.org <mailto:software@biobrillouin.org>> >>>>>>>>>>>>> Subject: [Software] Re: Software manuscript / BLS microscopy >>>>>>>>>>>>> >>>>>>>>>>>>> >>>>>>>>>>>>> >>>>>>>>>>>>> >>>>>>>>>>>>> >>>>>>>>>>>>> >>>>>>>>>>>>> >>>>>>>>>>>>> >>>>>>>>>>>>> >>>>>>>>>>>>> >>>>>>>>>>>>> >>>>>>>>>>>>> >>>>>>>>>>>>> >>>>>>>>>>>>> You don't often get email from software@biobrillouin.org <mailto:software@biobrillouin.org>. Learn why this is important <https://aka.ms/LearnAboutSenderIdentification> >>>>>>>>>>>>> >>>>>>>>>>>>> >>>>>>>>>>>>> >>>>>>>>>>>>> >>>>>>>>>>>>> >>>>>>>>>>>>> Hi Kareem, >>>>>>>>>>>>> >>>>>>>>>>>>> >>>>>>>>>>>>> >>>>>>>>>>>>> >>>>>>>>>>>>> >>>>>>>>>>>>> >>>>>>>>>>>>> thanks for restarting this and sorry for my silence, I just came back from US and was planning to start working on this again. >>>>>>>>>>>>> >>>>>>>>>>>>> >>>>>>>>>>>>> >>>>>>>>>>>>> >>>>>>>>>>>>> >>>>>>>>>>>>> >>>>>>>>>>>>> Could you also add Sebastian (in CC) to the mailing list? >>>>>>>>>>>>> >>>>>>>>>>>>> >>>>>>>>>>>>> >>>>>>>>>>>>> >>>>>>>>>>>>> >>>>>>>>>>>>> >>>>>>>>>>>>> >>>>>>>>>>>>> >>>>>>>>>>>>> >>>>>>>>>>>>> >>>>>>>>>>>>> >>>>>>>>>>>>> >>>>>>>>>>>>> As you outlined, I would split the project into two parts: 1) getting from the raw data to some standard "processed' spectra and 2) do data analysis/visualization on that. For the second part the way I envision it is: >>>>>>>>>>>>> >>>>>>>>>>>>> >>>>>>>>>>>>> >>>>>>>>>>>>> >>>>>>>>>>>>> >>>>>>>>>>>>> >>>>>>>>>>>>> the most updated definition of the file format from Pierre is this one <https://github.com/bio-brillouin/HDF5_BLS/blob/GUI_development/guides/Projec...>, correct? In addition to this document I think it would be good to have a more structured description of the file (like this <https://github.com/prevedel-lab/Brillouin-standard-file/blob/main/docs/Bh5_f...>), where each field is clearly defined in terms of data type and dimensions. Sebastian was also suggesting that the document should contain the reasoning behind each specific choice in the specs and also things that we considered but decided had some issues (so in future we can look back at it). I still believe that the file format should contain the "processed" spectra (i.e. after FT and baseline subtraction for impulsive, or after taking a line profile and possibly linearization with VIPA,...) so we can apply standard data processing or visualization which is independent on the actual underlaying technique (e.g. VIPA, FP, stimulated, time domain, ...) >>>>>>>>>>>>> agree on an API to read the data from our file format (most likely a Python class). For that we should: 1) decide on which information is important to extract (spectral information, spatial coordinates, hyper-parameters, metadata,...) 2) implement an interface to read the data (e.g. readSpectrumAtIndex(...), readImage(...), ...) >>>>>>>>>>>>> build a GUI that use the previously defined API to show and process the data. >>>>>>>>>>>>> I would say that, once we have a very solid description of the file format as in step 1, step 2 will come naturally and we can divide the actual implementation between us. Step 3 can also easily be implemented and divided between us once we have an API (and I am happy to work on the GUI myself). >>>>>>>>>>>>> >>>>>>>>>>>>> >>>>>>>>>>>>> >>>>>>>>>>>>> >>>>>>>>>>>>> >>>>>>>>>>>>> >>>>>>>>>>>>> >>>>>>>>>>>>> >>>>>>>>>>>>> >>>>>>>>>>>>> >>>>>>>>>>>>> >>>>>>>>>>>>> >>>>>>>>>>>>> The first half of the project is the trickiest and I know Pierre has already done a lot of work in that direction. We should definitely agree on which extent we can define a standard to store the raw data, given the variability between labs, (and probably we should do it for common techniques like FP or VIPA) and how to implement the treatments, leaving to possibility to load some custom code in the pipeline to do the conversion. >>>>>>>>>>>>> >>>>>>>>>>>>> >>>>>>>>>>>>> >>>>>>>>>>>>> >>>>>>>>>>>>> >>>>>>>>>>>>> >>>>>>>>>>>>> >>>>>>>>>>>>> >>>>>>>>>>>>> >>>>>>>>>>>>> >>>>>>>>>>>>> >>>>>>>>>>>>> >>>>>>>>>>>>> Let me know what you all think about this. >>>>>>>>>>>>> >>>>>>>>>>>>> >>>>>>>>>>>>> >>>>>>>>>>>>> >>>>>>>>>>>>> >>>>>>>>>>>>> >>>>>>>>>>>>> If you agree I would start by making a document which clearly defines the file format in a structured way (as in my step 1 before). @Pierre could you write a new document or modify the document I originally made <https://github.com/prevedel-lab/Brillouin-standard-file/blob/main/docs/Bh5_f...> to reflect the latest structure you implemented for the file format? The metadata can still be defined in a separated excel sheet, as long as the data type and format is well defined there. >>>>>>>>>>>>> >>>>>>>>>>>>> >>>>>>>>>>>>> >>>>>>>>>>>>> >>>>>>>>>>>>> >>>>>>>>>>>>> >>>>>>>>>>>>> >>>>>>>>>>>>> >>>>>>>>>>>>> >>>>>>>>>>>>> >>>>>>>>>>>>> >>>>>>>>>>>>> >>>>>>>>>>>>> Best regards, >>>>>>>>>>>>> >>>>>>>>>>>>> >>>>>>>>>>>>> >>>>>>>>>>>>> >>>>>>>>>>>>> >>>>>>>>>>>>> >>>>>>>>>>>>> Carlo >>>>>>>>>>>>> >>>>>>>>>>>>> >>>>>>>>>>>>> >>>>>>>>>>>>> >>>>>>>>>>>>> >>>>>>>>>>>>> >>>>>>>>>>>>> >>>>>>>>>>>>> >>>>>>>>>>>>> On Wed, Feb 12, 2025 at 02:19, Kareem Elsayad via Software <software@biobrillouin.org <mailto:software@biobrillouin.org>> wrote: >>>>>>>>>>>>> >>>>>>>>>>>>> >>>>>>>>>>>>> >>>>>>>>>>>>> >>>>>>>>>>>>> >>>>>>>>>>>>> >>>>>>>>>>>>>> Hi Robert, Carlo, Sal, Pierre, >>>>>>>>>>>>>> >>>>>>>>>>>>>> >>>>>>>>>>>>>> >>>>>>>>>>>>>> >>>>>>>>>>>>>> >>>>>>>>>>>>>> Think it would be good to follow up on software project. Pierre has made some progress here and would be good to try and define tasks a little bit clearer to make progress… >>>>>>>>>>>>>> >>>>>>>>>>>>>> >>>>>>>>>>>>>> >>>>>>>>>>>>>> >>>>>>>>>>>>>> >>>>>>>>>>>>>> There is always the potential issue of having “too many cooks in the kitchen” (that have different recipes for same thing) to move forward efficiently, something that I noticed can get quite confusing/frustrating when writing software together with people. So would be good to clearly assign tasks. I talked to Pierre today and he would be happy to integrate things in framework we have to try tie things together. What would foremost be needed would be ways of treating data, meaning code that takes a raw spectral image and meta-data and converts it into “standard” format (spectral representation) that can then be fitted. Then also “plugins” that serve a specific purpose in the analysis/rendering that can be included in framework. >>>>>>>>>>>>>> >>>>>>>>>>>>>> >>>>>>>>>>>>>> >>>>>>>>>>>>>> >>>>>>>>>>>>>> >>>>>>>>>>>>>> The way I see it (and please comment if you see differently), there are ~4 steps here: >>>>>>>>>>>>>> >>>>>>>>>>>>>> >>>>>>>>>>>>>> >>>>>>>>>>>>>> >>>>>>>>>>>>>> >>>>>>>>>>>>>> >>>>>>>>>>>>>> >>>>>>>>>>>>>> >>>>>>>>>>>>>> >>>>>>>>>>>>>> >>>>>>>>>>>>>> Take raw data (in .tif,, .dat, txt, etc. format) and meta data (in .cvs, xlsx, .dat, .txt, etc.) and render a standard spectral presentation. Also take provided instrument response in one of these formats and extract key parameters from this >>>>>>>>>>>>>> Fit the data with drop-down menu list of functions, that will include different functional dependences and functions corrected for instrument response. >>>>>>>>>>>>>> Generate/display a visual representation of results (frequency shift(s) and linewidth(s)), that is ideally interactive to some extent (and maybe has some funky features like looking at spectra at different points. These can be spatial maps and/or evolution with some other parameter (time, temperature, angle, etc.). Also be able to display maps of relative peak intensities in case of multiple peak fits, and whatever else useful you can think of. >>>>>>>>>>>>>> Extract “mechanical” parameters given assigned refractive indices and densities >>>>>>>>>>>>>> >>>>>>>>>>>>>> >>>>>>>>>>>>>> >>>>>>>>>>>>>> I think the idea of fitting modified functions (e.g. corrected based on instrument response) vs. deconvolving spectra makes more sense (as can account for more complex corrections due to non-optical anomalies in future –ultimately even functional variations in vicinity of e.g. phase transitions). It is also less error prone, as systematically doing decon with non-ideal registration data can really throw you off the cliff, so to speak. >>>>>>>>>>>>>> >>>>>>>>>>>>>> >>>>>>>>>>>>>> >>>>>>>>>>>>>> >>>>>>>>>>>>>> >>>>>>>>>>>>>> My understanding is that we kind of agreed on initial meta-data reporting format. Getting from 1 to 2 will no doubt be most challenging as it is very instrument specific. So instructions will need to be written for different BLS implementations. >>>>>>>>>>>>>> >>>>>>>>>>>>>> >>>>>>>>>>>>>> >>>>>>>>>>>>>> >>>>>>>>>>>>>> >>>>>>>>>>>>>> This is a huge project if we want it to be all inclusive.. so I would suggest to focus on making it work for just a couple of modalities first would be good (e.g. crossed VIPA, time-resolved, anisotropy, and maybe some time or temperature course of one of these). Extensions should then be more easy to navigate. At one point think would be good to involve SBS specific considerations also. >>>>>>>>>>>>>> >>>>>>>>>>>>>> >>>>>>>>>>>>>> >>>>>>>>>>>>>> >>>>>>>>>>>>>> >>>>>>>>>>>>>> Think would be good to discuss a while per email to gather thoughts and opinions (and already start to share codes), and then plan a meeting beginning of March -- how does first week of March look for everyone? >>>>>>>>>>>>>> >>>>>>>>>>>>>> >>>>>>>>>>>>>> >>>>>>>>>>>>>> >>>>>>>>>>>>>> >>>>>>>>>>>>>> I created this mailing list (software@biobrillouin.org <mailto:software@biobrillouin.org>) we can use for discussion. You should all be able to post to (and it makes it easier if we bring anyone else in along the way). >>>>>>>>>>>>>> >>>>>>>>>>>>>> >>>>>>>>>>>>>> At moment on this mailing list is Robert, Carlo, Sal, Pierre and myself. Let me know if I should add anyone. >>>>>>>>>>>>>> >>>>>>>>>>>>>> >>>>>>>>>>>>>> >>>>>>>>>>>>>> >>>>>>>>>>>>>> >>>>>>>>>>>>>> All the best, >>>>>>>>>>>>>> >>>>>>>>>>>>>> >>>>>>>>>>>>>> Kareem >>>>>>>>>>>>>> >>>>>>>>>>>>>> >>>>>>>>>>>>>> >>>>>>>>>>>>>> >>>>>>>>>>>>>> >>>>>>>>>>>>>> >>>>>>>>>>>>>> >>>>>>>>>>>>>> >>>>>>>>>>>>>> >>>>>>>>>>>>>> >>>>>>>>>>>>>> >>>>>>>>>>>>>> >>>>>>>>>>>>>> >>>>>>>>>>>>> >>>>>>>>>>>>> This message and any attachment are intended solely for the addressee and may contain confidential information. If you have received this message in error, please contact the sender and delete the email and attachment. Any views or opinions expressed by the author of this email do not necessarily reflect the views of the University of Nottingham. Email communications with the University of Nottingham may be monitored where permitted by law. _______________________________________________ >>>>>>>>>>>>> Software mailing list -- software@biobrillouin.org <mailto:software@biobrillouin.org> >>>>>>>>>>>>> To unsubscribe send an email to software-leave@biobrillouin.org <mailto:software-leave@biobrillouin.org> >>>>>>>>>>>>> >>>>>>>>>>>>> >>>>>>>>>>>>> >>>>>>>>>>>>> >>>>>>>>>>>>> >>>>>>>>>>>> >>>>>>>>>>>> >>>>>>>>>>>> >>>>>>>>>>>> >>>>>>>>>>>> >>>>>>>>>>>> >>>>>>>>>>>> >>>>>>>>>>> >>>>>>>>>>> _______________________________________________ >>>>>>>>>>> Software mailing list -- software@biobrillouin.org <mailto:software@biobrillouin.org> >>>>>>>>>>> To unsubscribe send an email to software-leave@biobrillouin.org <mailto:software-leave@biobrillouin.org> >>>>>>>>>>> >>>>>>>>>>> >>>>>>>>>>> >>>>>>>>>>> >>>>>>>>>>> >>>>>>>>>> >>>>>>>>>> >>>>>>>>>> >>>>>>>>>> >>>>>>>>>> >>>>>>>>>> >>>>>>>>>> >>>>>>>> >>>>>>>> >>>>>>>> >>>>>>>> >>>>>>>> >>>>>>>> >>>>>>>> >>>>>> >>>>>> >>>>>> >>>>>> >>>>>> >>>>>> >>>>>> >>>>> >>>>> _______________________________________________ Software mailing list -- software@biobrillouin.org <mailto:software@biobrillouin.org> To unsubscribe send an email to software-leave@biobrillouin.org <mailto:software-leave@biobrillouin.org> >>>>> >>>>> >>>>> >>>>> >>>>> >>>>> >>>> >>>> _______________________________________________ >>>> Software mailing list -- software@biobrillouin.org <mailto:software@biobrillouin.org> >>>> To unsubscribe send an email to software-leave@biobrillouin.org <mailto:software-leave@biobrillouin.org> >>>> >>>> >>>> >>> >>> >>> >>> >>> >>> _______________________________________________ >>> Software mailing list -- software@biobrillouin.org <mailto:software@biobrillouin.org> >>> To unsubscribe send an email to software-leave@biobrillouin.org <mailto:software-leave@biobrillouin.org> >>> >>> >>> >> >> >> >> >>
_______________________________________________ Software mailing list -- software@biobrillouin.org <mailto:software@biobrillouin.org> To unsubscribe send an email to software-leave@biobrillouin.org <mailto:software-leave@biobrillouin.org>
_______________________________________________ Software mailing list -- software@biobrillouin.org <mailto:software@biobrillouin.org> To unsubscribe send an email to software-leave@biobrillouin.org <mailto:software-leave@biobrillouin.org>
_______________________________________________ Software mailing list -- software@biobrillouin.org To unsubscribe send an email to software-leave@biobrillouin.org
_______________________________________________ Software mailing list -- software@biobrillouin.org To unsubscribe send an email to software-leave@biobrillouin.org
Hi Kareem, thanks for great summary. I largely agree with the way you described what I have in mind, I would only add two points: * In the case of discrete parameters they can be stored as "fake" timepoints, as you mentioned. I think this is fair, because anyways they will be in practice acquired at different times (one need to change the sample, temperature, etc...). In that case the only difference between my and Pierre's approach is that Pierre would store them in a hierarchical structure and I would do it in a flatten structure (which I believe is always possible because the hierarchy in Pierre's case is not given by some parent/children relationship, but each leaf of the tree is uniquely defined by a set of parameters) * in the case of angularly resolved measurements, my structure actually allow these type of measurements to be stored in a single file, (even in a single dataset - see the description of ' /data{n}/PSD (https://github.com/bio-brillouin/HDF5_BLS/blob/main/Bh5_file_spec.md)' ); I think this is a good way to store spectra acquired simultaneously, where you have many spectra acquired always in the same condition (clear example is the angularly-resolved VIPA) and one can add an arbitrary number of such "parameters" by adding more dimensions Now, going to the reasons why I don't think Pierre's approach would work for what I am trying to do: * he gives complete flexibility to the dimensions of each dataset, which has the advantage of storing arbitrary data but the drawback of not knowing what each dimension corresponds to (so how to treat/visualize them with a standard software?); also, I want to highlight that in the format I am proposing people could add as many dataset/group to the file as they want: this will give them complete flexibility on what to store in the file without breaking the compatibility with the standard (the software will just ignore the data that is not part of the standard); I don't see the reason of forcing people to add data non required by the standard in a structured way, if anyway a software could not make any use of that, not knowing what that data means * there is no clear definition on how a spatial mapping is stored, so it is hard to do the visualization I mentioned in my previous email where I can show the image of the sample My counter-proposal (mostly aligning with what you proposed) is that, since it is difficult to agree on the link between the two projects and, as you pointed out, they are mostly independent, I would propose that for now we work to two completely separated projects. Currently Robert is away for more than one week, but once he will back we can discuss if strategically it makes sense to try to merge them later or keep them separated. Let me know if you agree with this. Best, Carlo On Wed, Mar 5, 2025 at 10:31, Kareem Elsayad via Software wrote: Dear All, Having read through the emails finally, here is what I gather. Keeping in mind that I may be misunderstanding things (correct me), this is how I would suggest we proceed. (Now it’s my go to write a long email 😊) Carlo’s vision appears to be to have (conceptually) the equivalent of a .tiff file used in e.g. fluorescence confocal microscopy that represents one particular measurement. this could be data (in the form of PSD for each voxel) pertaining to a spatial 2D or 3D scan/image. It may also be a time course 2D or 3D set of images (as is also possible in .tiff). The file also contains metadata (objective, laser wavelength/power, etc. used – basically the stuff in our consensus reporting xls). In addition it also (optionally) contains the Instrument Response Function (IRF). Potentially the latter is saved in the form of a control spectra of a known (indicated) material, but I would say more ideally it is stored as an IRF as this is more universal (between techniques), requires no additional info (measured sample), and is easier and faster to work with on analysis/fitting side (saves additional extraction of IRF which will be technique dependent). Now this is all well and good and I am fine with this. The downside is that it is limited to wanting to look at images /volume-images and (optionally) how they evolve over time. If you want to see how something changes with temperature or any other variable, or e.g. between two mutants, you would just save each as a separate file. This is usually what biologists are used to. Sure it might not be the most memory efficient (you would have to write all the metadata in each) but I don’t see that as an issue since this doesn’t take up too much memory (and we’ve become a lot better at working with large files than we were say 10 years ago). The downside comes when you want to look at say how the BLS spectra at a single position or a collection of voxels changes as you tune some parameter. Maybe for static maps you could “fake it” and save as a time series, which software recognizes? However, if you have 50 different BLS spectra for each voxel in a 3D space in a time series measurement (from e.g. 50 different angles) you have an extra degrees of freedom …would one need 50 files, one for each angle bin?. So it’s not necessarily different experiments, but just in this case one additional degree of freedom. Given dispersion only needs to be in one direction and we have two degrees of freedom on our camera, one can envision this extra degree of freedom being used for various other things (I.e not only spatial or angular multiplexing). Then there is maybe some physical-chemist-biologist who wants to say measure the change in linewidth as he/she induces a phase transition by tuning one thing or another at a single point (or few points). He/she is probably fine fitting each spectra with their own code as they scan e.g. the temperature across the transition. The question is do we also want to cater for him/her or are we just purely for BLS imaging? Pierre’s vision appears to be to have maximum flexibility in this regard, with a structure that is general enough to optimally accommodate for saving data for an entire multi-variable experiment. Namely if you do an angle-resolved map of a cell over time and repeat the experiments at different temperatures, and then say also for different mutants, you can store all that data in a single file. I think this is a very noble and cool idea, except that in practice you will (biology being biology) need to do this on >10 cells (in each case) to get anything statistically significant. You can in principle put that too into the same file, but now we are talking about firstly increased complexity (which I guess can theoretically be overcome since to most people this is a black box anyhow) but ultimately doing/reporting science in a way biologists – or indeed most scientists - are not used to (so it would be trend-setting in that sense – having an entire study in a single file, with statistics and so forth done not separately and differently between labs). This is certainly not a conceptually a crazy idea, and probably even the future of science (but maybe something best exploring firstly in a larger consortium with standard fluorescence, EM etc. techniques if it hasn’t already – which it probably has). It also makes things more amiable to be analyzed and compared (between different studies) by e.g. AI in a multi-variate/dimensional way (maybe should propose to Zuckerberg?). I digress. I think here it is worth keeping things not just as simple but also as basic as possible. With Nat Meth (assuming they consider interesting enough) the focus is biologists in their current state of mind, and with their current habits, and that is kind of what we need to cater for when trying to sell an exotic technique to the masses. So, following my rambling, here is how I think we should proceed, as we need to move forward and not dwell on this longer. As mentioned in previous emails, this is basically two separate projects (of equal importance) that just need to agree on their meeting point in the middle. It is ideal that the goals are already more or less defined between getting raw data to a “standard” format (Vienna/Nottingham side), and “fitting/presenting” data (Heidelberg side). Not reaching a general consensus on the h5 format I would suggest that Carlo/Sebastian work with their file format and Pierre/Sal with theirs and we figure how to patch together after (see below). It maybe would be good to clarify some of the lingo first to avoid misunderstandings. (Maybe the below has been defined, in which case ignore and see it as a reflection of my naivety)… Firstly, “treatment”. Is this “just” the step from getting from the raw acquired spectra to an agreed upon, universally applicable, presentation of the PDS for each voxel (excl. any decon., since we fit IRF modified Lorentzians/DHOs) which can be fed into the same fitting procedure(s)? This would I guess only include one peak (e.g. anti-Stokes) since in time domain that’s all you’ll get out anyhow. Does it refer to the entire construction of the h5 file? Does it include the fitting and extraction of the frequency shifts and linewidths? the calculation of viscoelastic moduli (if one provides auxiliary parameters like refractive index and density)? Secondly, and related, in dividing tasks it is also not clear to me if the “standard” h5 file contains also the fitted values for frequency shift/linewidth or just the raw data. From the division of work load my understanding is that the fitting will be done in Carlo/Sebastian’s code (?). Will the fitted values then also be included in the h5 file or not? (i.e. additionally written into it after it was generated from Pierre’s codes). There is no point of everybody doing their own fitting code, which would kinda miss the point of having some universality/standard? I guess to me it is unclear where the division of labor is. To keep things simple I would suggest that Pierre’s code simply generates the standard h5 file (unfitted, but in a standard PSD presentation for each voxel, and includes optional IRF), and then Carlo/Sebastian’s codes do the fitting and resaves the fitting parameters into some empty/assigned space in that same h5 file. If the h5 file already contains fitted paramaters (from previously running Carlo/Sebastian’s code) then these can directly be displayed (or one can chose to fit again and overwrite). How does this sound to everyone? This does not address the contention of the file format. The solution proposed in our last Zoom meeting was creating a code that converts one (Pierre’s) file format to the other (Carlo’s). This is I think in light of the recent emails I think the only reasonable solution, and probably maybe even a great solution, considering that Pierre’s file format may contain multiple additional information (entire experiments) and the conversion between the two can allow one to e.g. pick out specific ones if and as relevant. It doesn’t have to be elaborate at this point, but it can have the potential to be for multi-variate data down the line. So this divide is actually a plus as it keeps door open for more complex data sets, without them being a neccesity. Would it maybe be possible for Pierre and Carlo to write this conversion program together as a first step? Just needs to be rudimentary so that individual parties can start working on their sides independently asap? This code can then in the end be tacked on to one or the other codes developed by the two parties, depending on what we decide to be the standard reporting format. It is also not crazy to consider in the end two file formats that can be accepted, one maybe called “measurement”-file format, and one “experiment”-file format, that the user selects between when importing? As such if this conversion code is in Pierre’s code one may have the option to export as one of these two formats. If it is also in Carlo’s code, one has option to read either format. This way one has option of saving as and reading out from both a single image/series of images (as is normally done in bioimaging) as well as an entire experiment as one pleases and everybody is happy 😊 How does this sound? I hope the above is a suitable way to move forward, but ofcourse let me know your thoughts and happy with alternatives… Regarding the bi-weekly meetings suggested by Robert. I still think this makes sense… Ofcourse not everybody needs to attend all if busy, but having this time slot earmarked in calender for when it becomes necessary might be nice. I will send out an email with dates/invite info… All the best, and hope this moves forward from here!!:) Kareem From: Pierre Bouvet via Software Reply to: Pierre Bouvet Date: Tuesday, 4. March 2025 at 11:20 To: Carlo Bevilacqua Cc: "software@biobrillouin.org (mailto:software@biobrillouin.org)" Subject: [Software] Re: [EXTERN] Re: Software manuscript / BLS microscopy Hi everyone, The spec sheet I defined for the format is there (https://github.com/bio-brillouin/HDF5_BLS/blob/main/guides/SpecSheet/SpecShe...) (I thought I had pushed it already but it seems not). To make it simple, my aim is to have a simple way (emphasis on simple) to store any kind of data obtained with as many different setups as possible, follow a unified pipeline (https://github.com/bio-brillouin/HDF5_BLS/blob/main/guides/Pipeline/Pipeline...) and allow a unified treatment of the data. From this spec sheet I built this structure (https://github.com/bio-brillouin/HDF5_BLS/blob/main/guides/Project/Project.p...) which I’ve been using for a few months now and that seems robust enough, in fact what blocked me for adapting it to time-domain was not the structure but the code I already had written to implement it. Once again, visualizing data is not the priority for me, because I believe the main problem in the community today is that we don’t have a single, robust and well-characterized way of extracting information from a PSD. Best, Pierre Pierre Bouvet, PhD Post-doctoral Fellow Medical University Vienna Department of Anatomy and Cell Biology Wahringer Straße 13, 1090 Wien, Austria On 3/3/25, at 21:32, Carlo Bevilacqua via Software wrote: Hi all, we are still trying to find an agreement with Pierre but I think that, a part from the technicalities that we can probably figure out between ourselves, we have a different view on the aims of the file format and the project in general. Although I agree that for now we could work with separate files and convert between them, eventually we need to agree on a format to propose as a standard and I want to avoid postponing the decision (at least for the general structure, of course minor details can change during the process). Otherwise I am afraid that, once most of the code is written, it will be hard to unify it and this will make the decision even more difficult. What I see as the main points of this project are: * to have some sort of TIFF for Brillouin data, with the main aim of storing images (i.e. spatial maps of a sample) together with the spectral data that it is used to generate them and the relevant metadata and calibration data * while allowing the possibility of storing single spectra or spectra acquired in different conditions in multiple samples (i.e. having a whole study in a single file), I don't see this as a determinant in defining the file. That is because the same result can be achieved by having multiple file with a clear naming convention (e.g. ConcentrationX_TemperatureY_SampleN), which is commonly done in microscopy and I feel it is a "cleaner" solution than having everything in a single file * the analysis part of the software should be able to perform standard Brillouin analysis (i.e. fit the spectra with different functions that the user can select) but possibly more advanced stuff (like PCA or non-negative matrix factorisation) * the visualization part would be similar to this (https://www.nature.com/articles/s41592-023-02054-z/figures/10), where the user can click on a pixel and see the corresponding spectrum (possibly selecting different fit functions and see the result on the fly). If multiple images are stored in the file, some dropdown menus would appear to select the relevant parameters, which identify a single image. I discussed about these points with Robert and Sebastian and we agree on them. The structure of the file I proposed (and refined with input from Pierre and Sebastian) is designed with these aims in mind. @Pierre, can you please list your aims? I don't want write what I understood from you because I might misrapresent them. It would be good to have your feedback on what you consider to be the main aims and priorities, so we can have the last iteration on the format, as we'd like to proceed with the actual coding. Best regards, Carlo On Fri, Feb 28, 2025 at 19:01, Pierre Bouvet via Software wrote: Hi everyone :) As I told you during the meeting, I just pushed everything on Git and merged with main. You can normally clone the project and test it on your machines by running the HDF5_BLS_GUI/main.py script from base repository. If it doesn’t work, it might be an os compatibility issue on the paths, but I’m hopeful I won’t have to patch that ^^ You can quickly test it with the test data provided in tests/test_data, this will however only allow you to do the most basic things (import data and edit parameters). A first version of the parameter spreadsheet (the child of the Consensus paper) is located in “spreadsheets”. You can open this file and edit it and then export it as csv. The exported csv can be dragged and dropped into the right frame of the GUI to update all the parameters of the group or dataset that you have selected in the left frame. Naturally, this GUI is built on the hierarchical structure I propose for the HDF5 file (described in guides/Project/Project.pdf), note however that it can be adjusted to a linear approach (cf discussion of today) so see this more as a first “usability” test of a - relatively - stable version, and a way for you to make a list of everything that is wrong with the software. @ Sal: I’ll soon have the code to convert your data to PSD & frequency arrays, but I’m confident you can already use the format to store your spectra as time arrays (with abscissa) from your .dat and .con files (and .. Note that because I don’t have order of magnitudes for the parameters you use, I could only test the GUI and its usability. In case you are looking for the code for importing your data, it’s in HDF5_BLS/load_formats/load_dat.py in the “load_dat_TimeDomain” function Last thing: I located the developer guide I couldn’t find during the meeting and placed it back where I thought it was (guides/DeveloperGuide/ModuleDeveloperGuide.pdf). I’m underlining this document because this is maybe the most important one of the whole project since it’s where people that want to collaborate after it’s made public will go to. The goal of this document is to take people by the hand and help them making their additions compatible with the whole project. For now this document only talks about adding data. Best, Pierre Pierre Bouvet, PhD Post-doctoral Fellow Medical University Vienna Department of Anatomy and Cell Biology Wahringer Straße 13, 1090 Wien, Austria On 28/2/25, at 14:18, Carlo Bevilacqua via Software wrote: Hi all, I made a file describing the file format, you can find it here (https://github.com/bio-brillouin/HDF5_BLS/blob/main/Bh5_file_spec.md). I think that attributes are easy to add and names of groups/datasets can be changed (if they are unclear now), so these are details that we don't need to discuss now. What I find most important to agree on now is the general structure. In that sense that are still some points under discussion between me and Pierre, but hopefully we can iron them out during the meeting. Talk to you in a bit, Carlo On Wed, Feb 26, 2025 at 23:56, Kareem Elsayad wrote: Hi Carlo, Sounds great! Yes, Fri 28th @3pm still works for me. If it works for others, here is Zoom we can use: https://us02web.zoom.us/j/5191046969?pwd=alpzaldoZEd3N2ZEQ0hYZU1RR1dOdz09 (https://us02web.zoom.us/j/5191046969?pwd=alpzaldoZEd3N2ZEQ0hYZU1RR1dOdz09) Meeting ID: 519 104 6969 Passcode: jY3zH8 All the best, kareem From: Carlo Bevilacqua via Software Reply to: Carlo Bevilacqua Date: Wednesday, 26. February 2025 at 20:43 To: Kareem Elsayad Cc: "software@biobrillouin.org (mailto:software@biobrillouin.org)" Subject: [Software] Re: [EXTERN] Re: Software manuscript / BLS microscopy Hi Kareem, thank you for your email. We are discussing with Pierre about the details of the file format and hopefully by our next meeting we will have agreed on a file format and we can divide the tasks. If it is still an option, Friday 28th at 3pm works for me. Best regards, Carlo On Mon, Feb 24, 2025 at 03:17, Kareem Elsayad wrote: Dear All, I (and Robert) were hoping there would be some consensus on this h5 file format. Let us do a Zoom on Fri 28th Feb at 15:00? A couple of points pertaining to arguments… Firstly, the precise structure is not worth getting into big arguments or fuss about…as long as it contains all the information needed for the analysis/representation, and all parties can work with (able to write and read knowing what is what), it ultimately doesn’t matter. In my opinion better put more (optional) stuff in if that is issue, and make it as inclusive as possible. In the end this does not need to be read by analysis/representation side, and when we go through we can decide if and what needs to be stripped. It is after all the “black box” between doing the experiment and having your final plots/images. Take a look at say a Zeiss file and try figure all that’s in it (it is not ideally structured maybe, but no biologist ever cared) – that said, I am sure their team had very similar arguments concerning structure etc.! (you have as many opinions as people). Maybe the issue is that the boundary conditions were not as well defined, but I would say at this point make them more inclusive than they need to be (empty spaces cost little memory) Secondly, and following on from firstly. We need to simply agree and compromise to make any progress asap. Rather than building separate structures we need to add/modify a single existing structure or we might as well be working on independent projects. Carlo’s initially proposed structure seemed reasonable, maybe with some minor changes, and we should just go with that as a basis in my opinion. I would suggest that Pierre and Carlo have a Zoom together and try and come up with something that is acceptable to both. Like everything in life, this will involve making compromises. And then present it on 28th Feb. Quite simply, if there is no agreement we cannot do this project and in the end it doesn’t matter who is right or wrong. Finally, I hope the disagreements from both sides are not seen as negative or personal attacks –it is ok to disagree (that’s why we have so many meetings!) On the plus side we are still more effective than the Austrian government (that is still deciding who should be next prime minister like half a year after elections) 😊 All the best, Kareem From: Pierre Bouvet via Software Reply to: Pierre Bouvet Date: Friday, 21. February 2025 at 11:55 To: Carlo Bevilacqua Cc: Subject: [Software] Re: [EXTERN] Re: Software manuscript / BLS microscopy Hi Carlo, Thanks for your reply, here is the next pong of this ping pong series ^^ 1- I was talking indeed about the enums, but also the parameters that are defined as integers or floating point numbers and uint32. I think its easier (and that we already agreed on) having a spreadsheet with the parameters (easy to use, easy to update, easy to store and modify between two experiments using the same setup, allows to impose fixed choices for some parameters with drop-down lists, allows to detail the requirements for the attribute like its format or units and allows examples) and to just import it in the HDF5 file. >From there it’s easier to have every attribute as strings both for the import and for the concept of what an attribute is. 2- OK 3- The problem is not necessarily the number of experiments you put in the file but the number of hyper parameters you want to take into account. Let’s take an example with a doubtable sense: I want to study the effect of low-frequency temperature fluctuations on micro mechanics in active samples both eukaryote and prokaryote showing a layered structure (endothelial cells arranged in epidermis, biofilms, …) with different cell types, and as a function of aging. I would then create a file with a first range of groups for the age of the sample, then inside these groups 2 groups for eukaryote and prokaryote samples, then inside these groups N groups for the samples I’m looking at, then inside these groups M groups for the temperature fluctuations I impose, then inside these groups the individual measures I make (this is fictional, I’m scared just to think at the amount of work to have all the samples, let alone measure them), this is simply not possible with your approach I think, and even simpler experiments like to measure the Allan variance on an instrument using 2 samples is not possible with your structure I think. 4- / 5- I think the real question is what we expect to get from a wrapper: for me is to wrap the measures of a given study, to then share, link to papers, treat using new approaches… Having a structure that can wrap both a full study and an experiment is in my opinion better in the long run than forcing the format to be used with only one experiment. 6- Yes, I understand it is an identifier, but why an integer? Why not a tuple? Why not a hash? And what if there’s a bug and instead of 3 you store you store 3.0, or 2, or ‘e'? Do you imagine the amount of work to understand where this bug comes from? Assuming it’s a bug because it might very well be just an inexperienced user making a mistake and then your file is broken. The idea is good but the safer way to have this is to work with nD arrays where the dimensionality is conserved I think, or just have all the information in the same group. 7- Here again, it’s more useful for your application but many people don’t use maps, so why force them to have even an empty array for that? Plus if they need to have a dedicated array for the concentration of crosslinkers (for example), they are faced with a non-trivial solution, which means they won’t use the format. 8- Yes, we could add an additional layer, but then it means that if you don’t need it, your datasets are in plain in the group and if you need it, then you don’t have the same structure. The solution I think is to already have the treated data in a group, if you don’t need more than one group (which will be most of the time the case) then you’ll only have one group of treated data. 9- I think it’s not useful. The SNR on the other hand is useful, because in shot-noise regime it’s a marker of variance, and this is one of the ways to spot outliers from treatment (if the SNR doesn’t match the returned standard deviation on the shift of one peak, there’s a problem somewhere). 10- The std of a fit is obtained by taking the square root of the diagonalized covariant matrix returned by the fit as long as your parameters are independent (it’s super interesting actually and a little bit more complicated but it’s true enough for lorentzian, DHO, Gaussian...) 11- OK but then why not have the calibration curves placed with your measures if they are only applicable to this measure? Once again, I think having indexes that are modifiable by the user is not safe (the technical term is “idiot proof”) 12- I don’t agree, if you are capturing points at a fixed interval, then you can reconstruct the timestamp from the timestamp of the first acquisition and either the delay between two acquisitions or the timestamp of the last acquisition. Most of the time however we don’t even need this as we consider the sample to be time-invariant on the scale of our measure, so a single timestamp for all the measure is enough and is better stored as an attribute. In the special case where we are not time-invariant, then time becomes the abscissa of the measures and in that case yes, it can be a dataset, but then it’s better to not impose a fixed name for this dataset and rather let the user decide what hyper parameter is changed during he’s measure, this way the user is free to use whatever hyper parameters he feels like it. 13- OK 14- Still not clear to me. My approach is to consider an experiment to be a measure of a sample as function of one or more controlled or measured hyper parameter. So my general approach for storing experiments is have 3 files: abscissa (with the hyper parameters that vary), measure and metadata, which translates to “Raw_data”, “Abscissa_i” and attributes for this format. 15- OK, I think more than brainstorming about how to treat correctly a VIPA spectrum, we need to allow people to tell how they do it if we want this project to be used in short term, unification is a goal of this project and we will advertise it in the paper, but to be honest, I doubt people like Giuliano will run with it without second guessing it, particularly with its clinical setups, so there will be some going back and forth before we have something stable, and this means we need to allow for this back and forth to appear somewhere, I propose having it as a parameter. 16- Here I think you allow too much liberty, changing the frequency of an array to GHz is trivial and I think most people do use GHz as the unit of their frequency arrays anyway. We need to make it clear that the frequency axis is in GHz but I think we don’t need a full element for this. If you really want to specify the unit of the Frequency dataset, I would suggest putting it in its attributes in any case, and not as another element in the structure. 17- OK 18- I think it’s one way to do it but it is not intuitive: I won’t have the reflex to go check in the attributes if there is a parameter “sam_as” to see if the calibration applies to all the curves. The way I would expect it to be is using the hierarchical logic of the format: if I’m looking at a dataset in a sub-group of a group containing a calibration dataset, then I know this calibration applies to my data: Data |- Data_0 (group) | |- Calibration (dataset) | |- Data_0 (group) | | |- Raw_data (dataset) | |- Data_1 (group) | | |- Raw_data (dataset) |- Data_1 (group) | |- Calibration (dataset) | |- Data_0 (group) | | |- Raw_data (dataset) I think in this example most people would suppose Data/Data_0/Calibration applies both to Data/Data_0/Data_0/Raw_data and Data/Data_0/Data_1/Raw_data but not Data/Data_1/Data_0/Raw_data whose calibration is intuitively Data/Data_1/Calibration Once again, my approach of the structure is trying to make it intuitive and most of all, simple. For instance if I place myself in the position of someone that is willing to try “just to see how it works”, I would give myself 10s to understand how I could have a file for only one measure that complies with the new (hope to be) standard. It is my opinion as I already told you before, that your approach is too complete and therefore complex, which will inevitably lead to people not using the format unless there’s a GUI to do it for them (and even then they might not use it). I don’t want to impose my vision here, and like you I have put a lot of thinking (and testing) into building the format I propose, but I’m convinced that if we go with your structure, not only will it make it hard for anyone to understand how to use it but we’ll have problems using it ourselves. I want to repeat that I don’t have the solution, I’m just confident that my approach is much easier to conceptually understand and less restrictive than yours. In any case we can agree to disagree on that, but then it’ll be good to have an alternative backend like the one I did with your format to try and use it, and see if indeed it’s better, because if it’s not and people don’t use it, I don’t want to go back to all the trouble I had building the library, docs and GUI just to try. I don’t want to impose you anything but it would be awesome if you took the time to read the document I made and completed for you yesterday. Then you can just tell me where you think I’m missing something and you had a better solution because as you might see, I’m having problems with nearly all your structure and we can’t really use it as a starting point at this stage since most of the backend is written and the front-end is already functional for my setup (and soon Sal’s and the TFP). Best, Pierre Pierre Bouvet, PhD Post-doctoral Fellow Medical University Vienna Department of Anatomy and Cell Biology Wahringer Straße 13, 1090 Wien, Austria On 20/2/25, at 22:55, Carlo Bevilacqua wrote: Hi Pierre, thank you for your feedback. I appreciate that you took the time to go through my definition and highlighting the critical points. I much prefer this rather than starting working with a file format where problem might arise in the future. If we understand what are the reasons behind our choices in the definition we can merge the best of the two approaches, rather than defining two "standards" for the same thing with each of them having their limitations. I will provide an answer to each of the points you raised (I gave numbers to the points in your email below, so it is easier to reference): * I am not sure to which attribute you are referring specifically, but I am completely fine with text; I defined enums where I felt it makes sense to do so because there is a discrete number of options (one could always add elements at the end of an enum) * I defined the attributes before we started working together and I am very much open to changing them so they reflect what you have in the spreadsheet; in the document defining the file format we can just state that the attributes and their type are defined in the excel sheet * I did it this way because in my idea an individual HDF5 file corresponds to a single experiment. If you feel there is an advantage in keeping different experiments in the same file I am open to introduce your structure of subgroups; I honestly feel like this will only make the file unnecessarly large and different experiments would mostly not share much (apart from the metadata, which is anyway a small overhead in terms of filesize). Now of course the question is what you define as an 'experiment': for me different timepoints or measurements at different temperatures/angles/etc on the same sample are a single experiment and I defined the file so that it is possible to save them in a single file; measurements on different samples are not the same experiment in my original idea * same as the point 3 * same as before, I would put different samples in different files but happy to introduce your structure if you feel there is an advantage * the index is used to uniquely identify an entry in the 'Analysed_data' table; it is important in the contest of reconstructing the image (see the definition of the 'tn/image' group) * in my opinion spatial coordinates have a privileged role since we are doing imaging and having them well defined it is important to reconstruct the image; for different abscissas I defined the 'parameters' dataset (more in point 14). If one is not doing imaging this dataset can be set to an empty array or a single element (we can include this in the definition) * in my idea the "Analyzed_data" group doesn't contain multiple treatments but the result of the fit on the 'final' spectra, which are unique; if you are referring to the 'n' in the 'Shift_n_GHz' that is included in case a multipeak fit is performed. Now, if we want to include the possibility of multiple treatments like you are doing (which I didn't originally consider) we could just add an additional layer to the hierarchy * that is the amplitude of the peak from the fit. I am not sure if you didn't understand what I meant or you think it is not an useful information * The fit error actually contains 2 quantities: R2 and RMSE (as defined in the type). I am not sure how you would calculate a std from a single spectrum * the calibration curves are stored in the 'calibration_spectra' group with the name of the dataset matching the respective 'Calibration_index'. In our VIPA setup we are acquiring multiple calibration curves during a single acquisition to compensate for laser drift, that's why I introduced the possibility of having multiple calibration curves. Note that the 'Calibration_index' is defined as optional exactly because it might not be needed * each spectrum can have its own timestamp if it is acquired from a different camera image or scan of a FP, etc that's why it needs to be a dataset. Note that it is an optional dataset * good point, we can rename it to PSD * that is exactly to account for the general case of the abscissa not being a spatial coordinate and it contains the values for the parameters (e.g. the angles in an angle resolved measurement). It is a dataset whose dimensions are defined in the description (happy to elaborate more if it is not clear) * float is the type of each element; it is a dataset whose dimensions are defined in the description; the way to define the frequency axis in general for setups which don't have an absolute frequency (like VIPAs) is tricky and would be good to brainstorm about possibile solutions * as for the name we can change it, but the problem on how to deal with the situation when one doesn't have the frequency in GHz remains. My idea here was to leave the possibility of different units because the fit and most of the data analysis can be performed even if the x-axis is not in GHz and the actual conversion of the shift to GHz can be done at the end and requires the calibration data. As in my previous point, I am happy to brainstorm different solutions to this problem * it is indeed redundant with 'Analyzed_data' and I pushed a change on GitHub to correct this * see point 11; also note that the group is optional (in case people don't need it) and I introduced the attribute "same_as" to avoid repeating it multiple times if it is always the same for all the 'tn' As you see we agree with some of the points or we could find a common solution, for others it was mainly a misunderstanding on what were my intentions (probably my bad in expressing them, but you could have asked if it was not clear). Hope this helps claryfing my reasoning in the file definition and I am happy to discuss all the open points. I will look in details at your newest definition that you shared in the next days. Best, Carlo On Thu, Feb 20, 2025 at 18:25, Pierre Bouvet via Software wrote: Hi, My goal with this project is to unify the treatment of BLS spectra, to then allow us to address fundamental biophysical questions with BLS as a community in the mid-long term. Therefore my principal concern for this format is simplicity: measure are datasets called “Raw_data”, if they need one or more abscissa to be understood, this/these abscissa are called “Abscissa_i” and they are placed in groups called “Data_i” where we can store their attributes in the group’s attributes. From there, I can put groups in groups to store an experiment with different ... (e.g. : samples, time points, positions, techniques, wavelengths, patients, …). This structure is trivial but lacks usability so I added an attribute called “Name” to all groups that the user can define as he wants without impacting the structure. Now here are a few critics on Carlo’s approach. I didn’t want to share them because I hate criticizing anyone’s work, and I do think that what Carlo presented is great, but I don’t want you to think that I just trashed what he did, to the contrary, it’s because I see limitations in his approach that I tried developing another, simpler one. So here are the points I have problems with in Carlo’s approach: * The preferred type of the information on an experiment should be text as we’ll likely see new devices (like your super nice FT approach) appear in the next months/years that will require new parameters to be defined to describe them. I think we should really try not to use anything else than strings in the attributes. * The experiment information should not be defined by the HDF5 file structure but rather by a spreadsheet because everyone knows how to use Excel, and it’s way easier to edit an Excel file than an HDF5 file. * Experiment information should apply to measures and not to files, because they might vary from experiment to experiment, I think their preferred allocation is thus the attributes of the groups storing individual measures (in my approach) * The characterization of the instrument might also be experiment-dependent (if for some reason you change the tilt of a VIPA during the experiment for example), therefore having a dedicated group for it might not work for some experiments * The groups are named “tn” and the structure does not present the nomenclature of sub-groups, this is a big problem if we want to store in the same format say different samples measured at different times (the logic patch would be to have sub-groups follow the same structure so tn/tm/tl/… but it should be mentioned in the definition of the structure) * The dataset “index” in Analyzed_data is difficult to understand, what is it used for? I think it’s not useful, I would delete it. * The "spatial position" in Analyzed_data supposes that we are doing mappings. This is too restrictive for no reason, it’s better to generalize the abscissa and allow the user to specify a non-limiting parameter (the “Name” attribute for example) with whatever value he wants (position, temperature, concentration of whatever, …). A concrete example of a limit here: angle measurements, I want my data to be dependent on the angle, not the position. * Having different datasets in the same “Analyzed_data” group corresponding to the result of different treatments raises the question of where the process followed to treat the data is stored. A better approach would be to create n groups “Analyzed_data_n” with only one dataset of treated values, allowing for the process to be stored in the attributes of the group Analyzed_data_n * I don’t understand why store an array of amplitude in “Analyzed_data”, is it for the SNR? Then maybe we could name this array “SNR”? * The array “Fit_error_n” is super important but ill defined. I’d rather choose a statistical quantity like the variance, standard deviation (what I think is best), least-square error… and have it apply to both the Shift and Linewidth array as so: “Shift_std” and “Linewidth_std" * I don’t understand “Calibration_index”: where are the calibration curves? Are they in “experiment_info”? If so, we expect people to already process their calibration curves to create an array before adding them to the hdf5 file? I’m not very familiar with all devices, so I might not see the limitations here but do we ever have more than one calibration curve per measure? Could we not add it to the group as a “Calibration” dataset? Or just have one group with the calibration curve? * Timestamp is typically an attribute, it shouldn’t be present inside the group as an element. * In tn/Spectra_n , “Amplitude” is the PSD so I would call it PSD because there are other “Amplitude” datasets so it’s confusing. If it’s not the PSD, I would call it “Raw_data”. * I don’t understand what “Parameters” is meant to do in tn/Spectra_n, plus it’s not a dataset so I would put it in attributes or most likely not use it as I don’t understand what it does. * Frequency is a dataset, not a float (I think). We also need to have a place where to store the process to obtain it. In VIPA spectrometers for instance this is likely a big (the main even I think) source of error. I would put this process in attributes (as a text). * I don’t think “Unit” is useful, if we have a frequency axis, then we should define it directly in GHz, and if it’s a pixel axis, then for one we should not call it “Frequency” and then it’s better not to put anything since by default we will consider the abscissa (in absence of Frequency) as a simple range of the size of the “Amplitude” dataset. * /tn/Images: it’s a good idea, but I believe this is redundant with “Analyzed_data” (?) If it’s not then I don’t understand how we get the datasets inside it. * “Calibration_spectra” is a separate group, wouldn’t it be better to have it in “Experiment_info” in the presented structure? Also might scare off people that might not want to store a calibration file every time they create a HDF5 file (I might or might not be one of them) Like I said before, I don’t want this to be taken as more than what lead me to defining a new approach to the format. I want to state once again that Carlo's structure is complete, only it’s useful for specific instruments and applications, and difficultly applicable to other techniques and scenarios (and more lazy people like myself). Following Carlo’s mail, I’ve also completed the PDF I made to describe the structure I use in the HDF5_BLS library, I’m joining it to this email and pushing its code to GitHub (https://github.com/bio-brillouin/HDF5_BLS/blob/GUI_development/guides/Projec...), feel free to edit it and criticize it at length (I feel like I deserve it after this email I really tried not to write). Best, Pierre Pierre Bouvet, PhD Post-doctoral Fellow Medical University Vienna Department of Anatomy and Cell Biology Wahringer Straße 13, 1090 Wien, Austria On 20/2/25, at 16:12, Robert Prevedel via Software wrote: Dear all, great to see all this discussion in this thread, and thanks to especially Pierre and Carlo for driving this forward. I’ve been following the various emails and arguments closely but simply didn’t have any time to chip in due to some important committments in the past days. I understand that there was a bit of a disagreement about what the focus of this effort should be, so maybe it just helps to highlight my lab's view on this (which I just discussed in depth with Carlo and Sebastian): Our original motivation was to come up with and define a common file-format, as we regard this to be key to unify the processing and visualization of Brillouin data by the community. In this respect, we would be happy to focus our efforts on defining this format and taking care of implementing the necessary processing/visualization software and interface that allows anyone to look at the data in the same way. We also regard this to be crucial if we want to standardize the reporting of Brillouin data from diverse setups/users/applications. Therefore, at this stage it would be extremely important to agree on the structure of the file format. Carlo has proposed a very well thought-through structure for this, and it would be great to get your concrete feedback on this, as I understand this hasn’t really happened yet. To aid in this, e.g. Pierre and/or Sal could try to convert or save your standard data into this structure, and report on any difficulties or ambiguities that he encounters. Based on this I agree it’s best to meet and discuss and iron this out as a next step, however it either has to be next week (ideally Fri?), or after March 12 as I am travelling back-to-back in the meantime. Of course feel free to also meet without me for more technical discussions if this speeds up things. Either way we could then also discuss the file format etc. for the ‘raw’ data that Pierre proposed (and which is indeed very valuable as well). Let me know your thoughts, and let’s keep up the great momentum and excitement on this work! Best, Robert -- Dr. Robert Prevedel Group Leader Cell Biology and Biophysics Unit European Molecular Biology Laboratory Meyerhofstr. 1 69117 Heidelberg, Germany Phone: +49 6221 387-8722 Email: robert.prevedel@embl.de (mailto:robert.prevedel@embl.de) http://www.prevedel.embl.de (http://www.prevedel.embl.de/) On 20.02.2025, at 10:29, Carlo Bevilacqua via Software wrote: Hi Kareem, thanks for the suggestion, I agree that it is a good (and easy) way to divide the tasks! Just to be clear, it is not that I don't see the need/advantage of providing some standard treatment going from raw data to standard spectra, it is just that was not my priority when proposing the idea of a unified file format. Regarding the file format, splitting the one containing the raw data and the treatments from the one containing the spectra and the image in a standard format might be a good solution and we can always merge them at a later stage. As for the file containing the "standard" spectra, it would be very helpful if you can give some feedback on the structure I originally proposed (https://github.com/prevedel-lab/Brillouin-standard-file/blob/main/docs/Bh5_f...). Keep in mind that the idea is to be able to associate spectrum/spectra to each pixel in the image, in a way that is independent of the scanning strategy and underlaying technique. I tried to find a solution that works for the techniques I am aware of, considering the peculiarities (e.g. for most VIPA setups there is no absolute frequency axis but only relative to water). If am happy to discuss why I made some specific choices and if you see a better way to achieve the same or see things differently. Both the 3rd and the 4th of March work for me. Best, Carlo On Thu, Feb 20, 2025 at 02:50, Kareem Elsayad via Software wrote: Dear All, (and I guess especially Carlo & Pierre 😊) I understand both your (main) points concerning what this all should be, and I think this is actually perfect for dividing tasks. The format of the hf or bh5 file being where things meet and what needs to be agreed on. The thing with raw data is ofcourse that it is variable between instruments and labs, and the conversion to “standard spectra” that can then be fitted etc. is going to be unique (maybe even between experiments in same project). That said, asking people to create some complex file from their data that works with a developed software is also unlikely to get a following. So (the way I see it) there are basically two parts. Getting from raw data to h5 (or bh5) format which contains the spectra in standard format. And then the whole analysis part and visualization (GUI, pretty features, etc.). While the latter may get the spotlight, it obviously relies heavily on the former being done right. Given that there are numerous “standard” BLS setup implementations the development of software for getting from raw data to h5 I think makes sense, since the h5 will no doubt be cryptic, and creating a working h5 is not something everyone will want to program by themselves (it is not an insignificant step given we are also trying to ultimately cater to biologists). As such a software that generates the h5 files, with drag and drop features and entering system parameters, for different setups makes sense and will save many labs a headache if they don’t have a good programmer on hand. So I would suggest that Pierre & Sal lead the work on developing this, while Carlo & Sebastian lead the work on developing the analysis/interface-presentation part. This way things are nicely divided and we just need to agree on the h5 file that is transferred between the two. From the side of Pierre & Sal there could maybe also be a second h5 generated that contains all the raw data and details on how it was converted to the transferred h5 file (for complete transparency this could then also be reported in papers if people wish). These could exist as two separate programs with respective GUIs but also eventually combined to a single one. How does this sound to everyone? To clear up details and try assign tasks going forward how about a Zoom first week of March (I would be free Monday 3rd and Tue 4th after 1pm)? All the best, Kareem From: Carlo Bevilacqua via Software Reply to: Carlo Bevilacqua Date: Wednesday, 19. February 2025 at 20:43 To: Pierre Bouvet Cc: Subject: [Software] Re: [EXTERN] Re: Software manuscript / BLS microscopy Hi Pierre, I realized that we might have slightly different aims. For me the most important part of this project is to have a unified file format that can be read and visualized by a standard software. The file format you are proposing is not sufficient for that in my opinion. For example one of my main motivation was to have an interface where the user can see the reconstructed image, click on a pixel, see the corresponding spectrum to check its quality and maybe try different fitting functions; that would already not be possible with your structure because the software would have no notion on where the spectral data is stored and how to associate it to a specific pixel. I don't see the structure of the file to be too complex as an issue, as long as it is functional: we can always provide an API and/or a GUI that allow people to take their spectra and save them in whatever format we decide without bothering about understanding the actual structure, the same way you can work with HDF5 file without having any understanding on how the data is actually stored on the disk. My idea of making a webapp as a GUI follows directly from there. Typical case: I sent some data to a collaborator and they can just run the app in their browser and check if the outliers they see in the image are real or a bad spectra. Similarly if we make a common database of Brillouin spectra, people can explore it easily using the webapp. From what I understood, you are instead more interested in going from raw data to an actual spectrum, which I don't see so much as a priority because each lab has their own code already and the actual procedure would be different for each lab (apart from standard instruments like the FP). I am not saying this should not be part of the software but not as a priority and rather has a layer where people can easily implement their own code (of course we could already implement code for standard instruments). I think it would be good to cleary define what is our common aim now, so we are sure we are working in the same direction. Let me know if you agree or I misunderstood what is your idea. Best, Carlo On Wed, Feb 19, 2025 at 16:11, Pierre Bouvet wrote: Hi, I think you're trying to go too far too fast. The approach I present here (https://github.com/bio-brillouin/HDF5_BLS/blob/GUI_development/guides/Projec...) is intentionally simple, so that people can very quickly get to storing their data in a HDF5 file format together with the parameters they used to acquire them with minimal effort. The closest to what you did is therefore as follows: - data are datasets with no other restriction and they are stored in groups - each group can have a set of attribute proper to the data they are storing - attributes have a nomenclature imposed by a spreadsheet and are in the form of text - the default name of a data is the name of a raw data: “Raw_data”, other arrays can have whatever name they want (Shift_5GHz, Frequency, ...) - arrays and attributes are hierarchical, so they apply to their groups and all groups under it. This is the bare minimum to meet our needs, so we need to stop here in the definition of the format since it’s already enough to have the GUI working correctly, and therefore the first version of the unified software advertised. Of course we will have to refine things later on, but we don’t want to scare people off by presenting them a file description that for one might not match their measurements and that is extremely hard to conceptually understand. To make my point clearer, take your definition of the format for example: there are 3 different amplitude arrays in your description, two different shift arrays and width arrays that are of different dimension, then we have a calibration group on one side but a spectrometer characterization array in another group that is called “experiment_info”, that’s just too complicated to use correctly. On the other hand, placing your raw data “as is” in a group dedicated to this data is conceptually easy and straightforward. Where you are right, is that should we have hundreds of people using it, we might in a near future want to store abscissa, impulse responses, … in a standardized manner. In that case, the question falls down to either adding sub-groups or storing the data together with the measure. Both are fine and don’t really pose a problem for now, essentially because we are not trying to visualize the results but just trying to unify the way to get them. Now regarding Dash, if I understand correctly, it’s just a way to change the frontend you propose? If that’s so, why not, but then I don’t really see the benefits: if you really want to use dash, you can always embed it inside a Qt app. Also Dash being browser based, you will only have one window for the whole interface, which will be a pain to deal with if you want to use the interface to do everything the GUI is expected to do (inspect an H5 file, convert PSD, treat data, edit parameters, inspect a failed treatment, simulate results using setups with slight changes of parameters…). We agree that at one point when people receive an h5 file, it will be useful to have a web interface that can do what yours or Sal’s GUI do (seeing the mapping results together with the spectrum, eventually the time-domain signal) but here again, it’s going too far too soon: let’s first have a simple and reliable GUI that can convert data from any spectrometer to PSDs and treat them with a unified code. This is the real challenge, visualization and nomenclature of results are both important but secondary. Also keep in mind that, the frontend can easily be generated by anyone really, with Copilot or ChatGPT or whatever AI, but you can’t ask them to develop the function that will correctly read your data and convert them to a PSD nor treat the PSD. This is done on the backend and is the priority since the unification essentially happens there. Best, Pierre Pierre Bouvet, PhD Post-doctoral Fellow Medical University Vienna Department of Anatomy and Cell Biology Wahringer Straße 13, 1090 Wien, Austria On 19/2/25, at 13:21, Carlo Bevilacqua wrote: Hi Pierre, thanks for your reply. Regarding the file structure, what I am still not very clear about is what you define as Raw_data and data, how the actual spectra are stored and how the association to spatial coordinates and parameters is made. That's why I would really appreciate if you could make a document similar to what I did (https://github.com/prevedel-lab/Brillouin-standard-file/blob/main/docs/Bh5_f...), where it is clear what each group should (or can) contain, what is the shape of each dataset, which attributes they have, etc... I am not saying that this should be the final structure of the file but I strongly believe that having it written in a structured way helps defining it and seeing potential issues. Regarding the webapp, it works by separating the frontend, which run in the browser and is responsible of running the GUI, and the backend which is doing the actual computation and that you can structure as you like with multithreading or any optimization you wish. The communication between frontend and backend is handled transparently by the framework, so you don't have to take care of it. When you run Dash locally a local server is created so the data stays on your computer and there is no issue with data transfer/privacy. If we want to move it to a server at a later stage, then you are right about the fact that data needs to be transferred to a server (although there might be solutions that allow you to still run the computation on the local browser, like WebAssembly (https://webassembly.org/), but I think it is too complex to look into this at this stage). Regarding safety and privacy, the data will be stored on the server only for the time that the user is using the app and then deleted (of course we will need to make a disclaimer on the website about this). Regarding space I don't think people at the beginning will load their 1Tb dataset on the webapp but rather look at some small dataset of few tens of Gb; in that case 1Tb of server space is more than enough (remember that the file will be stored only for the time the user is using the app). If people really start to use the webapp and space becomes a limitation, I would be super happy to look into WebAssembly so that the data can be handled locally from the browser without transferring it to the server. To summarize I would agree that, at this stage, there might be no advantage of a webapp over a local GUI (and might actually be a bit more work to develop it). But, if this project really flies, the potential of a webapp is huge, especially in the context of the BioBrillouin society where we want to have a database of spectral data and the webapp could be used to explore that without downloading anything on your computer. My main point is that moving now to a webapp would not be too much work, but if we want to do it at a later stage it will basically entail re-writing everything from scratch. Let me know what are your thoughts about it. Best, Carlo On Wed, Feb 19, 2025 at 08:51, Pierre Bouvet wrote: Hi Carlo, You’re right, the format is still a little fuzzy. The main idea is to have a data-based hierarchy for storage: each data is stored in an individual group. From there, abscissa dependent on the data are stored in the same group and the treated data are stored in sub-groups. The names of the groups and sub-groups are fixed (Data_i), as is the name of the raw data (Raw_data) and abscissa (Abscissa_i). Also, the measure and spectrometer-dependent arguments have a defined nomenclature. To differentiate groups between them, we preferably attribute them a name as an attribute that is not used as an identifier, the identifier being either the path to the data/group from file root (Data_0/Data_42/Data_2/Raw_data) or potentially a hash value (not implemented). This I think allows all possible configurations, and using an hierarchical approach we can also pass common attributes and arrays (parameters of the spectrometer or abscissa arrays for example) on parent to reduce memory complexity. Now regarding the use of server-based GUI, first off, I’ve never used them so I’m just making supposition here but if the platform is able to treat data online, it will have to store the spectra somewhere in memory and it will not be local. My primary concerns with this approach is safety, particularly in terms of intellectual property protection, ethical considerations, and potential security vulnerabilities. Additionally, managing storage space will be a headache. Now, this doesn’t mean that we can’t have a server-based data plotter, or a server-based interface that does treatments locally but I don’t really see the benefits of this over a local software that can have multiple windows, which could at one point be multithreaded, and that could wrap c code to speed regressions for example (some of this might apply to Dash, I’m not super familiar with it). Now regarding memory complexity, having all the data we treat go on a server is a bad idea as it will raise the question of cost which will very rapidly become a real problem. Just an example: for a 100x100 map, I need 10Gb of memory (1Mo/point) with my setup (1To of archive storage is approximately 1euro/month) so this would get out of hands super fast assuming people use it. Now maybe there are solutions I don’t see for these problems and someone can take care of them but for me it’s just not worth the effort when having a local GUI solves all of these issues at once. But if you find a solution, then I’ll be happy to migrate to Dash, it won’t be fast to translate every feature but I can totally join you on the platform. Best, Pierre Pierre Bouvet, PhD Post-doctoral Fellow Medical University Vienna Department of Anatomy and Cell Biology Wahringer Straße 13, 1090 Wien, Austria On 18/2/25, at 20:26, Carlo Bevilacqua wrote: Hi Pierre, regarding the structure of the file, I agree that we should keep it simple. I am not suggesting to make it more complex, rather to have a document where we define it in a clear and structured way rather than as a general description, to make sure that we are all on the same page. I am saying this because, to be honest, I am not sure I fully understand how you are structuring the HDF5 and I think it is important to agree on this now, rather than finding at a later stage that we had different ideas. Ideally if the GUI should be part of a single application, we should write it using a unified framework. The reasons why, after considering it for a bit, I lean towards Dash rather than Qt are: * it can run in a web browser so it will be easy to eventually move it to a website, thus people can use it without installing it (which will hopefully help in promoting its use) * it is based on plotly (https://plotly.com/python/) which is a graphical library with very good plotting capabilites and highly customizable, that would make the data visualization easier/more appealing Let me know what you think about it and if you see any advantage of Qt over a web app which I am not considering. Also, if we agree that Dash might be a better option, would you consider migrating to Dash? It might not be too much work if most of the code you wrote is for data processing rather that for the GUI itself and I could help you with that. Alternatively one workaround is to have a QtWebEngine (https://doc.qt.io/qtforpython-6/overviews/qtwebengine-overview.html) in your Qt app and have the Dash app run inside that, but that would make only the Dash part portable to a server later on. Best, Carlo On Tue, Feb 18, 2025 at 10:24, Pierre Bouvet wrote: Hi, Thanks, More than merge them later, just keep them separate in the process and rather than trying to build "one code to do it all", build one library and GUI that encapsulate codes to do everything. Having a structure is a must but it needs to be kept as simple as possible else we’ll rapidly find situations where we need to change the structure. The middle ground I think is to force the use of hierarchies and impose nomenclatures where problem are expected to appear: each dataset has its own group, each group can encapsulate other groups, each parameter of a group applies to all its sub-groups if the subgroup does not change its value, each array of a group applies to all of its sub-groups if the sub-group does not redefine an array with same name, the names of the groups are held as parameters and their ID are managed by the software. For the Plotly interface, I don’t know how to integrate it to Qt but if you find a way to do it, that’s perfect with me :) My vision of the GUI is something that unifies the format and can then execute scripts on the data stored in this format. I have pushed the application of the GUI to my data up to the point where I can do the whole information extraction process from it (add data, convert to PSD, fit curves). I think this could be super interesting if we implement it for all techniques. I think we could formalize the project in milestones, in particular define the minimal denominator that will allow us to have the paper. The milestone I reached for my spectro encompasses the following points: - Being able to add data to the file easily (by dragging & dropping to the GUI) - Being able to assign properties to these data easily (again by dragging & dropping) - Being able to structure the added data in groups/folders/containers/however we want to call it - Making it easy for new data types to be loaded - Allowing data from same type but different structure to be added (e.g. .dat files) - Execute scripts on the data easily and allowing parameters of these scripts to be defined from the GUI (e.g. select a peak on a curve to fit this peak) - Make it easy to add scripts for treating or extracting PSD from raw data. - Allow the export of a Python code to access the data from the file (we cans see them as “break points” in the treatment pipeline) - Edit of properties inside the GUI In any case I think we could build a spec sheet for the project with what we want to have in it based on what we want to advertise in the paper. We can always add things later on but if we agree on a strict minimum to have the project advertised, then that will set its first milestone on which we’ll be able to build later on. Best, Pierre Pierre Bouvet, PhD Post-doctoral Fellow Medical University Vienna Department of Anatomy and Cell Biology Wahringer Straße 13, 1090 Wien, Austria On 17/2/25, at 14:53, Carlo Bevilacqua via Software wrote: Hi Pierre, hi Sal, thanks for sharing your thoughts about it. @Pierre I am very sorry that Ren passed away :( As far as I understood you are suggesting to work on the individual aspects separately and then merge them together at a later stage? I am fine with that but I still think it is very important to now agree on what should be in the file format we are defining, because that is kind of the core of the project and will affect a lot of the design choices. I am happy to start working on the GUI for data visualization. In my idea, it will be something similar to this (https://www.nature.com/articles/s41592-023-02054-z/figures/10) but written in dash (https://dash.plotly.com/), so it is a web app that for now can run locally (so no transfer of data to an external server is required) but in the future can easily be uploaded to a website that people can just use without installing anything on their computer. The question is how much of the data processing should be possible to do (or trigger) from the same GUI? I think at least a drop down menu with different fitting functions should be there, so the user can quickly check the results on a spectrum from a specific point in the image. @Pierre how are you envisioning the GUI you are working on? As far as I understood it is mainly to get the raw data and save it to our HDF5 format with some treatment on it. One idea could be to have a shared list of features that we are implementing in the GUI as we work on it, to avoid having the same functionality duplicated (or worst inconsistent) between the GUI for generating our file format and the GUI for visualization. Let me know what you think about it. Best, Carlo On Mon, Feb 17, 2025 at 11:04, Pierre Bouvet via Software wrote: Hi everyone, Sorry for the delayed response, I just went through the loss of Ren (my dog) and wasn’t at all able to answer. First of, Sal, I am making progress and I should have everything you have made on your branch integrated to the GUI branch soon, at which point I will push everything to main. Regarding the project, I think I align with Sal: keep things as simple as possible. My approach was to divide everything in 3 mostly independent layers: - Store data in an organized file that anyone can use, and make it easy to do - Convert these data into something that has physical significance: a Power Spectrum Density - Extract information from this Power Spectrum Density Each layer has its own challenge but they are independent on the challenge of having people using it: personally, if I had someone come to me with a new software to play with my measures, I would most likely only look at it for 1 minute (or less depending who made it) with a lot of apprehension and then based on how simple it looks and how much I understood of it, use it or - what is most likely - discard it. This is why Project.pdf (https://github.com/bio-brillouin/HDF5_BLS/blob/GUI_development/guides/Projec...) is essentially meant to say: we put data arrays in groups and give them attributes written in text, but you can also create groups within groups to organize your data! I believe most of the people in the BioBrillouin society will have the same approach and before having something complex that can do a lot, I think it’s best to have something simple that can just unify the format (which in itself is a lot) and that people can use right away with a minimal impact on their own individual pipelines for data processing. To be honest, I don’t think people will blindly trust our software at first to treat their data, but they will most likely use it at first to organize their raw spectra, and maybe add their own treated data if they are feeling particularly adventurous. But that is not a problem as long as we start a movement. From there yes, we can complexity and create custom file architectures but that is already too complex I think for this first project. If we can all just import our data to the wrapper and specify their attributes, this will already be a success. Then for the paper, if we can all add a custom code to treat these data to obtain a PSD, I think this will be enough. As I said, the current API already allows you to add your data in a variety of format, so it’s just a question of developing the PSD conversion before having something we can publish (and then tell people to use). A few extra points: - Working with my setup, I realized if the user could choose between different algorithms to treat their own data, it would make the overall project much more usable (if an algorithm bugs for whatever reason, you can use another one) so I created 2 bottle necks in the form of functions (for PSD conversion and treatment) that would inspect modules dedicated to either PSD conversion or treatment, and list existing functions. It’s in between classical and modular programming but it makes the development of new PSD conversion code and treatment way way easier - The GUI is developed using oriented-object programming. Therefore I have already made some low-level choices that kind of impact all the GUI. I’m not saying they are the best choices, I’m just saying that they work, so if you want to work on the GUI, I would either recommend getting familiar with these choices, or making sure that all the functionalities are preserved, particularly the ones that are invisible (logging of treatment steps, treatment errors…) I’ll try merging the branches on Git asap and will definitely send you all an email when it’s done :) Best, Pierre Pierre Bouvet, PhD Post-doctoral Fellow Medical University Vienna Department of Anatomy and Cell Biology Wahringer Straße 13, 1090 Wien, Austria On 14/2/25, at 19:36, Sal La Cavera Iii via Software wrote: Hi all, I agree with the things enumerated and points made by Kareem/Carlo! I guess I would advocate for starting from a position of simplicity. We probably don't want to get weighed down by trying to include a bunch of bells and whistles from the start as these can be easily added once there is a minimally viable stable product. As long as data can be loaded to local memory, then treated in various (initially simple) ways through the GUI (and maybe maintain non-GUI compatibility for command-line warriors like myself), then the bh5 formatting stuff can be sorted on the back end? I definitely agree with Carlo's structure set out in the file format document; but all of that data will be floating around the memory in some shape or form and just needs to be wrapped up and packaged (according to Carlo's structure e.g.) when the user is happy and presses the "generate h5 filestore" etc. (?) Definitely agree with the recommendation to create the alpha using mainly requirements that our 3 labs would find useful (import filetypes, treatments, etc), and then we can add on more universal functionality second / get some beta testers in from other labs etc. I'm able to support on whatever jobs need doing and am free to meet in the beginning of March like you mentioned Kareem. Hope you guys have a nice weekend, Cheers, Sal --------------------------------------------------------------- Salvatore La Cavera III Royal Academy of Engineering Research Fellow Nottingham Research Fellow Optics and Photonics Group University of Nottingham Email: salvatore.lacaveraiii@nottingham.ac.uk (mailto:salvatore.lacaveraiii@nottingham.ac.uk) ORCID iD: 0000-0003-0210-3102 (https://outlook.office.com/bookwithme/user/6a3f960a8e89429cb6fc693c01d10119@...) Book a Coffee and Research chat with me! ------------------------------------ From: Carlo Bevilacqua via Software Sent: 12 February 2025 13:31 To: Kareem Elsayad Cc: sebastian.hambura@embl.de (mailto:sebastian.hambura@embl.de) ; software@biobrillouin.org (mailto:software@biobrillouin.org) Subject: [Software] Re: Software manuscript / BLS microscopy You don't often get email from software@biobrillouin.org (mailto:software@biobrillouin.org). Learn why this is important (https://aka.ms/LearnAboutSenderIdentification) Hi Kareem, thanks for restarting this and sorry for my silence, I just came back from US and was planning to start working on this again. Could you also add Sebastian (in CC) to the mailing list? As you outlined, I would split the project into two parts: 1) getting from the raw data to some standard "processed' spectra and 2) do data analysis/visualization on that. For the second part the way I envision it is: * the most updated definition of the file format from Pierre is this one (https://github.com/bio-brillouin/HDF5_BLS/blob/GUI_development/guides/Projec...), correct? In addition to this document I think it would be good to have a more structured description of the file (like this (https://github.com/prevedel-lab/Brillouin-standard-file/blob/main/docs/Bh5_f...)), where each field is clearly defined in terms of data type and dimensions. Sebastian was also suggesting that the document should contain the reasoning behind each specific choice in the specs and also things that we considered but decided had some issues (so in future we can look back at it). I still believe that the file format should contain the "processed" spectra (i.e. after FT and baseline subtraction for impulsive, or after taking a line profile and possibly linearization with VIPA,...) so we can apply standard data processing or visualization which is independent on the actual underlaying technique (e.g. VIPA, FP, stimulated, time domain, ...) * agree on an API to read the data from our file format (most likely a Python class). For that we should: 1) decide on which information is important to extract (spectral information, spatial coordinates, hyper-parameters, metadata,...) 2) implement an interface to read the data (e.g. readSpectrumAtIndex(...), readImage(...), ...) * build a GUI that use the previously defined API to show and process the data. I would say that, once we have a very solid description of the file format as in step 1, step 2 will come naturally and we can divide the actual implementation between us. Step 3 can also easily be implemented and divided between us once we have an API (and I am happy to work on the GUI myself). The first half of the project is the trickiest and I know Pierre has already done a lot of work in that direction. We should definitely agree on which extent we can define a standard to store the raw data, given the variability between labs, (and probably we should do it for common techniques like FP or VIPA) and how to implement the treatments, leaving to possibility to load some custom code in the pipeline to do the conversion. Let me know what you all think about this. If you agree I would start by making a document which clearly defines the file format in a structured way (as in my step 1 before). @Pierre could you write a new document or modify the document I originally made (https://github.com/prevedel-lab/Brillouin-standard-file/blob/main/docs/Bh5_f...) to reflect the latest structure you implemented for the file format? The metadata can still be defined in a separated excel sheet, as long as the data type and format is well defined there. Best regards, Carlo On Wed, Feb 12, 2025 at 02:19, Kareem Elsayad via Software wrote: Hi Robert, Carlo, Sal, Pierre, Think it would be good to follow up on software project. Pierre has made some progress here and would be good to try and define tasks a little bit clearer to make progress… There is always the potential issue of having “too many cooks in the kitchen” (that have different recipes for same thing) to move forward efficiently, something that I noticed can get quite confusing/frustrating when writing software together with people. So would be good to clearly assign tasks. I talked to Pierre today and he would be happy to integrate things in framework we have to try tie things together. What would foremost be needed would be ways of treating data, meaning code that takes a raw spectral image and meta-data and converts it into “standard” format (spectral representation) that can then be fitted. Then also “plugins” that serve a specific purpose in the analysis/rendering that can be included in framework. The way I see it (and please comment if you see differently), there are ~4 steps here: * Take raw data (in .tif,, .dat, txt, etc. format) and meta data (in .cvs, xlsx, .dat, .txt, etc.) and render a standard spectral presentation. Also take provided instrument response in one of these formats and extract key parameters from this * Fit the data with drop-down menu list of functions, that will include different functional dependences and functions corrected for instrument response. * Generate/display a visual representation of results (frequency shift(s) and linewidth(s)), that is ideally interactive to some extent (and maybe has some funky features like looking at spectra at different points. These can be spatial maps and/or evolution with some other parameter (time, temperature, angle, etc.). Also be able to display maps of relative peak intensities in case of multiple peak fits, and whatever else useful you can think of. * Extract “mechanical” parameters given assigned refractive indices and densities I think the idea of fitting modified functions (e.g. corrected based on instrument response) vs. deconvolving spectra makes more sense (as can account for more complex corrections due to non-optical anomalies in future –ultimately even functional variations in vicinity of e.g. phase transitions). It is also less error prone, as systematically doing decon with non-ideal registration data can really throw you off the cliff, so to speak. My understanding is that we kind of agreed on initial meta-data reporting format. Getting from 1 to 2 will no doubt be most challenging as it is very instrument specific. So instructions will need to be written for different BLS implementations. This is a huge project if we want it to be all inclusive.. so I would suggest to focus on making it work for just a couple of modalities first would be good (e.g. crossed VIPA, time-resolved, anisotropy, and maybe some time or temperature course of one of these). Extensions should then be more easy to navigate. At one point think would be good to involve SBS specific considerations also. Think would be good to discuss a while per email to gather thoughts and opinions (and already start to share codes), and then plan a meeting beginning of March -- how does first week of March look for everyone? I created this mailing list (software@biobrillouin.org (mailto:software@biobrillouin.org)) we can use for discussion. You should all be able to post to (and it makes it easier if we bring anyone else in along the way). At moment on this mailing list is Robert, Carlo, Sal, Pierre and myself. Let me know if I should add anyone. All the best, Kareem This message and any attachment are intended solely for the addressee and may contain confidential information. If you have received this message in error, please contact the sender and delete the email and attachment. Any views or opinions expressed by the author of this email do not necessarily reflect the views of the University of Nottingham. Email communications with the University of Nottingham may be monitored where permitted by law. _______________________________________________ Software mailing list -- software@biobrillouin.org (mailto:software@biobrillouin.org) To unsubscribe send an email to software-leave@biobrillouin.org (mailto:software-leave@biobrillouin.org) _______________________________________________ Software mailing list -- software@biobrillouin.org (mailto:software@biobrillouin.org) To unsubscribe send an email to software-leave@biobrillouin.org (mailto:software-leave@biobrillouin.org) _______________________________________________ Software mailing list -- software@biobrillouin.org (mailto:software@biobrillouin.org) To unsubscribe send an email to software-leave@biobrillouin.org (mailto:software-leave@biobrillouin.org) _______________________________________________ Software mailing list -- software@biobrillouin.org (mailto:software@biobrillouin.org) To unsubscribe send an email to software-leave@biobrillouin.org (mailto:software-leave@biobrillouin.org) _______________________________________________ Software mailing list -- software@biobrillouin.org (mailto:software@biobrillouin.org) To unsubscribe send an email to software-leave@biobrillouin.org (mailto:software-leave@biobrillouin.org) _______________________________________________ Software mailing list -- software@biobrillouin.org (mailto:software@biobrillouin.org) To unsubscribe send an email to software-leave@biobrillouin.org (mailto:software-leave@biobrillouin.org) _______________________________________________ Software mailing list -- software@biobrillouin.org (mailto:software@biobrillouin.org) To unsubscribe send an email to software-leave@biobrillouin.org (mailto:software-leave@biobrillouin.org) _______________________________________________ Software mailing list -- software@biobrillouin.org (mailto:software@biobrillouin.org) To unsubscribe send an email to software-leave@biobrillouin.org (mailto:software-leave@biobrillouin.org)
Hi everyone, First off I just want to acknowledge the hard work and thoughtful approaches coming from both sides! I think this is one of those situations where there's no clearcut perfect/ideal way to do it. Yes perhaps certain approaches will be most compatible with certain visions / anticipated use-cases. Right now I see this as not " a battle for supremacy of the future BLS signal processing pipeline" but more of an opportunity to "integrate over different opinions which by definition will result in the most generalised useful solution for the future community." With that being said, I think we're getting a bit stuck in the mud / failure to launch / paralysis by over-analysis (insert whatever idiom you'd like here). I appreciate that we want to get this right from the very beginning so that we're united with a clear vision/future direction, and to avoid backtracking/redoing things as much as possible. I also appreciate that I do not have a horse in this race compared to you guys. Our lab uses custom matlab code, and we only consider ourselves in how it was developed. You guys on the other hand, use similar equipment / data sets / signal processing pipelines. But we're at the point where each lab wants "their way" of doing things to be adopted by the world (and leads to impasses and entrenchment). I digress... I haven't worked with hdf5 before, so my expertise is somewhat limited, but from what I can gather based on reading up on things / the points made in your debates there are some pro's/con's for each approach: [cid:d82e47c3-43aa-4c30-a369-f87a1af762fd] (I may be wrong on some of the above, feel free to ignore/correct etc) If we're expecting absolutely MASSIVE experiments to be pumped through the system, then perhaps the abstraction offered by the hierarchical approach is preferred and the additional complexity is justified. If we're instead appealing to the average user that just wants to store a couple imaging results and visualise, then staying lean-and-mean with the flat approach seems easiest. Historically our lab tends towards the flatter side of things, but this is potentially because we haven't done enormous enormous multivariate studies yet. And so in terms of future use cases for this project wrt our time domain lab, the multivariate experimental data organisation is most useful for us compared to just visualising the data (we already do that routinely with interactive plots/maps). Perhaps the flat-to-hierarchical (and vice-versa) conversion functionality is the way to go? Yes it will be more work, but it will give the Nat Meth/BLS community a better/tuneable product. So the user can choose which structure type they want in their h5 file. But I think we definitely want the plotting functionality to be dependent on a single structure (e.g. flat). So the conversion function will play a functional role in ensuring compatibility with the plotting (also hdf5 files potentially not generated by our project). Otherwise, if we want the debate to continue, perhaps both sides should prepare a mock h5 file with the different structures? E.g. 8 data sets with 2 Specimens with 2 temperatures each and 2 mutations each? (even if it's just the same data copied over a bunch of times). Then we can send the file around, have a play, compare scripts, etc. Happy to support no matter which path is chosen, and will have availability to meet biweekly as discussed! Cheers everyone, Sal --------------------------------------------------------------- Salvatore La Cavera III Royal Academy of Engineering Research Fellow Nottingham Research Fellow Optics and Photonics Group University of Nottingham Email: salvatore.lacaveraiii@nottingham.ac.uk<mailto:salvatore.lacaveraiii@nottingham.ac.uk> ORCID iD: 0000-0003-0210-3102 [cid:ade5ba43-1fd8-4857-8e32-c3c2a25897bc]<https://outlook.office.com/bookwithme/user/6a3f960a8e89429cb6fc693c01d10119@...> Book a Coffee and Research chat with me! ________________________________ From: Carlo Bevilacqua via Software <software@biobrillouin.org> Sent: 05 March 2025 15:58 To: software@biobrillouin.org <software@biobrillouin.org> Subject: [Software] Re: [EXTERN] Re: Software manuscript / BLS microscopy Hi Kareem, thanks for great summary. I largely agree with the way you described what I have in mind, I would only add two points: * In the case of discrete parameters they can be stored as "fake" timepoints, as you mentioned. I think this is fair, because anyways they will be in practice acquired at different times (one need to change the sample, temperature, etc...). In that case the only difference between my and Pierre's approach is that Pierre would store them in a hierarchical structure and I would do it in a flatten structure (which I believe is always possible because the hierarchy in Pierre's case is not given by some parent/children relationship, but each leaf of the tree is uniquely defined by a set of parameters) * in the case of angularly resolved measurements, my structure actually allow these type of measurements to be stored in a single file, (even in a single dataset - see the description of ' /data{n}/PSD<https://github.com/bio-brillouin/HDF5_BLS/blob/main/Bh5_file_spec.md>' ); I think this is a good way to store spectra acquired simultaneously, where you have many spectra acquired always in the same condition (clear example is the angularly-resolved VIPA) and one can add an arbitrary number of such "parameters" by adding more dimensions Now, going to the reasons why I don't think Pierre's approach would work for what I am trying to do: * he gives complete flexibility to the dimensions of each dataset, which has the advantage of storing arbitrary data but the drawback of not knowing what each dimension corresponds to (so how to treat/visualize them with a standard software?); also, I want to highlight that in the format I am proposing people could add as many dataset/group to the file as they want: this will give them complete flexibility on what to store in the file without breaking the compatibility with the standard (the software will just ignore the data that is not part of the standard); I don't see the reason of forcing people to add data non required by the standard in a structured way, if anyway a software could not make any use of that, not knowing what that data means * there is no clear definition on how a spatial mapping is stored, so it is hard to do the visualization I mentioned in my previous email where I can show the image of the sample My counter-proposal (mostly aligning with what you proposed) is that, since it is difficult to agree on the link between the two projects and, as you pointed out, they are mostly independent, I would propose that for now we work to two completely separated projects. Currently Robert is away for more than one week, but once he will back we can discuss if strategically it makes sense to try to merge them later or keep them separated. Let me know if you agree with this. Best, Carlo On Wed, Mar 5, 2025 at 10:31, Kareem Elsayad via Software <software@biobrillouin.org> wrote: Dear All, Having read through the emails finally, here is what I gather. Keeping in mind that I may be misunderstanding things (correct me), this is how I would suggest we proceed. (Now it’s my go to write a long email 😊) Carlo’s vision appears to be to have (conceptually) the equivalent of a .tiff file used in e.g. fluorescence confocal microscopy that represents one particular measurement. this could be data (in the form of PSD for each voxel) pertaining to a spatial 2D or 3D scan/image. It may also be a time course 2D or 3D set of images (as is also possible in .tiff). The file also contains metadata (objective, laser wavelength/power, etc. used – basically the stuff in our consensus reporting xls). In addition it also (optionally) contains the Instrument Response Function (IRF). Potentially the latter is saved in the form of a control spectra of a known (indicated) material, but I would say more ideally it is stored as an IRF as this is more universal (between techniques), requires no additional info (measured sample), and is easier and faster to work with on analysis/fitting side (saves additional extraction of IRF which will be technique dependent). Now this is all well and good and I am fine with this. The downside is that it is limited to wanting to look at images /volume-images and (optionally) how they evolve over time. If you want to see how something changes with temperature or any other variable, or e.g. between two mutants, you would just save each as a separate file. This is usually what biologists are used to. Sure it might not be the most memory efficient (you would have to write all the metadata in each) but I don’t see that as an issue since this doesn’t take up too much memory (and we’ve become a lot better at working with large files than we were say 10 years ago). The downside comes when you want to look at say how the BLS spectra at a single position or a collection of voxels changes as you tune some parameter. Maybe for static maps you could “fake it” and save as a time series, which software recognizes? However, if you have 50 different BLS spectra for each voxel in a 3D space in a time series measurement (from e.g. 50 different angles) you have an extra degrees of freedom …would one need 50 files, one for each angle bin?. So it’s not necessarily different experiments, but just in this case one additional degree of freedom. Given dispersion only needs to be in one direction and we have two degrees of freedom on our camera, one can envision this extra degree of freedom being used for various other things (I.e not only spatial or angular multiplexing). Then there is maybe some physical-chemist-biologist who wants to say measure the change in linewidth as he/she induces a phase transition by tuning one thing or another at a single point (or few points). He/she is probably fine fitting each spectra with their own code as they scan e.g. the temperature across the transition. The question is do we also want to cater for him/her or are we just purely for BLS imaging? Pierre’s vision appears to be to have maximum flexibility in this regard, with a structure that is general enough to optimally accommodate for saving data for an entire multi-variable experiment. Namely if you do an angle-resolved map of a cell over time and repeat the experiments at different temperatures, and then say also for different mutants, you can store all that data in a single file. I think this is a very noble and cool idea, except that in practice you will (biology being biology) need to do this on >10 cells (in each case) to get anything statistically significant. You can in principle put that too into the same file, but now we are talking about firstly increased complexity (which I guess can theoretically be overcome since to most people this is a black box anyhow) but ultimately doing/reporting science in a way biologists – or indeed most scientists - are not used to (so it would be trend-setting in that sense – having an entire study in a single file, with statistics and so forth done not separately and differently between labs). This is certainly not a conceptually a crazy idea, and probably even the future of science (but maybe something best exploring firstly in a larger consortium with standard fluorescence, EM etc. techniques if it hasn’t already – which it probably has). It also makes things more amiable to be analyzed and compared (between different studies) by e.g. AI in a multi-variate/dimensional way (maybe should propose to Zuckerberg?). I digress. I think here it is worth keeping things not just as simple but also as basic as possible. With Nat Meth (assuming they consider interesting enough) the focus is biologists in their current state of mind, and with their current habits, and that is kind of what we need to cater for when trying to sell an exotic technique to the masses. So, following my rambling, here is how I think we should proceed, as we need to move forward and not dwell on this longer. As mentioned in previous emails, this is basically two separate projects (of equal importance) that just need to agree on their meeting point in the middle. It is ideal that the goals are already more or less defined between getting raw data to a “standard” format (Vienna/Nottingham side), and “fitting/presenting” data (Heidelberg side). Not reaching a general consensus on the h5 format I would suggest that Carlo/Sebastian work with their file format and Pierre/Sal with theirs and we figure how to patch together after (see below). It maybe would be good to clarify some of the lingo first to avoid misunderstandings. (Maybe the below has been defined, in which case ignore and see it as a reflection of my naivety)… Firstly, “treatment”. Is this “just” the step from getting from the raw acquired spectra to an agreed upon, universally applicable, presentation of the PDS for each voxel (excl. any decon., since we fit IRF modified Lorentzians/DHOs) which can be fed into the same fitting procedure(s)? This would I guess only include one peak (e.g. anti-Stokes) since in time domain that’s all you’ll get out anyhow. Does it refer to the entire construction of the h5 file? Does it include the fitting and extraction of the frequency shifts and linewidths? the calculation of viscoelastic moduli (if one provides auxiliary parameters like refractive index and density)? Secondly, and related, in dividing tasks it is also not clear to me if the “standard” h5 file contains also the fitted values for frequency shift/linewidth or just the raw data. From the division of work load my understanding is that the fitting will be done in Carlo/Sebastian’s code (?). Will the fitted values then also be included in the h5 file or not? (i.e. additionally written into it after it was generated from Pierre’s codes). There is no point of everybody doing their own fitting code, which would kinda miss the point of having some universality/standard? I guess to me it is unclear where the division of labor is. To keep things simple I would suggest that Pierre’s code simply generates the standard h5 file (unfitted, but in a standard PSD presentation for each voxel, and includes optional IRF), and then Carlo/Sebastian’s codes do the fitting and resaves the fitting parameters into some empty/assigned space in that same h5 file. If the h5 file already contains fitted paramaters (from previously running Carlo/Sebastian’s code) then these can directly be displayed (or one can chose to fit again and overwrite). How does this sound to everyone? This does not address the contention of the file format. The solution proposed in our last Zoom meeting was creating a code that converts one (Pierre’s) file format to the other (Carlo’s). This is I think in light of the recent emails I think the only reasonable solution, and probably maybe even a great solution, considering that Pierre’s file format may contain multiple additional information (entire experiments) and the conversion between the two can allow one to e.g. pick out specific ones if and as relevant. It doesn’t have to be elaborate at this point, but it can have the potential to be for multi-variate data down the line. So this divide is actually a plus as it keeps door open for more complex data sets, without them being a neccesity. Would it maybe be possible for Pierre and Carlo to write this conversion program together as a first step? Just needs to be rudimentary so that individual parties can start working on their sides independently asap? This code can then in the end be tacked on to one or the other codes developed by the two parties, depending on what we decide to be the standard reporting format. It is also not crazy to consider in the end two file formats that can be accepted, one maybe called “measurement”-file format, and one “experiment”-file format, that the user selects between when importing? As such if this conversion code is in Pierre’s code one may have the option to export as one of these two formats. If it is also in Carlo’s code, one has option to read either format. This way one has option of saving as and reading out from both a single image/series of images (as is normally done in bioimaging) as well as an entire experiment as one pleases and everybody is happy 😊 How does this sound? I hope the above is a suitable way to move forward, but ofcourse let me know your thoughts and happy with alternatives… Regarding the bi-weekly meetings suggested by Robert. I still think this makes sense… Ofcourse not everybody needs to attend all if busy, but having this time slot earmarked in calender for when it becomes necessary might be nice. I will send out an email with dates/invite info… All the best, and hope this moves forward from here!!:) Kareem From: Pierre Bouvet via Software <software@biobrillouin.org<mailto:software@biobrillouin.org>> Reply to: Pierre Bouvet <pierre.bouvet@meduniwien.ac.at<mailto:pierre.bouvet@meduniwien.ac.at>> Date: Tuesday, 4. March 2025 at 11:20 To: Carlo Bevilacqua <carlo.bevilacqua@embl.de<mailto:carlo.bevilacqua@embl.de>> Cc: "software@biobrillouin.org<mailto:software@biobrillouin.org>" <software@biobrillouin.org<mailto:software@biobrillouin.org>> Subject: [Software] Re: [EXTERN] Re: Software manuscript / BLS microscopy Hi everyone, The spec sheet I defined for the format is there<https://github.com/bio-brillouin/HDF5_BLS/blob/main/guides/SpecSheet/SpecShe...> (I thought I had pushed it already but it seems not). To make it simple, my aim is to have a simple way (emphasis on simple) to store any kind of data obtained with as many different setups as possible, follow a unified pipeline<https://github.com/bio-brillouin/HDF5_BLS/blob/main/guides/Pipeline/Pipeline...> and allow a unified treatment of the data. From this spec sheet I built this structure<https://github.com/bio-brillouin/HDF5_BLS/blob/main/guides/Project/Project.p...> which I’ve been using for a few months now and that seems robust enough, in fact what blocked me for adapting it to time-domain was not the structure but the code I already had written to implement it. Once again, visualizing data is not the priority for me, because I believe the main problem in the community today is that we don’t have a single, robust and well-characterized way of extracting information from a PSD. Best, Pierre Pierre Bouvet, PhD Post-doctoral Fellow Medical University Vienna Department of Anatomy and Cell Biology Wahringer Straße 13, 1090 Wien, Austria On 3/3/25, at 21:32, Carlo Bevilacqua via Software <software@biobrillouin.org<mailto:software@biobrillouin.org>> wrote: Hi all, we are still trying to find an agreement with Pierre but I think that, a part from the technicalities that we can probably figure out between ourselves, we have a different view on the aims of the file format and the project in general. Although I agree that for now we could work with separate files and convert between them, eventually we need to agree on a format to propose as a standard and I want to avoid postponing the decision (at least for the general structure, of course minor details can change during the process). Otherwise I am afraid that, once most of the code is written, it will be hard to unify it and this will make the decision even more difficult. What I see as the main points of this project are: * to have some sort of TIFF for Brillouin data, with the main aim of storing images (i.e. spatial maps of a sample) together with the spectral data that it is used to generate them and the relevant metadata and calibration data * while allowing the possibility of storing single spectra or spectra acquired in different conditions in multiple samples (i.e. having a whole study in a single file), I don't see this as a determinant in defining the file. That is because the same result can be achieved by having multiple file with a clear naming convention (e.g. ConcentrationX_TemperatureY_SampleN), which is commonly done in microscopy and I feel it is a "cleaner" solution than having everything in a single file * the analysis part of the software should be able to perform standard Brillouin analysis (i.e. fit the spectra with different functions that the user can select) but possibly more advanced stuff (like PCA or non-negative matrix factorisation) * the visualization part would be similar to this<https://www.nature.com/articles/s41592-023-02054-z/figures/10>, where the user can click on a pixel and see the corresponding spectrum (possibly selecting different fit functions and see the result on the fly). If multiple images are stored in the file, some dropdown menus would appear to select the relevant parameters, which identify a single image. I discussed about these points with Robert and Sebastian and we agree on them. The structure of the file I proposed (and refined with input from Pierre and Sebastian) is designed with these aims in mind. @Pierre, can you please list your aims? I don't want write what I understood from you because I might misrapresent them. It would be good to have your feedback on what you consider to be the main aims and priorities, so we can have the last iteration on the format, as we'd like to proceed with the actual coding. Best regards, Carlo On Fri, Feb 28, 2025 at 19:01, Pierre Bouvet via Software <software@biobrillouin.org<mailto:software@biobrillouin.org>> wrote: Hi everyone :) As I told you during the meeting, I just pushed everything on Git and merged with main. You can normally clone the project and test it on your machines by running the HDF5_BLS_GUI/main.py script from base repository. If it doesn’t work, it might be an os compatibility issue on the paths, but I’m hopeful I won’t have to patch that ^^ You can quickly test it with the test data provided in tests/test_data, this will however only allow you to do the most basic things (import data and edit parameters). A first version of the parameter spreadsheet (the child of the Consensus paper) is located in “spreadsheets”. You can open this file and edit it and then export it as csv. The exported csv can be dragged and dropped into the right frame of the GUI to update all the parameters of the group or dataset that you have selected in the left frame. Naturally, this GUI is built on the hierarchical structure I propose for the HDF5 file (described in guides/Project/Project.pdf), note however that it can be adjusted to a linear approach (cf discussion of today) so see this more as a first “usability” test of a - relatively - stable version, and a way for you to make a list of everything that is wrong with the software. @ Sal: I’ll soon have the code to convert your data to PSD & frequency arrays, but I’m confident you can already use the format to store your spectra as time arrays (with abscissa) from your .dat and .con files (and .. Note that because I don’t have order of magnitudes for the parameters you use, I could only test the GUI and its usability. In case you are looking for the code for importing your data, it’s in HDF5_BLS/load_formats/load_dat.py in the “load_dat_TimeDomain” function Last thing: I located the developer guide I couldn’t find during the meeting and placed it back where I thought it was (guides/DeveloperGuide/ModuleDeveloperGuide.pdf). I’m underlining this document because this is maybe the most important one of the whole project since it’s where people that want to collaborate after it’s made public will go to. The goal of this document is to take people by the hand and help them making their additions compatible with the whole project. For now this document only talks about adding data. Best, Pierre Pierre Bouvet, PhD Post-doctoral Fellow Medical University Vienna Department of Anatomy and Cell Biology Wahringer Straße 13, 1090 Wien, Austria On 28/2/25, at 14:18, Carlo Bevilacqua via Software <software@biobrillouin.org<mailto:software@biobrillouin.org>> wrote: Hi all, I made a file describing the file format, you can find it here<https://github.com/bio-brillouin/HDF5_BLS/blob/main/Bh5_file_spec.md>. I think that attributes are easy to add and names of groups/datasets can be changed (if they are unclear now), so these are details that we don't need to discuss now. What I find most important to agree on now is the general structure. In that sense that are still some points under discussion between me and Pierre, but hopefully we can iron them out during the meeting. Talk to you in a bit, Carlo On Wed, Feb 26, 2025 at 23:56, Kareem Elsayad <kareem.elsayad@meduniwien.ac.at<mailto:kareem.elsayad@meduniwien.ac.at>> wrote: Hi Carlo, Sounds great! Yes, Fri 28th @3pm still works for me. If it works for others, here is Zoom we can use: https://us02web.zoom.us/j/5191046969?pwd=alpzaldoZEd3N2ZEQ0hYZU1RR1dOdz09 Meeting ID: 519 104 6969 Passcode: jY3zH8 All the best, kareem From: Carlo Bevilacqua via Software <software@biobrillouin.org<mailto:software@biobrillouin.org>> Reply to: Carlo Bevilacqua <carlo.bevilacqua@embl.de<mailto:carlo.bevilacqua@embl.de>> Date: Wednesday, 26. February 2025 at 20:43 To: Kareem Elsayad <kareem.elsayad@meduniwien.ac.at<mailto:kareem.elsayad@meduniwien.ac.at>> Cc: "software@biobrillouin.org<mailto:software@biobrillouin.org>" <software@biobrillouin.org<mailto:software@biobrillouin.org>> Subject: [Software] Re: [EXTERN] Re: Software manuscript / BLS microscopy Hi Kareem, thank you for your email. We are discussing with Pierre about the details of the file format and hopefully by our next meeting we will have agreed on a file format and we can divide the tasks. If it is still an option, Friday 28th at 3pm works for me. Best regards, Carlo On Mon, Feb 24, 2025 at 03:17, Kareem Elsayad <kareem.elsayad@meduniwien.ac.at<mailto:kareem.elsayad@meduniwien.ac.at>> wrote: Dear All, I (and Robert) were hoping there would be some consensus on this h5 file format. Let us do a Zoom on Fri 28th Feb at 15:00? A couple of points pertaining to arguments… Firstly, the precise structure is not worth getting into big arguments or fuss about…as long as it contains all the information needed for the analysis/representation, and all parties can work with (able to write and read knowing what is what), it ultimately doesn’t matter. In my opinion better put more (optional) stuff in if that is issue, and make it as inclusive as possible. In the end this does not need to be read by analysis/representation side, and when we go through we can decide if and what needs to be stripped. It is after all the “black box” between doing the experiment and having your final plots/images. Take a look at say a Zeiss file and try figure all that’s in it (it is not ideally structured maybe, but no biologist ever cared) – that said, I am sure their team had very similar arguments concerning structure etc.! (you have as many opinions as people). Maybe the issue is that the boundary conditions were not as well defined, but I would say at this point make them more inclusive than they need to be (empty spaces cost little memory) Secondly, and following on from firstly. We need to simply agree and compromise to make any progress asap. Rather than building separate structures we need to add/modify a single existing structure or we might as well be working on independent projects. Carlo’s initially proposed structure seemed reasonable, maybe with some minor changes, and we should just go with that as a basis in my opinion. I would suggest that Pierre and Carlo have a Zoom together and try and come up with something that is acceptable to both. Like everything in life, this will involve making compromises. And then present it on 28th Feb. Quite simply, if there is no agreement we cannot do this project and in the end it doesn’t matter who is right or wrong. Finally, I hope the disagreements from both sides are not seen as negative or personal attacks –it is ok to disagree (that’s why we have so many meetings!) On the plus side we are still more effective than the Austrian government (that is still deciding who should be next prime minister like half a year after elections) 😊 All the best, Kareem From: Pierre Bouvet via Software <software@biobrillouin.org<mailto:software@biobrillouin.org>> Reply to: Pierre Bouvet <pierre.bouvet@meduniwien.ac.at<mailto:pierre.bouvet@meduniwien.ac.at>> Date: Friday, 21. February 2025 at 11:55 To: Carlo Bevilacqua <carlo.bevilacqua@embl.de<mailto:carlo.bevilacqua@embl.de>> Cc: <software@biobrillouin.org<mailto:software@biobrillouin.org>> Subject: [Software] Re: [EXTERN] Re: Software manuscript / BLS microscopy Hi Carlo, Thanks for your reply, here is the next pong of this ping pong series ^^ 1- I was talking indeed about the enums, but also the parameters that are defined as integers or floating point numbers and uint32. I think its easier (and that we already agreed on) having a spreadsheet with the parameters (easy to use, easy to update, easy to store and modify between two experiments using the same setup, allows to impose fixed choices for some parameters with drop-down lists, allows to detail the requirements for the attribute like its format or units and allows examples) and to just import it in the HDF5 file. >From there it’s easier to have every attribute as strings both for the import and for the concept of what an attribute is. 2- OK 3- The problem is not necessarily the number of experiments you put in the file but the number of hyper parameters you want to take into account. Let’s take an example with a doubtable sense: I want to study the effect of low-frequency temperature fluctuations on micro mechanics in active samples both eukaryote and prokaryote showing a layered structure (endothelial cells arranged in epidermis, biofilms, …) with different cell types, and as a function of aging. I would then create a file with a first range of groups for the age of the sample, then inside these groups 2 groups for eukaryote and prokaryote samples, then inside these groups N groups for the samples I’m looking at, then inside these groups M groups for the temperature fluctuations I impose, then inside these groups the individual measures I make (this is fictional, I’m scared just to think at the amount of work to have all the samples, let alone measure them), this is simply not possible with your approach I think, and even simpler experiments like to measure the Allan variance on an instrument using 2 samples is not possible with your structure I think. 4- / 5- I think the real question is what we expect to get from a wrapper: for me is to wrap the measures of a given study, to then share, link to papers, treat using new approaches… Having a structure that can wrap both a full study and an experiment is in my opinion better in the long run than forcing the format to be used with only one experiment. 6- Yes, I understand it is an identifier, but why an integer? Why not a tuple? Why not a hash? And what if there’s a bug and instead of 3 you store you store 3.0, or 2, or ‘e'? Do you imagine the amount of work to understand where this bug comes from? Assuming it’s a bug because it might very well be just an inexperienced user making a mistake and then your file is broken. The idea is good but the safer way to have this is to work with nD arrays where the dimensionality is conserved I think, or just have all the information in the same group. 7- Here again, it’s more useful for your application but many people don’t use maps, so why force them to have even an empty array for that? Plus if they need to have a dedicated array for the concentration of crosslinkers (for example), they are faced with a non-trivial solution, which means they won’t use the format. 8- Yes, we could add an additional layer, but then it means that if you don’t need it, your datasets are in plain in the group and if you need it, then you don’t have the same structure. The solution I think is to already have the treated data in a group, if you don’t need more than one group (which will be most of the time the case) then you’ll only have one group of treated data. 9- I think it’s not useful. The SNR on the other hand is useful, because in shot-noise regime it’s a marker of variance, and this is one of the ways to spot outliers from treatment (if the SNR doesn’t match the returned standard deviation on the shift of one peak, there’s a problem somewhere). 10- The std of a fit is obtained by taking the square root of the diagonalized covariant matrix returned by the fit as long as your parameters are independent (it’s super interesting actually and a little bit more complicated but it’s true enough for lorentzian, DHO, Gaussian...) 11- OK but then why not have the calibration curves placed with your measures if they are only applicable to this measure? Once again, I think having indexes that are modifiable by the user is not safe (the technical term is “idiot proof”) 12- I don’t agree, if you are capturing points at a fixed interval, then you can reconstruct the timestamp from the timestamp of the first acquisition and either the delay between two acquisitions or the timestamp of the last acquisition. Most of the time however we don’t even need this as we consider the sample to be time-invariant on the scale of our measure, so a single timestamp for all the measure is enough and is better stored as an attribute. In the special case where we are not time-invariant, then time becomes the abscissa of the measures and in that case yes, it can be a dataset, but then it’s better to not impose a fixed name for this dataset and rather let the user decide what hyper parameter is changed during he’s measure, this way the user is free to use whatever hyper parameters he feels like it. 13- OK 14- Still not clear to me. My approach is to consider an experiment to be a measure of a sample as function of one or more controlled or measured hyper parameter. So my general approach for storing experiments is have 3 files: abscissa (with the hyper parameters that vary), measure and metadata, which translates to “Raw_data”, “Abscissa_i” and attributes for this format. 15- OK, I think more than brainstorming about how to treat correctly a VIPA spectrum, we need to allow people to tell how they do it if we want this project to be used in short term, unification is a goal of this project and we will advertise it in the paper, but to be honest, I doubt people like Giuliano will run with it without second guessing it, particularly with its clinical setups, so there will be some going back and forth before we have something stable, and this means we need to allow for this back and forth to appear somewhere, I propose having it as a parameter. 16- Here I think you allow too much liberty, changing the frequency of an array to GHz is trivial and I think most people do use GHz as the unit of their frequency arrays anyway. We need to make it clear that the frequency axis is in GHz but I think we don’t need a full element for this. If you really want to specify the unit of the Frequency dataset, I would suggest putting it in its attributes in any case, and not as another element in the structure. 17- OK 18- I think it’s one way to do it but it is not intuitive: I won’t have the reflex to go check in the attributes if there is a parameter “sam_as” to see if the calibration applies to all the curves. The way I would expect it to be is using the hierarchical logic of the format: if I’m looking at a dataset in a sub-group of a group containing a calibration dataset, then I know this calibration applies to my data: Data |- Data_0 (group) | |- Calibration (dataset) | |- Data_0 (group) | | |- Raw_data (dataset) | |- Data_1 (group) | | |- Raw_data (dataset) |- Data_1 (group) | |- Calibration (dataset) | |- Data_0 (group) | | |- Raw_data (dataset) I think in this example most people would suppose Data/Data_0/Calibration applies both to Data/Data_0/Data_0/Raw_data and Data/Data_0/Data_1/Raw_data but not Data/Data_1/Data_0/Raw_data whose calibration is intuitively Data/Data_1/Calibration Once again, my approach of the structure is trying to make it intuitive and most of all, simple. For instance if I place myself in the position of someone that is willing to try “just to see how it works”, I would give myself 10s to understand how I could have a file for only one measure that complies with the new (hope to be) standard. It is my opinion as I already told you before, that your approach is too complete and therefore complex, which will inevitably lead to people not using the format unless there’s a GUI to do it for them (and even then they might not use it). I don’t want to impose my vision here, and like you I have put a lot of thinking (and testing) into building the format I propose, but I’m convinced that if we go with your structure, not only will it make it hard for anyone to understand how to use it but we’ll have problems using it ourselves. I want to repeat that I don’t have the solution, I’m just confident that my approach is much easier to conceptually understand and less restrictive than yours. In any case we can agree to disagree on that, but then it’ll be good to have an alternative backend like the one I did with your format to try and use it, and see if indeed it’s better, because if it’s not and people don’t use it, I don’t want to go back to all the trouble I had building the library, docs and GUI just to try. I don’t want to impose you anything but it would be awesome if you took the time to read the document I made and completed for you yesterday. Then you can just tell me where you think I’m missing something and you had a better solution because as you might see, I’m having problems with nearly all your structure and we can’t really use it as a starting point at this stage since most of the backend is written and the front-end is already functional for my setup (and soon Sal’s and the TFP). Best, Pierre Pierre Bouvet, PhD Post-doctoral Fellow Medical University Vienna Department of Anatomy and Cell Biology Wahringer Straße 13, 1090 Wien, Austria On 20/2/25, at 22:55, Carlo Bevilacqua <carlo.bevilacqua@embl.de<mailto:carlo.bevilacqua@embl.de>> wrote: Hi Pierre, thank you for your feedback. I appreciate that you took the time to go through my definition and highlighting the critical points. I much prefer this rather than starting working with a file format where problem might arise in the future. If we understand what are the reasons behind our choices in the definition we can merge the best of the two approaches, rather than defining two "standards" for the same thing with each of them having their limitations. I will provide an answer to each of the points you raised (I gave numbers to the points in your email below, so it is easier to reference): 1. I am not sure to which attribute you are referring specifically, but I am completely fine with text; I defined enums where I felt it makes sense to do so because there is a discrete number of options (one could always add elements at the end of an enum) 2. I defined the attributes before we started working together and I am very much open to changing them so they reflect what you have in the spreadsheet; in the document defining the file format we can just state that the attributes and their type are defined in the excel sheet 3. I did it this way because in my idea an individual HDF5 file corresponds to a single experiment. If you feel there is an advantage in keeping different experiments in the same file I am open to introduce your structure of subgroups; I honestly feel like this will only make the file unnecessarly large and different experiments would mostly not share much (apart from the metadata, which is anyway a small overhead in terms of filesize). Now of course the question is what you define as an 'experiment': for me different timepoints or measurements at different temperatures/angles/etc on the same sample are a single experiment and I defined the file so that it is possible to save them in a single file; measurements on different samples are not the same experiment in my original idea 4. same as the point 3 5. same as before, I would put different samples in different files but happy to introduce your structure if you feel there is an advantage 6. the index is used to uniquely identify an entry in the 'Analysed_data' table; it is important in the contest of reconstructing the image (see the definition of the 'tn/image' group) 7. in my opinion spatial coordinates have a privileged role since we are doing imaging and having them well defined it is important to reconstruct the image; for different abscissas I defined the 'parameters' dataset (more in point 14). If one is not doing imaging this dataset can be set to an empty array or a single element (we can include this in the definition) 8. in my idea the "Analyzed_data" group doesn't contain multiple treatments but the result of the fit on the 'final' spectra, which are unique; if you are referring to the 'n' in the 'Shift_n_GHz' that is included in case a multipeak fit is performed. Now, if we want to include the possibility of multiple treatments like you are doing (which I didn't originally consider) we could just add an additional layer to the hierarchy 9. that is the amplitude of the peak from the fit. I am not sure if you didn't understand what I meant or you think it is not an useful information 10. The fit error actually contains 2 quantities: R2 and RMSE (as defined in the type). I am not sure how you would calculate a std from a single spectrum 11. the calibration curves are stored in the 'calibration_spectra' group with the name of the dataset matching the respective 'Calibration_index'. In our VIPA setup we are acquiring multiple calibration curves during a single acquisition to compensate for laser drift, that's why I introduced the possibility of having multiple calibration curves. Note that the 'Calibration_index' is defined as optional exactly because it might not be needed 12. each spectrum can have its own timestamp if it is acquired from a different camera image or scan of a FP, etc that's why it needs to be a dataset. Note that it is an optional dataset 13. good point, we can rename it to PSD 14. that is exactly to account for the general case of the abscissa not being a spatial coordinate and it contains the values for the parameters (e.g. the angles in an angle resolved measurement). It is a dataset whose dimensions are defined in the description (happy to elaborate more if it is not clear) 15. float is the type of each element; it is a dataset whose dimensions are defined in the description; the way to define the frequency axis in general for setups which don't have an absolute frequency (like VIPAs) is tricky and would be good to brainstorm about possibile solutions 16. as for the name we can change it, but the problem on how to deal with the situation when one doesn't have the frequency in GHz remains. My idea here was to leave the possibility of different units because the fit and most of the data analysis can be performed even if the x-axis is not in GHz and the actual conversion of the shift to GHz can be done at the end and requires the calibration data. As in my previous point, I am happy to brainstorm different solutions to this problem 17. it is indeed redundant with 'Analyzed_data' and I pushed a change on GitHub to correct this 18. see point 11; also note that the group is optional (in case people don't need it) and I introduced the attribute "same_as" to avoid repeating it multiple times if it is always the same for all the 'tn' As you see we agree with some of the points or we could find a common solution, for others it was mainly a misunderstanding on what were my intentions (probably my bad in expressing them, but you could have asked if it was not clear). Hope this helps claryfing my reasoning in the file definition and I am happy to discuss all the open points. I will look in details at your newest definition that you shared in the next days. Best, Carlo On Thu, Feb 20, 2025 at 18:25, Pierre Bouvet via Software <software@biobrillouin.org<mailto:software@biobrillouin.org>> wrote: Hi, My goal with this project is to unify the treatment of BLS spectra, to then allow us to address fundamental biophysical questions with BLS as a community in the mid-long term. Therefore my principal concern for this format is simplicity: measure are datasets called “Raw_data”, if they need one or more abscissa to be understood, this/these abscissa are called “Abscissa_i” and they are placed in groups called “Data_i” where we can store their attributes in the group’s attributes. From there, I can put groups in groups to store an experiment with different ... (e.g. : samples, time points, positions, techniques, wavelengths, patients, …). This structure is trivial but lacks usability so I added an attribute called “Name” to all groups that the user can define as he wants without impacting the structure. Now here are a few critics on Carlo’s approach. I didn’t want to share them because I hate criticizing anyone’s work, and I do think that what Carlo presented is great, but I don’t want you to think that I just trashed what he did, to the contrary, it’s because I see limitations in his approach that I tried developing another, simpler one. So here are the points I have problems with in Carlo’s approach: 1. The preferred type of the information on an experiment should be text as we’ll likely see new devices (like your super nice FT approach) appear in the next months/years that will require new parameters to be defined to describe them. I think we should really try not to use anything else than strings in the attributes. 2. The experiment information should not be defined by the HDF5 file structure but rather by a spreadsheet because everyone knows how to use Excel, and it’s way easier to edit an Excel file than an HDF5 file. 3. Experiment information should apply to measures and not to files, because they might vary from experiment to experiment, I think their preferred allocation is thus the attributes of the groups storing individual measures (in my approach) 4. The characterization of the instrument might also be experiment-dependent (if for some reason you change the tilt of a VIPA during the experiment for example), therefore having a dedicated group for it might not work for some experiments 5. The groups are named “tn” and the structure does not present the nomenclature of sub-groups, this is a big problem if we want to store in the same format say different samples measured at different times (the logic patch would be to have sub-groups follow the same structure so tn/tm/tl/… but it should be mentioned in the definition of the structure) 6. The dataset “index” in Analyzed_data is difficult to understand, what is it used for? I think it’s not useful, I would delete it. 7. The "spatial position" in Analyzed_data supposes that we are doing mappings. This is too restrictive for no reason, it’s better to generalize the abscissa and allow the user to specify a non-limiting parameter (the “Name” attribute for example) with whatever value he wants (position, temperature, concentration of whatever, …). A concrete example of a limit here: angle measurements, I want my data to be dependent on the angle, not the position. 8. Having different datasets in the same “Analyzed_data” group corresponding to the result of different treatments raises the question of where the process followed to treat the data is stored. A better approach would be to create n groups “Analyzed_data_n” with only one dataset of treated values, allowing for the process to be stored in the attributes of the group Analyzed_data_n 9. I don’t understand why store an array of amplitude in “Analyzed_data”, is it for the SNR? Then maybe we could name this array “SNR”? 10. The array “Fit_error_n” is super important but ill defined. I’d rather choose a statistical quantity like the variance, standard deviation (what I think is best), least-square error… and have it apply to both the Shift and Linewidth array as so: “Shift_std” and “Linewidth_std" 11. I don’t understand “Calibration_index”: where are the calibration curves? Are they in “experiment_info”? If so, we expect people to already process their calibration curves to create an array before adding them to the hdf5 file? I’m not very familiar with all devices, so I might not see the limitations here but do we ever have more than one calibration curve per measure? Could we not add it to the group as a “Calibration” dataset? Or just have one group with the calibration curve? 12. Timestamp is typically an attribute, it shouldn’t be present inside the group as an element. 13. In tn/Spectra_n , “Amplitude” is the PSD so I would call it PSD because there are other “Amplitude” datasets so it’s confusing. If it’s not the PSD, I would call it “Raw_data”. 14. I don’t understand what “Parameters” is meant to do in tn/Spectra_n, plus it’s not a dataset so I would put it in attributes or most likely not use it as I don’t understand what it does. 15. Frequency is a dataset, not a float (I think). We also need to have a place where to store the process to obtain it. In VIPA spectrometers for instance this is likely a big (the main even I think) source of error. I would put this process in attributes (as a text). 16. I don’t think “Unit” is useful, if we have a frequency axis, then we should define it directly in GHz, and if it’s a pixel axis, then for one we should not call it “Frequency” and then it’s better not to put anything since by default we will consider the abscissa (in absence of Frequency) as a simple range of the size of the “Amplitude” dataset. 17. /tn/Images: it’s a good idea, but I believe this is redundant with “Analyzed_data” (?) If it’s not then I don’t understand how we get the datasets inside it. 18. “Calibration_spectra” is a separate group, wouldn’t it be better to have it in “Experiment_info” in the presented structure? Also might scare off people that might not want to store a calibration file every time they create a HDF5 file (I might or might not be one of them) Like I said before, I don’t want this to be taken as more than what lead me to defining a new approach to the format. I want to state once again that Carlo's structure is complete, only it’s useful for specific instruments and applications, and difficultly applicable to other techniques and scenarios (and more lazy people like myself). Following Carlo’s mail, I’ve also completed the PDF I made to describe the structure I use in the HDF5_BLS library, I’m joining it to this email and pushing its code to GitHub<https://github.com/bio-brillouin/HDF5_BLS/blob/GUI_development/guides/Projec...>, feel free to edit it and criticize it at length (I feel like I deserve it after this email I really tried not to write). Best, Pierre Pierre Bouvet, PhD Post-doctoral Fellow Medical University Vienna Department of Anatomy and Cell Biology Wahringer Straße 13, 1090 Wien, Austria On 20/2/25, at 16:12, Robert Prevedel via Software <software@biobrillouin.org<mailto:software@biobrillouin.org>> wrote: Dear all, great to see all this discussion in this thread, and thanks to especially Pierre and Carlo for driving this forward. I’ve been following the various emails and arguments closely but simply didn’t have any time to chip in due to some important committments in the past days. I understand that there was a bit of a disagreement about what the focus of this effort should be, so maybe it just helps to highlight my lab's view on this (which I just discussed in depth with Carlo and Sebastian): Our original motivation was to come up with and define a common file-format, as we regard this to be key to unify the processing and visualization of Brillouin data by the community. In this respect, we would be happy to focus our efforts on defining this format and taking care of implementing the necessary processing/visualization software and interface that allows anyone to look at the data in the same way. We also regard this to be crucial if we want to standardize the reporting of Brillouin data from diverse setups/users/applications. Therefore, at this stage it would be extremely important to agree on the structure of the file format. Carlo has proposed a very well thought-through structure for this, and it would be great to get your concrete feedback on this, as I understand this hasn’t really happened yet. To aid in this, e.g. Pierre and/or Sal could try to convert or save your standard data into this structure, and report on any difficulties or ambiguities that he encounters. Based on this I agree it’s best to meet and discuss and iron this out as a next step, however it either has to be next week (ideally Fri?), or after March 12 as I am travelling back-to-back in the meantime. Of course feel free to also meet without me for more technical discussions if this speeds up things. Either way we could then also discuss the file format etc. for the ‘raw’ data that Pierre proposed (and which is indeed very valuable as well). Let me know your thoughts, and let’s keep up the great momentum and excitement on this work! Best, Robert -- Dr. Robert Prevedel Group Leader Cell Biology and Biophysics Unit European Molecular Biology Laboratory Meyerhofstr. 1 69117 Heidelberg, Germany Phone: +49 6221 387-8722 Email: robert.prevedel@embl.de<mailto:robert.prevedel@embl.de> http://www.prevedel.embl.de<http://www.prevedel.embl.de/> On 20.02.2025, at 10:29, Carlo Bevilacqua via Software <software@biobrillouin.org<mailto:software@biobrillouin.org>> wrote: Hi Kareem, thanks for the suggestion, I agree that it is a good (and easy) way to divide the tasks! Just to be clear, it is not that I don't see the need/advantage of providing some standard treatment going from raw data to standard spectra, it is just that was not my priority when proposing the idea of a unified file format. Regarding the file format, splitting the one containing the raw data and the treatments from the one containing the spectra and the image in a standard format might be a good solution and we can always merge them at a later stage. As for the file containing the "standard" spectra, it would be very helpful if you can give some feedback on the structure I originally proposed<https://github.com/prevedel-lab/Brillouin-standard-file/blob/main/docs/Bh5_f...>. Keep in mind that the idea is to be able to associate spectrum/spectra to each pixel in the image, in a way that is independent of the scanning strategy and underlaying technique. I tried to find a solution that works for the techniques I am aware of, considering the peculiarities (e.g. for most VIPA setups there is no absolute frequency axis but only relative to water). If am happy to discuss why I made some specific choices and if you see a better way to achieve the same or see things differently. Both the 3rd and the 4th of March work for me. Best, Carlo On Thu, Feb 20, 2025 at 02:50, Kareem Elsayad via Software <software@biobrillouin.org<mailto:software@biobrillouin.org>> wrote: Dear All, (and I guess especially Carlo & Pierre 😊) I understand both your (main) points concerning what this all should be, and I think this is actually perfect for dividing tasks. The format of the hf or bh5 file being where things meet and what needs to be agreed on. The thing with raw data is ofcourse that it is variable between instruments and labs, and the conversion to “standard spectra” that can then be fitted etc. is going to be unique (maybe even between experiments in same project). That said, asking people to create some complex file from their data that works with a developed software is also unlikely to get a following. So (the way I see it) there are basically two parts. Getting from raw data to h5 (or bh5) format which contains the spectra in standard format. And then the whole analysis part and visualization (GUI, pretty features, etc.). While the latter may get the spotlight, it obviously relies heavily on the former being done right. Given that there are numerous “standard” BLS setup implementations the development of software for getting from raw data to h5 I think makes sense, since the h5 will no doubt be cryptic, and creating a working h5 is not something everyone will want to program by themselves (it is not an insignificant step given we are also trying to ultimately cater to biologists). As such a software that generates the h5 files, with drag and drop features and entering system parameters, for different setups makes sense and will save many labs a headache if they don’t have a good programmer on hand. So I would suggest that Pierre & Sal lead the work on developing this, while Carlo & Sebastian lead the work on developing the analysis/interface-presentation part. This way things are nicely divided and we just need to agree on the h5 file that is transferred between the two. From the side of Pierre & Sal there could maybe also be a second h5 generated that contains all the raw data and details on how it was converted to the transferred h5 file (for complete transparency this could then also be reported in papers if people wish). These could exist as two separate programs with respective GUIs but also eventually combined to a single one. How does this sound to everyone? To clear up details and try assign tasks going forward how about a Zoom first week of March (I would be free Monday 3rd and Tue 4th after 1pm)? All the best, Kareem From: Carlo Bevilacqua via Software <software@biobrillouin.org<mailto:software@biobrillouin.org>> Reply to: Carlo Bevilacqua <carlo.bevilacqua@embl.de<mailto:carlo.bevilacqua@embl.de>> Date: Wednesday, 19. February 2025 at 20:43 To: Pierre Bouvet <pierre.bouvet@meduniwien.ac.at<mailto:pierre.bouvet@meduniwien.ac.at>> Cc: <software@biobrillouin.org<mailto:software@biobrillouin.org>> Subject: [Software] Re: [EXTERN] Re: Software manuscript / BLS microscopy Hi Pierre, I realized that we might have slightly different aims. For me the most important part of this project is to have a unified file format that can be read and visualized by a standard software. The file format you are proposing is not sufficient for that in my opinion. For example one of my main motivation was to have an interface where the user can see the reconstructed image, click on a pixel, see the corresponding spectrum to check its quality and maybe try different fitting functions; that would already not be possible with your structure because the software would have no notion on where the spectral data is stored and how to associate it to a specific pixel. I don't see the structure of the file to be too complex as an issue, as long as it is functional: we can always provide an API and/or a GUI that allow people to take their spectra and save them in whatever format we decide without bothering about understanding the actual structure, the same way you can work with HDF5 file without having any understanding on how the data is actually stored on the disk. My idea of making a webapp as a GUI follows directly from there. Typical case: I sent some data to a collaborator and they can just run the app in their browser and check if the outliers they see in the image are real or a bad spectra. Similarly if we make a common database of Brillouin spectra, people can explore it easily using the webapp. From what I understood, you are instead more interested in going from raw data to an actual spectrum, which I don't see so much as a priority because each lab has their own code already and the actual procedure would be different for each lab (apart from standard instruments like the FP). I am not saying this should not be part of the software but not as a priority and rather has a layer where people can easily implement their own code (of course we could already implement code for standard instruments). I think it would be good to cleary define what is our common aim now, so we are sure we are working in the same direction. Let me know if you agree or I misunderstood what is your idea. Best, Carlo On Wed, Feb 19, 2025 at 16:11, Pierre Bouvet <pierre.bouvet@meduniwien.ac.at<mailto:pierre.bouvet@meduniwien.ac.at>> wrote: Hi, I think you're trying to go too far too fast. The approach I present here<https://github.com/bio-brillouin/HDF5_BLS/blob/GUI_development/guides/Projec...> is intentionally simple, so that people can very quickly get to storing their data in a HDF5 file format together with the parameters they used to acquire them with minimal effort. The closest to what you did is therefore as follows: - data are datasets with no other restriction and they are stored in groups - each group can have a set of attribute proper to the data they are storing - attributes have a nomenclature imposed by a spreadsheet and are in the form of text - the default name of a data is the name of a raw data: “Raw_data”, other arrays can have whatever name they want (Shift_5GHz, Frequency, ...) - arrays and attributes are hierarchical, so they apply to their groups and all groups under it. This is the bare minimum to meet our needs, so we need to stop here in the definition of the format since it’s already enough to have the GUI working correctly, and therefore the first version of the unified software advertised. Of course we will have to refine things later on, but we don’t want to scare people off by presenting them a file description that for one might not match their measurements and that is extremely hard to conceptually understand. To make my point clearer, take your definition of the format for example: there are 3 different amplitude arrays in your description, two different shift arrays and width arrays that are of different dimension, then we have a calibration group on one side but a spectrometer characterization array in another group that is called “experiment_info”, that’s just too complicated to use correctly. On the other hand, placing your raw data “as is” in a group dedicated to this data is conceptually easy and straightforward. Where you are right, is that should we have hundreds of people using it, we might in a near future want to store abscissa, impulse responses, … in a standardized manner. In that case, the question falls down to either adding sub-groups or storing the data together with the measure. Both are fine and don’t really pose a problem for now, essentially because we are not trying to visualize the results but just trying to unify the way to get them. Now regarding Dash, if I understand correctly, it’s just a way to change the frontend you propose? If that’s so, why not, but then I don’t really see the benefits: if you really want to use dash, you can always embed it inside a Qt app. Also Dash being browser based, you will only have one window for the whole interface, which will be a pain to deal with if you want to use the interface to do everything the GUI is expected to do (inspect an H5 file, convert PSD, treat data, edit parameters, inspect a failed treatment, simulate results using setups with slight changes of parameters…). We agree that at one point when people receive an h5 file, it will be useful to have a web interface that can do what yours or Sal’s GUI do (seeing the mapping results together with the spectrum, eventually the time-domain signal) but here again, it’s going too far too soon: let’s first have a simple and reliable GUI that can convert data from any spectrometer to PSDs and treat them with a unified code. This is the real challenge, visualization and nomenclature of results are both important but secondary. Also keep in mind that, the frontend can easily be generated by anyone really, with Copilot or ChatGPT or whatever AI, but you can’t ask them to develop the function that will correctly read your data and convert them to a PSD nor treat the PSD. This is done on the backend and is the priority since the unification essentially happens there. Best, Pierre Pierre Bouvet, PhD Post-doctoral Fellow Medical University Vienna Department of Anatomy and Cell Biology Wahringer Straße 13, 1090 Wien, Austria On 19/2/25, at 13:21, Carlo Bevilacqua <carlo.bevilacqua@embl.de<mailto:carlo.bevilacqua@embl.de>> wrote: Hi Pierre, thanks for your reply. Regarding the file structure, what I am still not very clear about is what you define as Raw_data and data, how the actual spectra are stored and how the association to spatial coordinates and parameters is made. That's why I would really appreciate if you could make a document similar to what I did<https://github.com/prevedel-lab/Brillouin-standard-file/blob/main/docs/Bh5_f...>, where it is clear what each group should (or can) contain, what is the shape of each dataset, which attributes they have, etc... I am not saying that this should be the final structure of the file but I strongly believe that having it written in a structured way helps defining it and seeing potential issues. Regarding the webapp, it works by separating the frontend, which run in the browser and is responsible of running the GUI, and the backend which is doing the actual computation and that you can structure as you like with multithreading or any optimization you wish. The communication between frontend and backend is handled transparently by the framework, so you don't have to take care of it. When you run Dash locally a local server is created so the data stays on your computer and there is no issue with data transfer/privacy. If we want to move it to a server at a later stage, then you are right about the fact that data needs to be transferred to a server (although there might be solutions that allow you to still run the computation on the local browser, like WebAssembly<https://webassembly.org/>, but I think it is too complex to look into this at this stage). Regarding safety and privacy, the data will be stored on the server only for the time that the user is using the app and then deleted (of course we will need to make a disclaimer on the website about this). Regarding space I don't think people at the beginning will load their 1Tb dataset on the webapp but rather look at some small dataset of few tens of Gb; in that case 1Tb of server space is more than enough (remember that the file will be stored only for the time the user is using the app). If people really start to use the webapp and space becomes a limitation, I would be super happy to look into WebAssembly so that the data can be handled locally from the browser without transferring it to the server. To summarize I would agree that, at this stage, there might be no advantage of a webapp over a local GUI (and might actually be a bit more work to develop it). But, if this project really flies, the potential of a webapp is huge, especially in the context of the BioBrillouin society where we want to have a database of spectral data and the webapp could be used to explore that without downloading anything on your computer. My main point is that moving now to a webapp would not be too much work, but if we want to do it at a later stage it will basically entail re-writing everything from scratch. Let me know what are your thoughts about it. Best, Carlo On Wed, Feb 19, 2025 at 08:51, Pierre Bouvet <pierre.bouvet@meduniwien.ac.at<mailto:pierre.bouvet@meduniwien.ac.at>> wrote: Hi Carlo, You’re right, the format is still a little fuzzy. The main idea is to have a data-based hierarchy for storage: each data is stored in an individual group. From there, abscissa dependent on the data are stored in the same group and the treated data are stored in sub-groups. The names of the groups and sub-groups are fixed (Data_i), as is the name of the raw data (Raw_data) and abscissa (Abscissa_i). Also, the measure and spectrometer-dependent arguments have a defined nomenclature. To differentiate groups between them, we preferably attribute them a name as an attribute that is not used as an identifier, the identifier being either the path to the data/group from file root (Data_0/Data_42/Data_2/Raw_data) or potentially a hash value (not implemented). This I think allows all possible configurations, and using an hierarchical approach we can also pass common attributes and arrays (parameters of the spectrometer or abscissa arrays for example) on parent to reduce memory complexity. Now regarding the use of server-based GUI, first off, I’ve never used them so I’m just making supposition here but if the platform is able to treat data online, it will have to store the spectra somewhere in memory and it will not be local. My primary concerns with this approach is safety, particularly in terms of intellectual property protection, ethical considerations, and potential security vulnerabilities. Additionally, managing storage space will be a headache. Now, this doesn’t mean that we can’t have a server-based data plotter, or a server-based interface that does treatments locally but I don’t really see the benefits of this over a local software that can have multiple windows, which could at one point be multithreaded, and that could wrap c code to speed regressions for example (some of this might apply to Dash, I’m not super familiar with it). Now regarding memory complexity, having all the data we treat go on a server is a bad idea as it will raise the question of cost which will very rapidly become a real problem. Just an example: for a 100x100 map, I need 10Gb of memory (1Mo/point) with my setup (1To of archive storage is approximately 1euro/month) so this would get out of hands super fast assuming people use it. Now maybe there are solutions I don’t see for these problems and someone can take care of them but for me it’s just not worth the effort when having a local GUI solves all of these issues at once. But if you find a solution, then I’ll be happy to migrate to Dash, it won’t be fast to translate every feature but I can totally join you on the platform. Best, Pierre Pierre Bouvet, PhD Post-doctoral Fellow Medical University Vienna Department of Anatomy and Cell Biology Wahringer Straße 13, 1090 Wien, Austria On 18/2/25, at 20:26, Carlo Bevilacqua <carlo.bevilacqua@embl.de<mailto:carlo.bevilacqua@embl.de>> wrote: Hi Pierre, regarding the structure of the file, I agree that we should keep it simple. I am not suggesting to make it more complex, rather to have a document where we define it in a clear and structured way rather than as a general description, to make sure that we are all on the same page. I am saying this because, to be honest, I am not sure I fully understand how you are structuring the HDF5 and I think it is important to agree on this now, rather than finding at a later stage that we had different ideas. Ideally if the GUI should be part of a single application, we should write it using a unified framework. The reasons why, after considering it for a bit, I lean towards Dash rather than Qt are: * it can run in a web browser so it will be easy to eventually move it to a website, thus people can use it without installing it (which will hopefully help in promoting its use) * it is based on plotly<https://plotly.com/python/> which is a graphical library with very good plotting capabilites and highly customizable, that would make the data visualization easier/more appealing Let me know what you think about it and if you see any advantage of Qt over a web app which I am not considering. Also, if we agree that Dash might be a better option, would you consider migrating to Dash? It might not be too much work if most of the code you wrote is for data processing rather that for the GUI itself and I could help you with that. Alternatively one workaround is to have a QtWebEngine<https://doc.qt.io/qtforpython-6/overviews/qtwebengine-overview.html> in your Qt app and have the Dash app run inside that, but that would make only the Dash part portable to a server later on. Best, Carlo On Tue, Feb 18, 2025 at 10:24, Pierre Bouvet <pierre.bouvet@meduniwien.ac.at<mailto:pierre.bouvet@meduniwien.ac.at>> wrote: Hi, Thanks, More than merge them later, just keep them separate in the process and rather than trying to build "one code to do it all", build one library and GUI that encapsulate codes to do everything. Having a structure is a must but it needs to be kept as simple as possible else we’ll rapidly find situations where we need to change the structure. The middle ground I think is to force the use of hierarchies and impose nomenclatures where problem are expected to appear: each dataset has its own group, each group can encapsulate other groups, each parameter of a group applies to all its sub-groups if the subgroup does not change its value, each array of a group applies to all of its sub-groups if the sub-group does not redefine an array with same name, the names of the groups are held as parameters and their ID are managed by the software. For the Plotly interface, I don’t know how to integrate it to Qt but if you find a way to do it, that’s perfect with me :) My vision of the GUI is something that unifies the format and can then execute scripts on the data stored in this format. I have pushed the application of the GUI to my data up to the point where I can do the whole information extraction process from it (add data, convert to PSD, fit curves). I think this could be super interesting if we implement it for all techniques. I think we could formalize the project in milestones, in particular define the minimal denominator that will allow us to have the paper. The milestone I reached for my spectro encompasses the following points: - Being able to add data to the file easily (by dragging & dropping to the GUI) - Being able to assign properties to these data easily (again by dragging & dropping) - Being able to structure the added data in groups/folders/containers/however we want to call it - Making it easy for new data types to be loaded - Allowing data from same type but different structure to be added (e.g. .dat files) - Execute scripts on the data easily and allowing parameters of these scripts to be defined from the GUI (e.g. select a peak on a curve to fit this peak) - Make it easy to add scripts for treating or extracting PSD from raw data. - Allow the export of a Python code to access the data from the file (we cans see them as “break points” in the treatment pipeline) - Edit of properties inside the GUI In any case I think we could build a spec sheet for the project with what we want to have in it based on what we want to advertise in the paper. We can always add things later on but if we agree on a strict minimum to have the project advertised, then that will set its first milestone on which we’ll be able to build later on. Best, Pierre Pierre Bouvet, PhD Post-doctoral Fellow Medical University Vienna Department of Anatomy and Cell Biology Wahringer Straße 13, 1090 Wien, Austria On 17/2/25, at 14:53, Carlo Bevilacqua via Software <software@biobrillouin.org<mailto:software@biobrillouin.org>> wrote: Hi Pierre, hi Sal, thanks for sharing your thoughts about it. @Pierre I am very sorry that Ren passed away :( As far as I understood you are suggesting to work on the individual aspects separately and then merge them together at a later stage? I am fine with that but I still think it is very important to now agree on what should be in the file format we are defining, because that is kind of the core of the project and will affect a lot of the design choices. I am happy to start working on the GUI for data visualization. In my idea, it will be something similar to this<https://www.nature.com/articles/s41592-023-02054-z/figures/10> but written in dash<https://dash.plotly.com/>, so it is a web app that for now can run locally (so no transfer of data to an external server is required) but in the future can easily be uploaded to a website that people can just use without installing anything on their computer. The question is how much of the data processing should be possible to do (or trigger) from the same GUI? I think at least a drop down menu with different fitting functions should be there, so the user can quickly check the results on a spectrum from a specific point in the image. @Pierre how are you envisioning the GUI you are working on? As far as I understood it is mainly to get the raw data and save it to our HDF5 format with some treatment on it. One idea could be to have a shared list of features that we are implementing in the GUI as we work on it, to avoid having the same functionality duplicated (or worst inconsistent) between the GUI for generating our file format and the GUI for visualization. Let me know what you think about it. Best, Carlo On Mon, Feb 17, 2025 at 11:04, Pierre Bouvet via Software <software@biobrillouin.org<mailto:software@biobrillouin.org>> wrote: Hi everyone, Sorry for the delayed response, I just went through the loss of Ren (my dog) and wasn’t at all able to answer. First of, Sal, I am making progress and I should have everything you have made on your branch integrated to the GUI branch soon, at which point I will push everything to main. Regarding the project, I think I align with Sal: keep things as simple as possible. My approach was to divide everything in 3 mostly independent layers: - Store data in an organized file that anyone can use, and make it easy to do - Convert these data into something that has physical significance: a Power Spectrum Density - Extract information from this Power Spectrum Density Each layer has its own challenge but they are independent on the challenge of having people using it: personally, if I had someone come to me with a new software to play with my measures, I would most likely only look at it for 1 minute (or less depending who made it) with a lot of apprehension and then based on how simple it looks and how much I understood of it, use it or - what is most likely - discard it. This is why Project.pdf<https://github.com/bio-brillouin/HDF5_BLS/blob/GUI_development/guides/Projec...> is essentially meant to say: we put data arrays in groups and give them attributes written in text, but you can also create groups within groups to organize your data! I believe most of the people in the BioBrillouin society will have the same approach and before having something complex that can do a lot, I think it’s best to have something simple that can just unify the format (which in itself is a lot) and that people can use right away with a minimal impact on their own individual pipelines for data processing. To be honest, I don’t think people will blindly trust our software at first to treat their data, but they will most likely use it at first to organize their raw spectra, and maybe add their own treated data if they are feeling particularly adventurous. But that is not a problem as long as we start a movement. From there yes, we can complexity and create custom file architectures but that is already too complex I think for this first project. If we can all just import our data to the wrapper and specify their attributes, this will already be a success. Then for the paper, if we can all add a custom code to treat these data to obtain a PSD, I think this will be enough. As I said, the current API already allows you to add your data in a variety of format, so it’s just a question of developing the PSD conversion before having something we can publish (and then tell people to use). A few extra points: - Working with my setup, I realized if the user could choose between different algorithms to treat their own data, it would make the overall project much more usable (if an algorithm bugs for whatever reason, you can use another one) so I created 2 bottle necks in the form of functions (for PSD conversion and treatment) that would inspect modules dedicated to either PSD conversion or treatment, and list existing functions. It’s in between classical and modular programming but it makes the development of new PSD conversion code and treatment way way easier - The GUI is developed using oriented-object programming. Therefore I have already made some low-level choices that kind of impact all the GUI. I’m not saying they are the best choices, I’m just saying that they work, so if you want to work on the GUI, I would either recommend getting familiar with these choices, or making sure that all the functionalities are preserved, particularly the ones that are invisible (logging of treatment steps, treatment errors…) I’ll try merging the branches on Git asap and will definitely send you all an email when it’s done :) Best, Pierre Pierre Bouvet, PhD Post-doctoral Fellow Medical University Vienna Department of Anatomy and Cell Biology Wahringer Straße 13, 1090 Wien, Austria On 14/2/25, at 19:36, Sal La Cavera Iii via Software <software@biobrillouin.org<mailto:software@biobrillouin.org>> wrote: Hi all, I agree with the things enumerated and points made by Kareem/Carlo! I guess I would advocate for starting from a position of simplicity. We probably don't want to get weighed down by trying to include a bunch of bells and whistles from the start as these can be easily added once there is a minimally viable stable product. As long as data can be loaded to local memory, then treated in various (initially simple) ways through the GUI (and maybe maintain non-GUI compatibility for command-line warriors like myself), then the bh5 formatting stuff can be sorted on the back end? I definitely agree with Carlo's structure set out in the file format document; but all of that data will be floating around the memory in some shape or form and just needs to be wrapped up and packaged (according to Carlo's structure e.g.) when the user is happy and presses the "generate h5 filestore" etc. (?) Definitely agree with the recommendation to create the alpha using mainly requirements that our 3 labs would find useful (import filetypes, treatments, etc), and then we can add on more universal functionality second / get some beta testers in from other labs etc. I'm able to support on whatever jobs need doing and am free to meet in the beginning of March like you mentioned Kareem. Hope you guys have a nice weekend, Cheers, Sal --------------------------------------------------------------- Salvatore La Cavera III Royal Academy of Engineering Research Fellow Nottingham Research Fellow Optics and Photonics Group University of Nottingham Email: salvatore.lacaveraiii@nottingham.ac.uk<mailto:salvatore.lacaveraiii@nottingham.ac.uk> ORCID iD: 0000-0003-0210-3102 <Outlook-tygjxucs.png><https://outlook.office.com/bookwithme/user/6a3f960a8e89429cb6fc693c01d10119@...> Book a Coffee and Research chat with me! ________________________________ From: Carlo Bevilacqua via Software <software@biobrillouin.org<mailto:software@biobrillouin.org>> Sent: 12 February 2025 13:31 To: Kareem Elsayad <kareem.elsayad@meduniwien.ac.at<mailto:kareem.elsayad@meduniwien.ac.at>> Cc: sebastian.hambura@embl.de<mailto:sebastian.hambura@embl.de> <sebastian.hambura@embl.de<mailto:sebastian.hambura@embl.de>>; software@biobrillouin.org<mailto:software@biobrillouin.org> <software@biobrillouin.org<mailto:software@biobrillouin.org>> Subject: [Software] Re: Software manuscript / BLS microscopy You don't often get email from software@biobrillouin.org<mailto:software@biobrillouin.org>. Learn why this is important<https://aka.ms/LearnAboutSenderIdentification> Hi Kareem, thanks for restarting this and sorry for my silence, I just came back from US and was planning to start working on this again. Could you also add Sebastian (in CC) to the mailing list? As you outlined, I would split the project into two parts: 1) getting from the raw data to some standard "processed' spectra and 2) do data analysis/visualization on that. For the second part the way I envision it is: 1. the most updated definition of the file format from Pierre is this one<https://github.com/bio-brillouin/HDF5_BLS/blob/GUI_development/guides/Projec...>, correct? In addition to this document I think it would be good to have a more structured description of the file (like this<https://github.com/prevedel-lab/Brillouin-standard-file/blob/main/docs/Bh5_f...>), where each field is clearly defined in terms of data type and dimensions. Sebastian was also suggesting that the document should contain the reasoning behind each specific choice in the specs and also things that we considered but decided had some issues (so in future we can look back at it). I still believe that the file format should contain the "processed" spectra (i.e. after FT and baseline subtraction for impulsive, or after taking a line profile and possibly linearization with VIPA,...) so we can apply standard data processing or visualization which is independent on the actual underlaying technique (e.g. VIPA, FP, stimulated, time domain, ...) 2. agree on an API to read the data from our file format (most likely a Python class). For that we should: 1) decide on which information is important to extract (spectral information, spatial coordinates, hyper-parameters, metadata,...) 2) implement an interface to read the data (e.g. readSpectrumAtIndex(...), readImage(...), ...) 3. build a GUI that use the previously defined API to show and process the data. I would say that, once we have a very solid description of the file format as in step 1, step 2 will come naturally and we can divide the actual implementation between us. Step 3 can also easily be implemented and divided between us once we have an API (and I am happy to work on the GUI myself). The first half of the project is the trickiest and I know Pierre has already done a lot of work in that direction. We should definitely agree on which extent we can define a standard to store the raw data, given the variability between labs, (and probably we should do it for common techniques like FP or VIPA) and how to implement the treatments, leaving to possibility to load some custom code in the pipeline to do the conversion. Let me know what you all think about this. If you agree I would start by making a document which clearly defines the file format in a structured way (as in my step 1 before). @Pierre could you write a new document or modify the document I originally made<https://github.com/prevedel-lab/Brillouin-standard-file/blob/main/docs/Bh5_f...> to reflect the latest structure you implemented for the file format? The metadata can still be defined in a separated excel sheet, as long as the data type and format is well defined there. Best regards, Carlo On Wed, Feb 12, 2025 at 02:19, Kareem Elsayad via Software <software@biobrillouin.org<mailto:software@biobrillouin.org>> wrote: Hi Robert, Carlo, Sal, Pierre, Think it would be good to follow up on software project. Pierre has made some progress here and would be good to try and define tasks a little bit clearer to make progress… There is always the potential issue of having “too many cooks in the kitchen” (that have different recipes for same thing) to move forward efficiently, something that I noticed can get quite confusing/frustrating when writing software together with people. So would be good to clearly assign tasks. I talked to Pierre today and he would be happy to integrate things in framework we have to try tie things together. What would foremost be needed would be ways of treating data, meaning code that takes a raw spectral image and meta-data and converts it into “standard” format (spectral representation) that can then be fitted. Then also “plugins” that serve a specific purpose in the analysis/rendering that can be included in framework. The way I see it (and please comment if you see differently), there are ~4 steps here: 1. Take raw data (in .tif,, .dat, txt, etc. format) and meta data (in .cvs, xlsx, .dat, .txt, etc.) and render a standard spectral presentation. Also take provided instrument response in one of these formats and extract key parameters from this 2. Fit the data with drop-down menu list of functions, that will include different functional dependences and functions corrected for instrument response. 3. Generate/display a visual representation of results (frequency shift(s) and linewidth(s)), that is ideally interactive to some extent (and maybe has some funky features like looking at spectra at different points. These can be spatial maps and/or evolution with some other parameter (time, temperature, angle, etc.). Also be able to display maps of relative peak intensities in case of multiple peak fits, and whatever else useful you can think of. 4. Extract “mechanical” parameters given assigned refractive indices and densities I think the idea of fitting modified functions (e.g. corrected based on instrument response) vs. deconvolving spectra makes more sense (as can account for more complex corrections due to non-optical anomalies in future –ultimately even functional variations in vicinity of e.g. phase transitions). It is also less error prone, as systematically doing decon with non-ideal registration data can really throw you off the cliff, so to speak. My understanding is that we kind of agreed on initial meta-data reporting format. Getting from 1 to 2 will no doubt be most challenging as it is very instrument specific. So instructions will need to be written for different BLS implementations. This is a huge project if we want it to be all inclusive.. so I would suggest to focus on making it work for just a couple of modalities first would be good (e.g. crossed VIPA, time-resolved, anisotropy, and maybe some time or temperature course of one of these). Extensions should then be more easy to navigate. At one point think would be good to involve SBS specific considerations also. Think would be good to discuss a while per email to gather thoughts and opinions (and already start to share codes), and then plan a meeting beginning of March -- how does first week of March look for everyone? I created this mailing list (software@biobrillouin.org<mailto:software@biobrillouin.org>) we can use for discussion. You should all be able to post to (and it makes it easier if we bring anyone else in along the way). At moment on this mailing list is Robert, Carlo, Sal, Pierre and myself. Let me know if I should add anyone. All the best, Kareem This message and any attachment are intended solely for the addressee and may contain confidential information. If you have received this message in error, please contact the sender and delete the email and attachment. Any views or opinions expressed by the author of this email do not necessarily reflect the views of the University of Nottingham. Email communications with the University of Nottingham may be monitored where permitted by law. _______________________________________________ Software mailing list -- software@biobrillouin.org<mailto:software@biobrillouin.org> To unsubscribe send an email to software-leave@biobrillouin.org<mailto:software-leave@biobrillouin.org> _______________________________________________ Software mailing list -- software@biobrillouin.org<mailto:software@biobrillouin.org> To unsubscribe send an email to software-leave@biobrillouin.org<mailto:software-leave@biobrillouin.org> _______________________________________________ Software mailing list -- software@biobrillouin.org<mailto:software@biobrillouin.org> To unsubscribe send an email to software-leave@biobrillouin.org<mailto:software-leave@biobrillouin.org> _______________________________________________ Software mailing list -- software@biobrillouin.org<mailto:software@biobrillouin.org> To unsubscribe send an email to software-leave@biobrillouin.org<mailto:software-leave@biobrillouin.org> _______________________________________________ Software mailing list -- software@biobrillouin.org<mailto:software@biobrillouin.org> To unsubscribe send an email to software-leave@biobrillouin.org<mailto:software-leave@biobrillouin.org> _______________________________________________ Software mailing list -- software@biobrillouin.org<mailto:software@biobrillouin.org> To unsubscribe send an email to software-leave@biobrillouin.org<mailto:software-leave@biobrillouin.org> _______________________________________________ Software mailing list -- software@biobrillouin.org<mailto:software@biobrillouin.org> To unsubscribe send an email to software-leave@biobrillouin.org<mailto:software-leave@biobrillouin.org> _______________________________________________ Software mailing list -- software@biobrillouin.org<mailto:software@biobrillouin.org> To unsubscribe send an email to software-leave@biobrillouin.org<mailto:software-leave@biobrillouin.org> This message and any attachment are intended solely for the addressee and may contain confidential information. If you have received this message in error, please contact the sender and delete the email and attachment. Any views or opinions expressed by the author of this email do not necessarily reflect the views of the University of Nottingham. Email communications with the University of Nottingham may be monitored where permitted by law.
Hi guys, Continuing from my previous email, here's a quick example script comparing the two / converting between with dummy data. Obviously this has group names/number of sub-groups hardcoded in, but this can be done dynamically fairly easily I think. Hope you have a nice weekend, Sal --------------------------------------------------------------- Salvatore La Cavera III Royal Academy of Engineering Research Fellow Nottingham Research Fellow Optics and Photonics Group University of Nottingham Email: salvatore.lacaveraiii@nottingham.ac.uk<mailto:salvatore.lacaveraiii@nottingham.ac.uk> ORCID iD: 0000-0003-0210-3102 [cid:319991a5-dfd3-4c8b-a77d-bfbfa17ef26c]<https://outlook.office.com/bookwithme/user/6a3f960a8e89429cb6fc693c01d10119@...> Book a Coffee and Research chat with me! ________________________________ From: Sal La Cavera Iii via Software <software@biobrillouin.org> Sent: 06 March 2025 16:06 To: software@biobrillouin.org <software@biobrillouin.org>; Carlo Bevilacqua <carlo.bevilacqua@embl.de> Subject: [Software] Re: [EXTERN] Re: Software manuscript / BLS microscopy Hi everyone, First off I just want to acknowledge the hard work and thoughtful approaches coming from both sides! I think this is one of those situations where there's no clearcut perfect/ideal way to do it. Yes perhaps certain approaches will be most compatible with certain visions / anticipated use-cases. Right now I see this as not " a battle for supremacy of the future BLS signal processing pipeline" but more of an opportunity to "integrate over different opinions which by definition will result in the most generalised useful solution for the future community." With that being said, I think we're getting a bit stuck in the mud / failure to launch / paralysis by over-analysis (insert whatever idiom you'd like here). I appreciate that we want to get this right from the very beginning so that we're united with a clear vision/future direction, and to avoid backtracking/redoing things as much as possible. I also appreciate that I do not have a horse in this race compared to you guys. Our lab uses custom matlab code, and we only consider ourselves in how it was developed. You guys on the other hand, use similar equipment / data sets / signal processing pipelines. But we're at the point where each lab wants "their way" of doing things to be adopted by the world (and leads to impasses and entrenchment). I digress... I haven't worked with hdf5 before, so my expertise is somewhat limited, but from what I can gather based on reading up on things / the points made in your debates there are some pro's/con's for each approach: [cid:d82e47c3-43aa-4c30-a369-f87a1af762fd] (I may be wrong on some of the above, feel free to ignore/correct etc) If we're expecting absolutely MASSIVE experiments to be pumped through the system, then perhaps the abstraction offered by the hierarchical approach is preferred and the additional complexity is justified. If we're instead appealing to the average user that just wants to store a couple imaging results and visualise, then staying lean-and-mean with the flat approach seems easiest. Historically our lab tends towards the flatter side of things, but this is potentially because we haven't done enormous enormous multivariate studies yet. And so in terms of future use cases for this project wrt our time domain lab, the multivariate experimental data organisation is most useful for us compared to just visualising the data (we already do that routinely with interactive plots/maps). Perhaps the flat-to-hierarchical (and vice-versa) conversion functionality is the way to go? Yes it will be more work, but it will give the Nat Meth/BLS community a better/tuneable product. So the user can choose which structure type they want in their h5 file. But I think we definitely want the plotting functionality to be dependent on a single structure (e.g. flat). So the conversion function will play a functional role in ensuring compatibility with the plotting (also hdf5 files potentially not generated by our project). Otherwise, if we want the debate to continue, perhaps both sides should prepare a mock h5 file with the different structures? E.g. 8 data sets with 2 Specimens with 2 temperatures each and 2 mutations each? (even if it's just the same data copied over a bunch of times). Then we can send the file around, have a play, compare scripts, etc. Happy to support no matter which path is chosen, and will have availability to meet biweekly as discussed! Cheers everyone, Sal --------------------------------------------------------------- Salvatore La Cavera III Royal Academy of Engineering Research Fellow Nottingham Research Fellow Optics and Photonics Group University of Nottingham Email: salvatore.lacaveraiii@nottingham.ac.uk<mailto:salvatore.lacaveraiii@nottingham.ac.uk> ORCID iD: 0000-0003-0210-3102 [cid:ade5ba43-1fd8-4857-8e32-c3c2a25897bc]<https://outlook.office.com/bookwithme/user/6a3f960a8e89429cb6fc693c01d10119@...> Book a Coffee and Research chat with me! ________________________________ From: Carlo Bevilacqua via Software <software@biobrillouin.org> Sent: 05 March 2025 15:58 To: software@biobrillouin.org <software@biobrillouin.org> Subject: [Software] Re: [EXTERN] Re: Software manuscript / BLS microscopy Hi Kareem, thanks for great summary. I largely agree with the way you described what I have in mind, I would only add two points: * In the case of discrete parameters they can be stored as "fake" timepoints, as you mentioned. I think this is fair, because anyways they will be in practice acquired at different times (one need to change the sample, temperature, etc...). In that case the only difference between my and Pierre's approach is that Pierre would store them in a hierarchical structure and I would do it in a flatten structure (which I believe is always possible because the hierarchy in Pierre's case is not given by some parent/children relationship, but each leaf of the tree is uniquely defined by a set of parameters) * in the case of angularly resolved measurements, my structure actually allow these type of measurements to be stored in a single file, (even in a single dataset - see the description of ' /data{n}/PSD<https://github.com/bio-brillouin/HDF5_BLS/blob/main/Bh5_file_spec.md>' ); I think this is a good way to store spectra acquired simultaneously, where you have many spectra acquired always in the same condition (clear example is the angularly-resolved VIPA) and one can add an arbitrary number of such "parameters" by adding more dimensions Now, going to the reasons why I don't think Pierre's approach would work for what I am trying to do: * he gives complete flexibility to the dimensions of each dataset, which has the advantage of storing arbitrary data but the drawback of not knowing what each dimension corresponds to (so how to treat/visualize them with a standard software?); also, I want to highlight that in the format I am proposing people could add as many dataset/group to the file as they want: this will give them complete flexibility on what to store in the file without breaking the compatibility with the standard (the software will just ignore the data that is not part of the standard); I don't see the reason of forcing people to add data non required by the standard in a structured way, if anyway a software could not make any use of that, not knowing what that data means * there is no clear definition on how a spatial mapping is stored, so it is hard to do the visualization I mentioned in my previous email where I can show the image of the sample My counter-proposal (mostly aligning with what you proposed) is that, since it is difficult to agree on the link between the two projects and, as you pointed out, they are mostly independent, I would propose that for now we work to two completely separated projects. Currently Robert is away for more than one week, but once he will back we can discuss if strategically it makes sense to try to merge them later or keep them separated. Let me know if you agree with this. Best, Carlo On Wed, Mar 5, 2025 at 10:31, Kareem Elsayad via Software <software@biobrillouin.org> wrote: Dear All, Having read through the emails finally, here is what I gather. Keeping in mind that I may be misunderstanding things (correct me), this is how I would suggest we proceed. (Now it’s my go to write a long email 😊) Carlo’s vision appears to be to have (conceptually) the equivalent of a .tiff file used in e.g. fluorescence confocal microscopy that represents one particular measurement. this could be data (in the form of PSD for each voxel) pertaining to a spatial 2D or 3D scan/image. It may also be a time course 2D or 3D set of images (as is also possible in .tiff). The file also contains metadata (objective, laser wavelength/power, etc. used – basically the stuff in our consensus reporting xls). In addition it also (optionally) contains the Instrument Response Function (IRF). Potentially the latter is saved in the form of a control spectra of a known (indicated) material, but I would say more ideally it is stored as an IRF as this is more universal (between techniques), requires no additional info (measured sample), and is easier and faster to work with on analysis/fitting side (saves additional extraction of IRF which will be technique dependent). Now this is all well and good and I am fine with this. The downside is that it is limited to wanting to look at images /volume-images and (optionally) how they evolve over time. If you want to see how something changes with temperature or any other variable, or e.g. between two mutants, you would just save each as a separate file. This is usually what biologists are used to. Sure it might not be the most memory efficient (you would have to write all the metadata in each) but I don’t see that as an issue since this doesn’t take up too much memory (and we’ve become a lot better at working with large files than we were say 10 years ago). The downside comes when you want to look at say how the BLS spectra at a single position or a collection of voxels changes as you tune some parameter. Maybe for static maps you could “fake it” and save as a time series, which software recognizes? However, if you have 50 different BLS spectra for each voxel in a 3D space in a time series measurement (from e.g. 50 different angles) you have an extra degrees of freedom …would one need 50 files, one for each angle bin?. So it’s not necessarily different experiments, but just in this case one additional degree of freedom. Given dispersion only needs to be in one direction and we have two degrees of freedom on our camera, one can envision this extra degree of freedom being used for various other things (I.e not only spatial or angular multiplexing). Then there is maybe some physical-chemist-biologist who wants to say measure the change in linewidth as he/she induces a phase transition by tuning one thing or another at a single point (or few points). He/she is probably fine fitting each spectra with their own code as they scan e.g. the temperature across the transition. The question is do we also want to cater for him/her or are we just purely for BLS imaging? Pierre’s vision appears to be to have maximum flexibility in this regard, with a structure that is general enough to optimally accommodate for saving data for an entire multi-variable experiment. Namely if you do an angle-resolved map of a cell over time and repeat the experiments at different temperatures, and then say also for different mutants, you can store all that data in a single file. I think this is a very noble and cool idea, except that in practice you will (biology being biology) need to do this on >10 cells (in each case) to get anything statistically significant. You can in principle put that too into the same file, but now we are talking about firstly increased complexity (which I guess can theoretically be overcome since to most people this is a black box anyhow) but ultimately doing/reporting science in a way biologists – or indeed most scientists - are not used to (so it would be trend-setting in that sense – having an entire study in a single file, with statistics and so forth done not separately and differently between labs). This is certainly not a conceptually a crazy idea, and probably even the future of science (but maybe something best exploring firstly in a larger consortium with standard fluorescence, EM etc. techniques if it hasn’t already – which it probably has). It also makes things more amiable to be analyzed and compared (between different studies) by e.g. AI in a multi-variate/dimensional way (maybe should propose to Zuckerberg?). I digress. I think here it is worth keeping things not just as simple but also as basic as possible. With Nat Meth (assuming they consider interesting enough) the focus is biologists in their current state of mind, and with their current habits, and that is kind of what we need to cater for when trying to sell an exotic technique to the masses. So, following my rambling, here is how I think we should proceed, as we need to move forward and not dwell on this longer. As mentioned in previous emails, this is basically two separate projects (of equal importance) that just need to agree on their meeting point in the middle. It is ideal that the goals are already more or less defined between getting raw data to a “standard” format (Vienna/Nottingham side), and “fitting/presenting” data (Heidelberg side). Not reaching a general consensus on the h5 format I would suggest that Carlo/Sebastian work with their file format and Pierre/Sal with theirs and we figure how to patch together after (see below). It maybe would be good to clarify some of the lingo first to avoid misunderstandings. (Maybe the below has been defined, in which case ignore and see it as a reflection of my naivety)… Firstly, “treatment”. Is this “just” the step from getting from the raw acquired spectra to an agreed upon, universally applicable, presentation of the PDS for each voxel (excl. any decon., since we fit IRF modified Lorentzians/DHOs) which can be fed into the same fitting procedure(s)? This would I guess only include one peak (e.g. anti-Stokes) since in time domain that’s all you’ll get out anyhow. Does it refer to the entire construction of the h5 file? Does it include the fitting and extraction of the frequency shifts and linewidths? the calculation of viscoelastic moduli (if one provides auxiliary parameters like refractive index and density)? Secondly, and related, in dividing tasks it is also not clear to me if the “standard” h5 file contains also the fitted values for frequency shift/linewidth or just the raw data. From the division of work load my understanding is that the fitting will be done in Carlo/Sebastian’s code (?). Will the fitted values then also be included in the h5 file or not? (i.e. additionally written into it after it was generated from Pierre’s codes). There is no point of everybody doing their own fitting code, which would kinda miss the point of having some universality/standard? I guess to me it is unclear where the division of labor is. To keep things simple I would suggest that Pierre’s code simply generates the standard h5 file (unfitted, but in a standard PSD presentation for each voxel, and includes optional IRF), and then Carlo/Sebastian’s codes do the fitting and resaves the fitting parameters into some empty/assigned space in that same h5 file. If the h5 file already contains fitted paramaters (from previously running Carlo/Sebastian’s code) then these can directly be displayed (or one can chose to fit again and overwrite). How does this sound to everyone? This does not address the contention of the file format. The solution proposed in our last Zoom meeting was creating a code that converts one (Pierre’s) file format to the other (Carlo’s). This is I think in light of the recent emails I think the only reasonable solution, and probably maybe even a great solution, considering that Pierre’s file format may contain multiple additional information (entire experiments) and the conversion between the two can allow one to e.g. pick out specific ones if and as relevant. It doesn’t have to be elaborate at this point, but it can have the potential to be for multi-variate data down the line. So this divide is actually a plus as it keeps door open for more complex data sets, without them being a neccesity. Would it maybe be possible for Pierre and Carlo to write this conversion program together as a first step? Just needs to be rudimentary so that individual parties can start working on their sides independently asap? This code can then in the end be tacked on to one or the other codes developed by the two parties, depending on what we decide to be the standard reporting format. It is also not crazy to consider in the end two file formats that can be accepted, one maybe called “measurement”-file format, and one “experiment”-file format, that the user selects between when importing? As such if this conversion code is in Pierre’s code one may have the option to export as one of these two formats. If it is also in Carlo’s code, one has option to read either format. This way one has option of saving as and reading out from both a single image/series of images (as is normally done in bioimaging) as well as an entire experiment as one pleases and everybody is happy 😊 How does this sound? I hope the above is a suitable way to move forward, but ofcourse let me know your thoughts and happy with alternatives… Regarding the bi-weekly meetings suggested by Robert. I still think this makes sense… Ofcourse not everybody needs to attend all if busy, but having this time slot earmarked in calender for when it becomes necessary might be nice. I will send out an email with dates/invite info… All the best, and hope this moves forward from here!!:) Kareem From: Pierre Bouvet via Software <software@biobrillouin.org<mailto:software@biobrillouin.org>> Reply to: Pierre Bouvet <pierre.bouvet@meduniwien.ac.at<mailto:pierre.bouvet@meduniwien.ac.at>> Date: Tuesday, 4. March 2025 at 11:20 To: Carlo Bevilacqua <carlo.bevilacqua@embl.de<mailto:carlo.bevilacqua@embl.de>> Cc: "software@biobrillouin.org<mailto:software@biobrillouin.org>" <software@biobrillouin.org<mailto:software@biobrillouin.org>> Subject: [Software] Re: [EXTERN] Re: Software manuscript / BLS microscopy Hi everyone, The spec sheet I defined for the format is there<https://github.com/bio-brillouin/HDF5_BLS/blob/main/guides/SpecSheet/SpecShe...> (I thought I had pushed it already but it seems not). To make it simple, my aim is to have a simple way (emphasis on simple) to store any kind of data obtained with as many different setups as possible, follow a unified pipeline<https://github.com/bio-brillouin/HDF5_BLS/blob/main/guides/Pipeline/Pipeline...> and allow a unified treatment of the data. From this spec sheet I built this structure<https://github.com/bio-brillouin/HDF5_BLS/blob/main/guides/Project/Project.p...> which I’ve been using for a few months now and that seems robust enough, in fact what blocked me for adapting it to time-domain was not the structure but the code I already had written to implement it. Once again, visualizing data is not the priority for me, because I believe the main problem in the community today is that we don’t have a single, robust and well-characterized way of extracting information from a PSD. Best, Pierre Pierre Bouvet, PhD Post-doctoral Fellow Medical University Vienna Department of Anatomy and Cell Biology Wahringer Straße 13, 1090 Wien, Austria On 3/3/25, at 21:32, Carlo Bevilacqua via Software <software@biobrillouin.org<mailto:software@biobrillouin.org>> wrote: Hi all, we are still trying to find an agreement with Pierre but I think that, a part from the technicalities that we can probably figure out between ourselves, we have a different view on the aims of the file format and the project in general. Although I agree that for now we could work with separate files and convert between them, eventually we need to agree on a format to propose as a standard and I want to avoid postponing the decision (at least for the general structure, of course minor details can change during the process). Otherwise I am afraid that, once most of the code is written, it will be hard to unify it and this will make the decision even more difficult. What I see as the main points of this project are: * to have some sort of TIFF for Brillouin data, with the main aim of storing images (i.e. spatial maps of a sample) together with the spectral data that it is used to generate them and the relevant metadata and calibration data * while allowing the possibility of storing single spectra or spectra acquired in different conditions in multiple samples (i.e. having a whole study in a single file), I don't see this as a determinant in defining the file. That is because the same result can be achieved by having multiple file with a clear naming convention (e.g. ConcentrationX_TemperatureY_SampleN), which is commonly done in microscopy and I feel it is a "cleaner" solution than having everything in a single file * the analysis part of the software should be able to perform standard Brillouin analysis (i.e. fit the spectra with different functions that the user can select) but possibly more advanced stuff (like PCA or non-negative matrix factorisation) * the visualization part would be similar to this<https://www.nature.com/articles/s41592-023-02054-z/figures/10>, where the user can click on a pixel and see the corresponding spectrum (possibly selecting different fit functions and see the result on the fly). If multiple images are stored in the file, some dropdown menus would appear to select the relevant parameters, which identify a single image. I discussed about these points with Robert and Sebastian and we agree on them. The structure of the file I proposed (and refined with input from Pierre and Sebastian) is designed with these aims in mind. @Pierre, can you please list your aims? I don't want write what I understood from you because I might misrapresent them. It would be good to have your feedback on what you consider to be the main aims and priorities, so we can have the last iteration on the format, as we'd like to proceed with the actual coding. Best regards, Carlo On Fri, Feb 28, 2025 at 19:01, Pierre Bouvet via Software <software@biobrillouin.org<mailto:software@biobrillouin.org>> wrote: Hi everyone :) As I told you during the meeting, I just pushed everything on Git and merged with main. You can normally clone the project and test it on your machines by running the HDF5_BLS_GUI/main.py script from base repository. If it doesn’t work, it might be an os compatibility issue on the paths, but I’m hopeful I won’t have to patch that ^^ You can quickly test it with the test data provided in tests/test_data, this will however only allow you to do the most basic things (import data and edit parameters). A first version of the parameter spreadsheet (the child of the Consensus paper) is located in “spreadsheets”. You can open this file and edit it and then export it as csv. The exported csv can be dragged and dropped into the right frame of the GUI to update all the parameters of the group or dataset that you have selected in the left frame. Naturally, this GUI is built on the hierarchical structure I propose for the HDF5 file (described in guides/Project/Project.pdf), note however that it can be adjusted to a linear approach (cf discussion of today) so see this more as a first “usability” test of a - relatively - stable version, and a way for you to make a list of everything that is wrong with the software. @ Sal: I’ll soon have the code to convert your data to PSD & frequency arrays, but I’m confident you can already use the format to store your spectra as time arrays (with abscissa) from your .dat and .con files (and .. Note that because I don’t have order of magnitudes for the parameters you use, I could only test the GUI and its usability. In case you are looking for the code for importing your data, it’s in HDF5_BLS/load_formats/load_dat.py in the “load_dat_TimeDomain” function Last thing: I located the developer guide I couldn’t find during the meeting and placed it back where I thought it was (guides/DeveloperGuide/ModuleDeveloperGuide.pdf). I’m underlining this document because this is maybe the most important one of the whole project since it’s where people that want to collaborate after it’s made public will go to. The goal of this document is to take people by the hand and help them making their additions compatible with the whole project. For now this document only talks about adding data. Best, Pierre Pierre Bouvet, PhD Post-doctoral Fellow Medical University Vienna Department of Anatomy and Cell Biology Wahringer Straße 13, 1090 Wien, Austria On 28/2/25, at 14:18, Carlo Bevilacqua via Software <software@biobrillouin.org<mailto:software@biobrillouin.org>> wrote: Hi all, I made a file describing the file format, you can find it here<https://github.com/bio-brillouin/HDF5_BLS/blob/main/Bh5_file_spec.md>. I think that attributes are easy to add and names of groups/datasets can be changed (if they are unclear now), so these are details that we don't need to discuss now. What I find most important to agree on now is the general structure. In that sense that are still some points under discussion between me and Pierre, but hopefully we can iron them out during the meeting. Talk to you in a bit, Carlo On Wed, Feb 26, 2025 at 23:56, Kareem Elsayad <kareem.elsayad@meduniwien.ac.at<mailto:kareem.elsayad@meduniwien.ac.at>> wrote: Hi Carlo, Sounds great! Yes, Fri 28th @3pm still works for me. If it works for others, here is Zoom we can use: https://us02web.zoom.us/j/5191046969?pwd=alpzaldoZEd3N2ZEQ0hYZU1RR1dOdz09 Meeting ID: 519 104 6969 Passcode: jY3zH8 All the best, kareem From: Carlo Bevilacqua via Software <software@biobrillouin.org<mailto:software@biobrillouin.org>> Reply to: Carlo Bevilacqua <carlo.bevilacqua@embl.de<mailto:carlo.bevilacqua@embl.de>> Date: Wednesday, 26. February 2025 at 20:43 To: Kareem Elsayad <kareem.elsayad@meduniwien.ac.at<mailto:kareem.elsayad@meduniwien.ac.at>> Cc: "software@biobrillouin.org<mailto:software@biobrillouin.org>" <software@biobrillouin.org<mailto:software@biobrillouin.org>> Subject: [Software] Re: [EXTERN] Re: Software manuscript / BLS microscopy Hi Kareem, thank you for your email. We are discussing with Pierre about the details of the file format and hopefully by our next meeting we will have agreed on a file format and we can divide the tasks. If it is still an option, Friday 28th at 3pm works for me. Best regards, Carlo On Mon, Feb 24, 2025 at 03:17, Kareem Elsayad <kareem.elsayad@meduniwien.ac.at<mailto:kareem.elsayad@meduniwien.ac.at>> wrote: Dear All, I (and Robert) were hoping there would be some consensus on this h5 file format. Let us do a Zoom on Fri 28th Feb at 15:00? A couple of points pertaining to arguments… Firstly, the precise structure is not worth getting into big arguments or fuss about…as long as it contains all the information needed for the analysis/representation, and all parties can work with (able to write and read knowing what is what), it ultimately doesn’t matter. In my opinion better put more (optional) stuff in if that is issue, and make it as inclusive as possible. In the end this does not need to be read by analysis/representation side, and when we go through we can decide if and what needs to be stripped. It is after all the “black box” between doing the experiment and having your final plots/images. Take a look at say a Zeiss file and try figure all that’s in it (it is not ideally structured maybe, but no biologist ever cared) – that said, I am sure their team had very similar arguments concerning structure etc.! (you have as many opinions as people). Maybe the issue is that the boundary conditions were not as well defined, but I would say at this point make them more inclusive than they need to be (empty spaces cost little memory) Secondly, and following on from firstly. We need to simply agree and compromise to make any progress asap. Rather than building separate structures we need to add/modify a single existing structure or we might as well be working on independent projects. Carlo’s initially proposed structure seemed reasonable, maybe with some minor changes, and we should just go with that as a basis in my opinion. I would suggest that Pierre and Carlo have a Zoom together and try and come up with something that is acceptable to both. Like everything in life, this will involve making compromises. And then present it on 28th Feb. Quite simply, if there is no agreement we cannot do this project and in the end it doesn’t matter who is right or wrong. Finally, I hope the disagreements from both sides are not seen as negative or personal attacks –it is ok to disagree (that’s why we have so many meetings!) On the plus side we are still more effective than the Austrian government (that is still deciding who should be next prime minister like half a year after elections) 😊 All the best, Kareem From: Pierre Bouvet via Software <software@biobrillouin.org<mailto:software@biobrillouin.org>> Reply to: Pierre Bouvet <pierre.bouvet@meduniwien.ac.at<mailto:pierre.bouvet@meduniwien.ac.at>> Date: Friday, 21. February 2025 at 11:55 To: Carlo Bevilacqua <carlo.bevilacqua@embl.de<mailto:carlo.bevilacqua@embl.de>> Cc: <software@biobrillouin.org<mailto:software@biobrillouin.org>> Subject: [Software] Re: [EXTERN] Re: Software manuscript / BLS microscopy Hi Carlo, Thanks for your reply, here is the next pong of this ping pong series ^^ 1- I was talking indeed about the enums, but also the parameters that are defined as integers or floating point numbers and uint32. I think its easier (and that we already agreed on) having a spreadsheet with the parameters (easy to use, easy to update, easy to store and modify between two experiments using the same setup, allows to impose fixed choices for some parameters with drop-down lists, allows to detail the requirements for the attribute like its format or units and allows examples) and to just import it in the HDF5 file. >From there it’s easier to have every attribute as strings both for the import and for the concept of what an attribute is. 2- OK 3- The problem is not necessarily the number of experiments you put in the file but the number of hyper parameters you want to take into account. Let’s take an example with a doubtable sense: I want to study the effect of low-frequency temperature fluctuations on micro mechanics in active samples both eukaryote and prokaryote showing a layered structure (endothelial cells arranged in epidermis, biofilms, …) with different cell types, and as a function of aging. I would then create a file with a first range of groups for the age of the sample, then inside these groups 2 groups for eukaryote and prokaryote samples, then inside these groups N groups for the samples I’m looking at, then inside these groups M groups for the temperature fluctuations I impose, then inside these groups the individual measures I make (this is fictional, I’m scared just to think at the amount of work to have all the samples, let alone measure them), this is simply not possible with your approach I think, and even simpler experiments like to measure the Allan variance on an instrument using 2 samples is not possible with your structure I think. 4- / 5- I think the real question is what we expect to get from a wrapper: for me is to wrap the measures of a given study, to then share, link to papers, treat using new approaches… Having a structure that can wrap both a full study and an experiment is in my opinion better in the long run than forcing the format to be used with only one experiment. 6- Yes, I understand it is an identifier, but why an integer? Why not a tuple? Why not a hash? And what if there’s a bug and instead of 3 you store you store 3.0, or 2, or ‘e'? Do you imagine the amount of work to understand where this bug comes from? Assuming it’s a bug because it might very well be just an inexperienced user making a mistake and then your file is broken. The idea is good but the safer way to have this is to work with nD arrays where the dimensionality is conserved I think, or just have all the information in the same group. 7- Here again, it’s more useful for your application but many people don’t use maps, so why force them to have even an empty array for that? Plus if they need to have a dedicated array for the concentration of crosslinkers (for example), they are faced with a non-trivial solution, which means they won’t use the format. 8- Yes, we could add an additional layer, but then it means that if you don’t need it, your datasets are in plain in the group and if you need it, then you don’t have the same structure. The solution I think is to already have the treated data in a group, if you don’t need more than one group (which will be most of the time the case) then you’ll only have one group of treated data. 9- I think it’s not useful. The SNR on the other hand is useful, because in shot-noise regime it’s a marker of variance, and this is one of the ways to spot outliers from treatment (if the SNR doesn’t match the returned standard deviation on the shift of one peak, there’s a problem somewhere). 10- The std of a fit is obtained by taking the square root of the diagonalized covariant matrix returned by the fit as long as your parameters are independent (it’s super interesting actually and a little bit more complicated but it’s true enough for lorentzian, DHO, Gaussian...) 11- OK but then why not have the calibration curves placed with your measures if they are only applicable to this measure? Once again, I think having indexes that are modifiable by the user is not safe (the technical term is “idiot proof”) 12- I don’t agree, if you are capturing points at a fixed interval, then you can reconstruct the timestamp from the timestamp of the first acquisition and either the delay between two acquisitions or the timestamp of the last acquisition. Most of the time however we don’t even need this as we consider the sample to be time-invariant on the scale of our measure, so a single timestamp for all the measure is enough and is better stored as an attribute. In the special case where we are not time-invariant, then time becomes the abscissa of the measures and in that case yes, it can be a dataset, but then it’s better to not impose a fixed name for this dataset and rather let the user decide what hyper parameter is changed during he’s measure, this way the user is free to use whatever hyper parameters he feels like it. 13- OK 14- Still not clear to me. My approach is to consider an experiment to be a measure of a sample as function of one or more controlled or measured hyper parameter. So my general approach for storing experiments is have 3 files: abscissa (with the hyper parameters that vary), measure and metadata, which translates to “Raw_data”, “Abscissa_i” and attributes for this format. 15- OK, I think more than brainstorming about how to treat correctly a VIPA spectrum, we need to allow people to tell how they do it if we want this project to be used in short term, unification is a goal of this project and we will advertise it in the paper, but to be honest, I doubt people like Giuliano will run with it without second guessing it, particularly with its clinical setups, so there will be some going back and forth before we have something stable, and this means we need to allow for this back and forth to appear somewhere, I propose having it as a parameter. 16- Here I think you allow too much liberty, changing the frequency of an array to GHz is trivial and I think most people do use GHz as the unit of their frequency arrays anyway. We need to make it clear that the frequency axis is in GHz but I think we don’t need a full element for this. If you really want to specify the unit of the Frequency dataset, I would suggest putting it in its attributes in any case, and not as another element in the structure. 17- OK 18- I think it’s one way to do it but it is not intuitive: I won’t have the reflex to go check in the attributes if there is a parameter “sam_as” to see if the calibration applies to all the curves. The way I would expect it to be is using the hierarchical logic of the format: if I’m looking at a dataset in a sub-group of a group containing a calibration dataset, then I know this calibration applies to my data: Data |- Data_0 (group) | |- Calibration (dataset) | |- Data_0 (group) | | |- Raw_data (dataset) | |- Data_1 (group) | | |- Raw_data (dataset) |- Data_1 (group) | |- Calibration (dataset) | |- Data_0 (group) | | |- Raw_data (dataset) I think in this example most people would suppose Data/Data_0/Calibration applies both to Data/Data_0/Data_0/Raw_data and Data/Data_0/Data_1/Raw_data but not Data/Data_1/Data_0/Raw_data whose calibration is intuitively Data/Data_1/Calibration Once again, my approach of the structure is trying to make it intuitive and most of all, simple. For instance if I place myself in the position of someone that is willing to try “just to see how it works”, I would give myself 10s to understand how I could have a file for only one measure that complies with the new (hope to be) standard. It is my opinion as I already told you before, that your approach is too complete and therefore complex, which will inevitably lead to people not using the format unless there’s a GUI to do it for them (and even then they might not use it). I don’t want to impose my vision here, and like you I have put a lot of thinking (and testing) into building the format I propose, but I’m convinced that if we go with your structure, not only will it make it hard for anyone to understand how to use it but we’ll have problems using it ourselves. I want to repeat that I don’t have the solution, I’m just confident that my approach is much easier to conceptually understand and less restrictive than yours. In any case we can agree to disagree on that, but then it’ll be good to have an alternative backend like the one I did with your format to try and use it, and see if indeed it’s better, because if it’s not and people don’t use it, I don’t want to go back to all the trouble I had building the library, docs and GUI just to try. I don’t want to impose you anything but it would be awesome if you took the time to read the document I made and completed for you yesterday. Then you can just tell me where you think I’m missing something and you had a better solution because as you might see, I’m having problems with nearly all your structure and we can’t really use it as a starting point at this stage since most of the backend is written and the front-end is already functional for my setup (and soon Sal’s and the TFP). Best, Pierre Pierre Bouvet, PhD Post-doctoral Fellow Medical University Vienna Department of Anatomy and Cell Biology Wahringer Straße 13, 1090 Wien, Austria On 20/2/25, at 22:55, Carlo Bevilacqua <carlo.bevilacqua@embl.de<mailto:carlo.bevilacqua@embl.de>> wrote: Hi Pierre, thank you for your feedback. I appreciate that you took the time to go through my definition and highlighting the critical points. I much prefer this rather than starting working with a file format where problem might arise in the future. If we understand what are the reasons behind our choices in the definition we can merge the best of the two approaches, rather than defining two "standards" for the same thing with each of them having their limitations. I will provide an answer to each of the points you raised (I gave numbers to the points in your email below, so it is easier to reference): 1. I am not sure to which attribute you are referring specifically, but I am completely fine with text; I defined enums where I felt it makes sense to do so because there is a discrete number of options (one could always add elements at the end of an enum) 2. I defined the attributes before we started working together and I am very much open to changing them so they reflect what you have in the spreadsheet; in the document defining the file format we can just state that the attributes and their type are defined in the excel sheet 3. I did it this way because in my idea an individual HDF5 file corresponds to a single experiment. If you feel there is an advantage in keeping different experiments in the same file I am open to introduce your structure of subgroups; I honestly feel like this will only make the file unnecessarly large and different experiments would mostly not share much (apart from the metadata, which is anyway a small overhead in terms of filesize). Now of course the question is what you define as an 'experiment': for me different timepoints or measurements at different temperatures/angles/etc on the same sample are a single experiment and I defined the file so that it is possible to save them in a single file; measurements on different samples are not the same experiment in my original idea 4. same as the point 3 5. same as before, I would put different samples in different files but happy to introduce your structure if you feel there is an advantage 6. the index is used to uniquely identify an entry in the 'Analysed_data' table; it is important in the contest of reconstructing the image (see the definition of the 'tn/image' group) 7. in my opinion spatial coordinates have a privileged role since we are doing imaging and having them well defined it is important to reconstruct the image; for different abscissas I defined the 'parameters' dataset (more in point 14). If one is not doing imaging this dataset can be set to an empty array or a single element (we can include this in the definition) 8. in my idea the "Analyzed_data" group doesn't contain multiple treatments but the result of the fit on the 'final' spectra, which are unique; if you are referring to the 'n' in the 'Shift_n_GHz' that is included in case a multipeak fit is performed. Now, if we want to include the possibility of multiple treatments like you are doing (which I didn't originally consider) we could just add an additional layer to the hierarchy 9. that is the amplitude of the peak from the fit. I am not sure if you didn't understand what I meant or you think it is not an useful information 10. The fit error actually contains 2 quantities: R2 and RMSE (as defined in the type). I am not sure how you would calculate a std from a single spectrum 11. the calibration curves are stored in the 'calibration_spectra' group with the name of the dataset matching the respective 'Calibration_index'. In our VIPA setup we are acquiring multiple calibration curves during a single acquisition to compensate for laser drift, that's why I introduced the possibility of having multiple calibration curves. Note that the 'Calibration_index' is defined as optional exactly because it might not be needed 12. each spectrum can have its own timestamp if it is acquired from a different camera image or scan of a FP, etc that's why it needs to be a dataset. Note that it is an optional dataset 13. good point, we can rename it to PSD 14. that is exactly to account for the general case of the abscissa not being a spatial coordinate and it contains the values for the parameters (e.g. the angles in an angle resolved measurement). It is a dataset whose dimensions are defined in the description (happy to elaborate more if it is not clear) 15. float is the type of each element; it is a dataset whose dimensions are defined in the description; the way to define the frequency axis in general for setups which don't have an absolute frequency (like VIPAs) is tricky and would be good to brainstorm about possibile solutions 16. as for the name we can change it, but the problem on how to deal with the situation when one doesn't have the frequency in GHz remains. My idea here was to leave the possibility of different units because the fit and most of the data analysis can be performed even if the x-axis is not in GHz and the actual conversion of the shift to GHz can be done at the end and requires the calibration data. As in my previous point, I am happy to brainstorm different solutions to this problem 17. it is indeed redundant with 'Analyzed_data' and I pushed a change on GitHub to correct this 18. see point 11; also note that the group is optional (in case people don't need it) and I introduced the attribute "same_as" to avoid repeating it multiple times if it is always the same for all the 'tn' As you see we agree with some of the points or we could find a common solution, for others it was mainly a misunderstanding on what were my intentions (probably my bad in expressing them, but you could have asked if it was not clear). Hope this helps claryfing my reasoning in the file definition and I am happy to discuss all the open points. I will look in details at your newest definition that you shared in the next days. Best, Carlo On Thu, Feb 20, 2025 at 18:25, Pierre Bouvet via Software <software@biobrillouin.org<mailto:software@biobrillouin.org>> wrote: Hi, My goal with this project is to unify the treatment of BLS spectra, to then allow us to address fundamental biophysical questions with BLS as a community in the mid-long term. Therefore my principal concern for this format is simplicity: measure are datasets called “Raw_data”, if they need one or more abscissa to be understood, this/these abscissa are called “Abscissa_i” and they are placed in groups called “Data_i” where we can store their attributes in the group’s attributes. From there, I can put groups in groups to store an experiment with different ... (e.g. : samples, time points, positions, techniques, wavelengths, patients, …). This structure is trivial but lacks usability so I added an attribute called “Name” to all groups that the user can define as he wants without impacting the structure. Now here are a few critics on Carlo’s approach. I didn’t want to share them because I hate criticizing anyone’s work, and I do think that what Carlo presented is great, but I don’t want you to think that I just trashed what he did, to the contrary, it’s because I see limitations in his approach that I tried developing another, simpler one. So here are the points I have problems with in Carlo’s approach: 1. The preferred type of the information on an experiment should be text as we’ll likely see new devices (like your super nice FT approach) appear in the next months/years that will require new parameters to be defined to describe them. I think we should really try not to use anything else than strings in the attributes. 2. The experiment information should not be defined by the HDF5 file structure but rather by a spreadsheet because everyone knows how to use Excel, and it’s way easier to edit an Excel file than an HDF5 file. 3. Experiment information should apply to measures and not to files, because they might vary from experiment to experiment, I think their preferred allocation is thus the attributes of the groups storing individual measures (in my approach) 4. The characterization of the instrument might also be experiment-dependent (if for some reason you change the tilt of a VIPA during the experiment for example), therefore having a dedicated group for it might not work for some experiments 5. The groups are named “tn” and the structure does not present the nomenclature of sub-groups, this is a big problem if we want to store in the same format say different samples measured at different times (the logic patch would be to have sub-groups follow the same structure so tn/tm/tl/… but it should be mentioned in the definition of the structure) 6. The dataset “index” in Analyzed_data is difficult to understand, what is it used for? I think it’s not useful, I would delete it. 7. The "spatial position" in Analyzed_data supposes that we are doing mappings. This is too restrictive for no reason, it’s better to generalize the abscissa and allow the user to specify a non-limiting parameter (the “Name” attribute for example) with whatever value he wants (position, temperature, concentration of whatever, …). A concrete example of a limit here: angle measurements, I want my data to be dependent on the angle, not the position. 8. Having different datasets in the same “Analyzed_data” group corresponding to the result of different treatments raises the question of where the process followed to treat the data is stored. A better approach would be to create n groups “Analyzed_data_n” with only one dataset of treated values, allowing for the process to be stored in the attributes of the group Analyzed_data_n 9. I don’t understand why store an array of amplitude in “Analyzed_data”, is it for the SNR? Then maybe we could name this array “SNR”? 10. The array “Fit_error_n” is super important but ill defined. I’d rather choose a statistical quantity like the variance, standard deviation (what I think is best), least-square error… and have it apply to both the Shift and Linewidth array as so: “Shift_std” and “Linewidth_std" 11. I don’t understand “Calibration_index”: where are the calibration curves? Are they in “experiment_info”? If so, we expect people to already process their calibration curves to create an array before adding them to the hdf5 file? I’m not very familiar with all devices, so I might not see the limitations here but do we ever have more than one calibration curve per measure? Could we not add it to the group as a “Calibration” dataset? Or just have one group with the calibration curve? 12. Timestamp is typically an attribute, it shouldn’t be present inside the group as an element. 13. In tn/Spectra_n , “Amplitude” is the PSD so I would call it PSD because there are other “Amplitude” datasets so it’s confusing. If it’s not the PSD, I would call it “Raw_data”. 14. I don’t understand what “Parameters” is meant to do in tn/Spectra_n, plus it’s not a dataset so I would put it in attributes or most likely not use it as I don’t understand what it does. 15. Frequency is a dataset, not a float (I think). We also need to have a place where to store the process to obtain it. In VIPA spectrometers for instance this is likely a big (the main even I think) source of error. I would put this process in attributes (as a text). 16. I don’t think “Unit” is useful, if we have a frequency axis, then we should define it directly in GHz, and if it’s a pixel axis, then for one we should not call it “Frequency” and then it’s better not to put anything since by default we will consider the abscissa (in absence of Frequency) as a simple range of the size of the “Amplitude” dataset. 17. /tn/Images: it’s a good idea, but I believe this is redundant with “Analyzed_data” (?) If it’s not then I don’t understand how we get the datasets inside it. 18. “Calibration_spectra” is a separate group, wouldn’t it be better to have it in “Experiment_info” in the presented structure? Also might scare off people that might not want to store a calibration file every time they create a HDF5 file (I might or might not be one of them) Like I said before, I don’t want this to be taken as more than what lead me to defining a new approach to the format. I want to state once again that Carlo's structure is complete, only it’s useful for specific instruments and applications, and difficultly applicable to other techniques and scenarios (and more lazy people like myself). Following Carlo’s mail, I’ve also completed the PDF I made to describe the structure I use in the HDF5_BLS library, I’m joining it to this email and pushing its code to GitHub<https://github.com/bio-brillouin/HDF5_BLS/blob/GUI_development/guides/Projec...>, feel free to edit it and criticize it at length (I feel like I deserve it after this email I really tried not to write). Best, Pierre Pierre Bouvet, PhD Post-doctoral Fellow Medical University Vienna Department of Anatomy and Cell Biology Wahringer Straße 13, 1090 Wien, Austria On 20/2/25, at 16:12, Robert Prevedel via Software <software@biobrillouin.org<mailto:software@biobrillouin.org>> wrote: Dear all, great to see all this discussion in this thread, and thanks to especially Pierre and Carlo for driving this forward. I’ve been following the various emails and arguments closely but simply didn’t have any time to chip in due to some important committments in the past days. I understand that there was a bit of a disagreement about what the focus of this effort should be, so maybe it just helps to highlight my lab's view on this (which I just discussed in depth with Carlo and Sebastian): Our original motivation was to come up with and define a common file-format, as we regard this to be key to unify the processing and visualization of Brillouin data by the community. In this respect, we would be happy to focus our efforts on defining this format and taking care of implementing the necessary processing/visualization software and interface that allows anyone to look at the data in the same way. We also regard this to be crucial if we want to standardize the reporting of Brillouin data from diverse setups/users/applications. Therefore, at this stage it would be extremely important to agree on the structure of the file format. Carlo has proposed a very well thought-through structure for this, and it would be great to get your concrete feedback on this, as I understand this hasn’t really happened yet. To aid in this, e.g. Pierre and/or Sal could try to convert or save your standard data into this structure, and report on any difficulties or ambiguities that he encounters. Based on this I agree it’s best to meet and discuss and iron this out as a next step, however it either has to be next week (ideally Fri?), or after March 12 as I am travelling back-to-back in the meantime. Of course feel free to also meet without me for more technical discussions if this speeds up things. Either way we could then also discuss the file format etc. for the ‘raw’ data that Pierre proposed (and which is indeed very valuable as well). Let me know your thoughts, and let’s keep up the great momentum and excitement on this work! Best, Robert -- Dr. Robert Prevedel Group Leader Cell Biology and Biophysics Unit European Molecular Biology Laboratory Meyerhofstr. 1 69117 Heidelberg, Germany Phone: +49 6221 387-8722 Email: robert.prevedel@embl.de<mailto:robert.prevedel@embl.de> http://www.prevedel.embl.de<http://www.prevedel.embl.de/> On 20.02.2025, at 10:29, Carlo Bevilacqua via Software <software@biobrillouin.org<mailto:software@biobrillouin.org>> wrote: Hi Kareem, thanks for the suggestion, I agree that it is a good (and easy) way to divide the tasks! Just to be clear, it is not that I don't see the need/advantage of providing some standard treatment going from raw data to standard spectra, it is just that was not my priority when proposing the idea of a unified file format. Regarding the file format, splitting the one containing the raw data and the treatments from the one containing the spectra and the image in a standard format might be a good solution and we can always merge them at a later stage. As for the file containing the "standard" spectra, it would be very helpful if you can give some feedback on the structure I originally proposed<https://github.com/prevedel-lab/Brillouin-standard-file/blob/main/docs/Bh5_f...>. Keep in mind that the idea is to be able to associate spectrum/spectra to each pixel in the image, in a way that is independent of the scanning strategy and underlaying technique. I tried to find a solution that works for the techniques I am aware of, considering the peculiarities (e.g. for most VIPA setups there is no absolute frequency axis but only relative to water). If am happy to discuss why I made some specific choices and if you see a better way to achieve the same or see things differently. Both the 3rd and the 4th of March work for me. Best, Carlo On Thu, Feb 20, 2025 at 02:50, Kareem Elsayad via Software <software@biobrillouin.org<mailto:software@biobrillouin.org>> wrote: Dear All, (and I guess especially Carlo & Pierre 😊) I understand both your (main) points concerning what this all should be, and I think this is actually perfect for dividing tasks. The format of the hf or bh5 file being where things meet and what needs to be agreed on. The thing with raw data is ofcourse that it is variable between instruments and labs, and the conversion to “standard spectra” that can then be fitted etc. is going to be unique (maybe even between experiments in same project). That said, asking people to create some complex file from their data that works with a developed software is also unlikely to get a following. So (the way I see it) there are basically two parts. Getting from raw data to h5 (or bh5) format which contains the spectra in standard format. And then the whole analysis part and visualization (GUI, pretty features, etc.). While the latter may get the spotlight, it obviously relies heavily on the former being done right. Given that there are numerous “standard” BLS setup implementations the development of software for getting from raw data to h5 I think makes sense, since the h5 will no doubt be cryptic, and creating a working h5 is not something everyone will want to program by themselves (it is not an insignificant step given we are also trying to ultimately cater to biologists). As such a software that generates the h5 files, with drag and drop features and entering system parameters, for different setups makes sense and will save many labs a headache if they don’t have a good programmer on hand. So I would suggest that Pierre & Sal lead the work on developing this, while Carlo & Sebastian lead the work on developing the analysis/interface-presentation part. This way things are nicely divided and we just need to agree on the h5 file that is transferred between the two. From the side of Pierre & Sal there could maybe also be a second h5 generated that contains all the raw data and details on how it was converted to the transferred h5 file (for complete transparency this could then also be reported in papers if people wish). These could exist as two separate programs with respective GUIs but also eventually combined to a single one. How does this sound to everyone? To clear up details and try assign tasks going forward how about a Zoom first week of March (I would be free Monday 3rd and Tue 4th after 1pm)? All the best, Kareem From: Carlo Bevilacqua via Software <software@biobrillouin.org<mailto:software@biobrillouin.org>> Reply to: Carlo Bevilacqua <carlo.bevilacqua@embl.de<mailto:carlo.bevilacqua@embl.de>> Date: Wednesday, 19. February 2025 at 20:43 To: Pierre Bouvet <pierre.bouvet@meduniwien.ac.at<mailto:pierre.bouvet@meduniwien.ac.at>> Cc: <software@biobrillouin.org<mailto:software@biobrillouin.org>> Subject: [Software] Re: [EXTERN] Re: Software manuscript / BLS microscopy Hi Pierre, I realized that we might have slightly different aims. For me the most important part of this project is to have a unified file format that can be read and visualized by a standard software. The file format you are proposing is not sufficient for that in my opinion. For example one of my main motivation was to have an interface where the user can see the reconstructed image, click on a pixel, see the corresponding spectrum to check its quality and maybe try different fitting functions; that would already not be possible with your structure because the software would have no notion on where the spectral data is stored and how to associate it to a specific pixel. I don't see the structure of the file to be too complex as an issue, as long as it is functional: we can always provide an API and/or a GUI that allow people to take their spectra and save them in whatever format we decide without bothering about understanding the actual structure, the same way you can work with HDF5 file without having any understanding on how the data is actually stored on the disk. My idea of making a webapp as a GUI follows directly from there. Typical case: I sent some data to a collaborator and they can just run the app in their browser and check if the outliers they see in the image are real or a bad spectra. Similarly if we make a common database of Brillouin spectra, people can explore it easily using the webapp. From what I understood, you are instead more interested in going from raw data to an actual spectrum, which I don't see so much as a priority because each lab has their own code already and the actual procedure would be different for each lab (apart from standard instruments like the FP). I am not saying this should not be part of the software but not as a priority and rather has a layer where people can easily implement their own code (of course we could already implement code for standard instruments). I think it would be good to cleary define what is our common aim now, so we are sure we are working in the same direction. Let me know if you agree or I misunderstood what is your idea. Best, Carlo On Wed, Feb 19, 2025 at 16:11, Pierre Bouvet <pierre.bouvet@meduniwien.ac.at<mailto:pierre.bouvet@meduniwien.ac.at>> wrote: Hi, I think you're trying to go too far too fast. The approach I present here<https://github.com/bio-brillouin/HDF5_BLS/blob/GUI_development/guides/Projec...> is intentionally simple, so that people can very quickly get to storing their data in a HDF5 file format together with the parameters they used to acquire them with minimal effort. The closest to what you did is therefore as follows: - data are datasets with no other restriction and they are stored in groups - each group can have a set of attribute proper to the data they are storing - attributes have a nomenclature imposed by a spreadsheet and are in the form of text - the default name of a data is the name of a raw data: “Raw_data”, other arrays can have whatever name they want (Shift_5GHz, Frequency, ...) - arrays and attributes are hierarchical, so they apply to their groups and all groups under it. This is the bare minimum to meet our needs, so we need to stop here in the definition of the format since it’s already enough to have the GUI working correctly, and therefore the first version of the unified software advertised. Of course we will have to refine things later on, but we don’t want to scare people off by presenting them a file description that for one might not match their measurements and that is extremely hard to conceptually understand. To make my point clearer, take your definition of the format for example: there are 3 different amplitude arrays in your description, two different shift arrays and width arrays that are of different dimension, then we have a calibration group on one side but a spectrometer characterization array in another group that is called “experiment_info”, that’s just too complicated to use correctly. On the other hand, placing your raw data “as is” in a group dedicated to this data is conceptually easy and straightforward. Where you are right, is that should we have hundreds of people using it, we might in a near future want to store abscissa, impulse responses, … in a standardized manner. In that case, the question falls down to either adding sub-groups or storing the data together with the measure. Both are fine and don’t really pose a problem for now, essentially because we are not trying to visualize the results but just trying to unify the way to get them. Now regarding Dash, if I understand correctly, it’s just a way to change the frontend you propose? If that’s so, why not, but then I don’t really see the benefits: if you really want to use dash, you can always embed it inside a Qt app. Also Dash being browser based, you will only have one window for the whole interface, which will be a pain to deal with if you want to use the interface to do everything the GUI is expected to do (inspect an H5 file, convert PSD, treat data, edit parameters, inspect a failed treatment, simulate results using setups with slight changes of parameters…). We agree that at one point when people receive an h5 file, it will be useful to have a web interface that can do what yours or Sal’s GUI do (seeing the mapping results together with the spectrum, eventually the time-domain signal) but here again, it’s going too far too soon: let’s first have a simple and reliable GUI that can convert data from any spectrometer to PSDs and treat them with a unified code. This is the real challenge, visualization and nomenclature of results are both important but secondary. Also keep in mind that, the frontend can easily be generated by anyone really, with Copilot or ChatGPT or whatever AI, but you can’t ask them to develop the function that will correctly read your data and convert them to a PSD nor treat the PSD. This is done on the backend and is the priority since the unification essentially happens there. Best, Pierre Pierre Bouvet, PhD Post-doctoral Fellow Medical University Vienna Department of Anatomy and Cell Biology Wahringer Straße 13, 1090 Wien, Austria On 19/2/25, at 13:21, Carlo Bevilacqua <carlo.bevilacqua@embl.de<mailto:carlo.bevilacqua@embl.de>> wrote: Hi Pierre, thanks for your reply. Regarding the file structure, what I am still not very clear about is what you define as Raw_data and data, how the actual spectra are stored and how the association to spatial coordinates and parameters is made. That's why I would really appreciate if you could make a document similar to what I did<https://github.com/prevedel-lab/Brillouin-standard-file/blob/main/docs/Bh5_f...>, where it is clear what each group should (or can) contain, what is the shape of each dataset, which attributes they have, etc... I am not saying that this should be the final structure of the file but I strongly believe that having it written in a structured way helps defining it and seeing potential issues. Regarding the webapp, it works by separating the frontend, which run in the browser and is responsible of running the GUI, and the backend which is doing the actual computation and that you can structure as you like with multithreading or any optimization you wish. The communication between frontend and backend is handled transparently by the framework, so you don't have to take care of it. When you run Dash locally a local server is created so the data stays on your computer and there is no issue with data transfer/privacy. If we want to move it to a server at a later stage, then you are right about the fact that data needs to be transferred to a server (although there might be solutions that allow you to still run the computation on the local browser, like WebAssembly<https://webassembly.org/>, but I think it is too complex to look into this at this stage). Regarding safety and privacy, the data will be stored on the server only for the time that the user is using the app and then deleted (of course we will need to make a disclaimer on the website about this). Regarding space I don't think people at the beginning will load their 1Tb dataset on the webapp but rather look at some small dataset of few tens of Gb; in that case 1Tb of server space is more than enough (remember that the file will be stored only for the time the user is using the app). If people really start to use the webapp and space becomes a limitation, I would be super happy to look into WebAssembly so that the data can be handled locally from the browser without transferring it to the server. To summarize I would agree that, at this stage, there might be no advantage of a webapp over a local GUI (and might actually be a bit more work to develop it). But, if this project really flies, the potential of a webapp is huge, especially in the context of the BioBrillouin society where we want to have a database of spectral data and the webapp could be used to explore that without downloading anything on your computer. My main point is that moving now to a webapp would not be too much work, but if we want to do it at a later stage it will basically entail re-writing everything from scratch. Let me know what are your thoughts about it. Best, Carlo On Wed, Feb 19, 2025 at 08:51, Pierre Bouvet <pierre.bouvet@meduniwien.ac.at<mailto:pierre.bouvet@meduniwien.ac.at>> wrote: Hi Carlo, You’re right, the format is still a little fuzzy. The main idea is to have a data-based hierarchy for storage: each data is stored in an individual group. From there, abscissa dependent on the data are stored in the same group and the treated data are stored in sub-groups. The names of the groups and sub-groups are fixed (Data_i), as is the name of the raw data (Raw_data) and abscissa (Abscissa_i). Also, the measure and spectrometer-dependent arguments have a defined nomenclature. To differentiate groups between them, we preferably attribute them a name as an attribute that is not used as an identifier, the identifier being either the path to the data/group from file root (Data_0/Data_42/Data_2/Raw_data) or potentially a hash value (not implemented). This I think allows all possible configurations, and using an hierarchical approach we can also pass common attributes and arrays (parameters of the spectrometer or abscissa arrays for example) on parent to reduce memory complexity. Now regarding the use of server-based GUI, first off, I’ve never used them so I’m just making supposition here but if the platform is able to treat data online, it will have to store the spectra somewhere in memory and it will not be local. My primary concerns with this approach is safety, particularly in terms of intellectual property protection, ethical considerations, and potential security vulnerabilities. Additionally, managing storage space will be a headache. Now, this doesn’t mean that we can’t have a server-based data plotter, or a server-based interface that does treatments locally but I don’t really see the benefits of this over a local software that can have multiple windows, which could at one point be multithreaded, and that could wrap c code to speed regressions for example (some of this might apply to Dash, I’m not super familiar with it). Now regarding memory complexity, having all the data we treat go on a server is a bad idea as it will raise the question of cost which will very rapidly become a real problem. Just an example: for a 100x100 map, I need 10Gb of memory (1Mo/point) with my setup (1To of archive storage is approximately 1euro/month) so this would get out of hands super fast assuming people use it. Now maybe there are solutions I don’t see for these problems and someone can take care of them but for me it’s just not worth the effort when having a local GUI solves all of these issues at once. But if you find a solution, then I’ll be happy to migrate to Dash, it won’t be fast to translate every feature but I can totally join you on the platform. Best, Pierre Pierre Bouvet, PhD Post-doctoral Fellow Medical University Vienna Department of Anatomy and Cell Biology Wahringer Straße 13, 1090 Wien, Austria On 18/2/25, at 20:26, Carlo Bevilacqua <carlo.bevilacqua@embl.de<mailto:carlo.bevilacqua@embl.de>> wrote: Hi Pierre, regarding the structure of the file, I agree that we should keep it simple. I am not suggesting to make it more complex, rather to have a document where we define it in a clear and structured way rather than as a general description, to make sure that we are all on the same page. I am saying this because, to be honest, I am not sure I fully understand how you are structuring the HDF5 and I think it is important to agree on this now, rather than finding at a later stage that we had different ideas. Ideally if the GUI should be part of a single application, we should write it using a unified framework. The reasons why, after considering it for a bit, I lean towards Dash rather than Qt are: * it can run in a web browser so it will be easy to eventually move it to a website, thus people can use it without installing it (which will hopefully help in promoting its use) * it is based on plotly<https://plotly.com/python/> which is a graphical library with very good plotting capabilites and highly customizable, that would make the data visualization easier/more appealing Let me know what you think about it and if you see any advantage of Qt over a web app which I am not considering. Also, if we agree that Dash might be a better option, would you consider migrating to Dash? It might not be too much work if most of the code you wrote is for data processing rather that for the GUI itself and I could help you with that. Alternatively one workaround is to have a QtWebEngine<https://doc.qt.io/qtforpython-6/overviews/qtwebengine-overview.html> in your Qt app and have the Dash app run inside that, but that would make only the Dash part portable to a server later on. Best, Carlo On Tue, Feb 18, 2025 at 10:24, Pierre Bouvet <pierre.bouvet@meduniwien.ac.at<mailto:pierre.bouvet@meduniwien.ac.at>> wrote: Hi, Thanks, More than merge them later, just keep them separate in the process and rather than trying to build "one code to do it all", build one library and GUI that encapsulate codes to do everything. Having a structure is a must but it needs to be kept as simple as possible else we’ll rapidly find situations where we need to change the structure. The middle ground I think is to force the use of hierarchies and impose nomenclatures where problem are expected to appear: each dataset has its own group, each group can encapsulate other groups, each parameter of a group applies to all its sub-groups if the subgroup does not change its value, each array of a group applies to all of its sub-groups if the sub-group does not redefine an array with same name, the names of the groups are held as parameters and their ID are managed by the software. For the Plotly interface, I don’t know how to integrate it to Qt but if you find a way to do it, that’s perfect with me :) My vision of the GUI is something that unifies the format and can then execute scripts on the data stored in this format. I have pushed the application of the GUI to my data up to the point where I can do the whole information extraction process from it (add data, convert to PSD, fit curves). I think this could be super interesting if we implement it for all techniques. I think we could formalize the project in milestones, in particular define the minimal denominator that will allow us to have the paper. The milestone I reached for my spectro encompasses the following points: - Being able to add data to the file easily (by dragging & dropping to the GUI) - Being able to assign properties to these data easily (again by dragging & dropping) - Being able to structure the added data in groups/folders/containers/however we want to call it - Making it easy for new data types to be loaded - Allowing data from same type but different structure to be added (e.g. .dat files) - Execute scripts on the data easily and allowing parameters of these scripts to be defined from the GUI (e.g. select a peak on a curve to fit this peak) - Make it easy to add scripts for treating or extracting PSD from raw data. - Allow the export of a Python code to access the data from the file (we cans see them as “break points” in the treatment pipeline) - Edit of properties inside the GUI In any case I think we could build a spec sheet for the project with what we want to have in it based on what we want to advertise in the paper. We can always add things later on but if we agree on a strict minimum to have the project advertised, then that will set its first milestone on which we’ll be able to build later on. Best, Pierre Pierre Bouvet, PhD Post-doctoral Fellow Medical University Vienna Department of Anatomy and Cell Biology Wahringer Straße 13, 1090 Wien, Austria On 17/2/25, at 14:53, Carlo Bevilacqua via Software <software@biobrillouin.org<mailto:software@biobrillouin.org>> wrote: Hi Pierre, hi Sal, thanks for sharing your thoughts about it. @Pierre I am very sorry that Ren passed away :( As far as I understood you are suggesting to work on the individual aspects separately and then merge them together at a later stage? I am fine with that but I still think it is very important to now agree on what should be in the file format we are defining, because that is kind of the core of the project and will affect a lot of the design choices. I am happy to start working on the GUI for data visualization. In my idea, it will be something similar to this<https://www.nature.com/articles/s41592-023-02054-z/figures/10> but written in dash<https://dash.plotly.com/>, so it is a web app that for now can run locally (so no transfer of data to an external server is required) but in the future can easily be uploaded to a website that people can just use without installing anything on their computer. The question is how much of the data processing should be possible to do (or trigger) from the same GUI? I think at least a drop down menu with different fitting functions should be there, so the user can quickly check the results on a spectrum from a specific point in the image. @Pierre how are you envisioning the GUI you are working on? As far as I understood it is mainly to get the raw data and save it to our HDF5 format with some treatment on it. One idea could be to have a shared list of features that we are implementing in the GUI as we work on it, to avoid having the same functionality duplicated (or worst inconsistent) between the GUI for generating our file format and the GUI for visualization. Let me know what you think about it. Best, Carlo On Mon, Feb 17, 2025 at 11:04, Pierre Bouvet via Software <software@biobrillouin.org<mailto:software@biobrillouin.org>> wrote: Hi everyone, Sorry for the delayed response, I just went through the loss of Ren (my dog) and wasn’t at all able to answer. First of, Sal, I am making progress and I should have everything you have made on your branch integrated to the GUI branch soon, at which point I will push everything to main. Regarding the project, I think I align with Sal: keep things as simple as possible. My approach was to divide everything in 3 mostly independent layers: - Store data in an organized file that anyone can use, and make it easy to do - Convert these data into something that has physical significance: a Power Spectrum Density - Extract information from this Power Spectrum Density Each layer has its own challenge but they are independent on the challenge of having people using it: personally, if I had someone come to me with a new software to play with my measures, I would most likely only look at it for 1 minute (or less depending who made it) with a lot of apprehension and then based on how simple it looks and how much I understood of it, use it or - what is most likely - discard it. This is why Project.pdf<https://github.com/bio-brillouin/HDF5_BLS/blob/GUI_development/guides/Projec...> is essentially meant to say: we put data arrays in groups and give them attributes written in text, but you can also create groups within groups to organize your data! I believe most of the people in the BioBrillouin society will have the same approach and before having something complex that can do a lot, I think it’s best to have something simple that can just unify the format (which in itself is a lot) and that people can use right away with a minimal impact on their own individual pipelines for data processing. To be honest, I don’t think people will blindly trust our software at first to treat their data, but they will most likely use it at first to organize their raw spectra, and maybe add their own treated data if they are feeling particularly adventurous. But that is not a problem as long as we start a movement. From there yes, we can complexity and create custom file architectures but that is already too complex I think for this first project. If we can all just import our data to the wrapper and specify their attributes, this will already be a success. Then for the paper, if we can all add a custom code to treat these data to obtain a PSD, I think this will be enough. As I said, the current API already allows you to add your data in a variety of format, so it’s just a question of developing the PSD conversion before having something we can publish (and then tell people to use). A few extra points: - Working with my setup, I realized if the user could choose between different algorithms to treat their own data, it would make the overall project much more usable (if an algorithm bugs for whatever reason, you can use another one) so I created 2 bottle necks in the form of functions (for PSD conversion and treatment) that would inspect modules dedicated to either PSD conversion or treatment, and list existing functions. It’s in between classical and modular programming but it makes the development of new PSD conversion code and treatment way way easier - The GUI is developed using oriented-object programming. Therefore I have already made some low-level choices that kind of impact all the GUI. I’m not saying they are the best choices, I’m just saying that they work, so if you want to work on the GUI, I would either recommend getting familiar with these choices, or making sure that all the functionalities are preserved, particularly the ones that are invisible (logging of treatment steps, treatment errors…) I’ll try merging the branches on Git asap and will definitely send you all an email when it’s done :) Best, Pierre Pierre Bouvet, PhD Post-doctoral Fellow Medical University Vienna Department of Anatomy and Cell Biology Wahringer Straße 13, 1090 Wien, Austria On 14/2/25, at 19:36, Sal La Cavera Iii via Software <software@biobrillouin.org<mailto:software@biobrillouin.org>> wrote: Hi all, I agree with the things enumerated and points made by Kareem/Carlo! I guess I would advocate for starting from a position of simplicity. We probably don't want to get weighed down by trying to include a bunch of bells and whistles from the start as these can be easily added once there is a minimally viable stable product. As long as data can be loaded to local memory, then treated in various (initially simple) ways through the GUI (and maybe maintain non-GUI compatibility for command-line warriors like myself), then the bh5 formatting stuff can be sorted on the back end? I definitely agree with Carlo's structure set out in the file format document; but all of that data will be floating around the memory in some shape or form and just needs to be wrapped up and packaged (according to Carlo's structure e.g.) when the user is happy and presses the "generate h5 filestore" etc. (?) Definitely agree with the recommendation to create the alpha using mainly requirements that our 3 labs would find useful (import filetypes, treatments, etc), and then we can add on more universal functionality second / get some beta testers in from other labs etc. I'm able to support on whatever jobs need doing and am free to meet in the beginning of March like you mentioned Kareem. Hope you guys have a nice weekend, Cheers, Sal --------------------------------------------------------------- Salvatore La Cavera III Royal Academy of Engineering Research Fellow Nottingham Research Fellow Optics and Photonics Group University of Nottingham Email: salvatore.lacaveraiii@nottingham.ac.uk<mailto:salvatore.lacaveraiii@nottingham.ac.uk> ORCID iD: 0000-0003-0210-3102 <Outlook-tygjxucs.png><https://outlook.office.com/bookwithme/user/6a3f960a8e89429cb6fc693c01d10119@...> Book a Coffee and Research chat with me! ________________________________ From: Carlo Bevilacqua via Software <software@biobrillouin.org<mailto:software@biobrillouin.org>> Sent: 12 February 2025 13:31 To: Kareem Elsayad <kareem.elsayad@meduniwien.ac.at<mailto:kareem.elsayad@meduniwien.ac.at>> Cc: sebastian.hambura@embl.de<mailto:sebastian.hambura@embl.de> <sebastian.hambura@embl.de<mailto:sebastian.hambura@embl.de>>; software@biobrillouin.org<mailto:software@biobrillouin.org> <software@biobrillouin.org<mailto:software@biobrillouin.org>> Subject: [Software] Re: Software manuscript / BLS microscopy You don't often get email from software@biobrillouin.org<mailto:software@biobrillouin.org>. Learn why this is important<https://aka.ms/LearnAboutSenderIdentification> Hi Kareem, thanks for restarting this and sorry for my silence, I just came back from US and was planning to start working on this again. Could you also add Sebastian (in CC) to the mailing list? As you outlined, I would split the project into two parts: 1) getting from the raw data to some standard "processed' spectra and 2) do data analysis/visualization on that. For the second part the way I envision it is: 1. the most updated definition of the file format from Pierre is this one<https://github.com/bio-brillouin/HDF5_BLS/blob/GUI_development/guides/Projec...>, correct? In addition to this document I think it would be good to have a more structured description of the file (like this<https://github.com/prevedel-lab/Brillouin-standard-file/blob/main/docs/Bh5_f...>), where each field is clearly defined in terms of data type and dimensions. Sebastian was also suggesting that the document should contain the reasoning behind each specific choice in the specs and also things that we considered but decided had some issues (so in future we can look back at it). I still believe that the file format should contain the "processed" spectra (i.e. after FT and baseline subtraction for impulsive, or after taking a line profile and possibly linearization with VIPA,...) so we can apply standard data processing or visualization which is independent on the actual underlaying technique (e.g. VIPA, FP, stimulated, time domain, ...) 2. agree on an API to read the data from our file format (most likely a Python class). For that we should: 1) decide on which information is important to extract (spectral information, spatial coordinates, hyper-parameters, metadata,...) 2) implement an interface to read the data (e.g. readSpectrumAtIndex(...), readImage(...), ...) 3. build a GUI that use the previously defined API to show and process the data. I would say that, once we have a very solid description of the file format as in step 1, step 2 will come naturally and we can divide the actual implementation between us. Step 3 can also easily be implemented and divided between us once we have an API (and I am happy to work on the GUI myself). The first half of the project is the trickiest and I know Pierre has already done a lot of work in that direction. We should definitely agree on which extent we can define a standard to store the raw data, given the variability between labs, (and probably we should do it for common techniques like FP or VIPA) and how to implement the treatments, leaving to possibility to load some custom code in the pipeline to do the conversion. Let me know what you all think about this. If you agree I would start by making a document which clearly defines the file format in a structured way (as in my step 1 before). @Pierre could you write a new document or modify the document I originally made<https://github.com/prevedel-lab/Brillouin-standard-file/blob/main/docs/Bh5_f...> to reflect the latest structure you implemented for the file format? The metadata can still be defined in a separated excel sheet, as long as the data type and format is well defined there. Best regards, Carlo On Wed, Feb 12, 2025 at 02:19, Kareem Elsayad via Software <software@biobrillouin.org<mailto:software@biobrillouin.org>> wrote: Hi Robert, Carlo, Sal, Pierre, Think it would be good to follow up on software project. Pierre has made some progress here and would be good to try and define tasks a little bit clearer to make progress… There is always the potential issue of having “too many cooks in the kitchen” (that have different recipes for same thing) to move forward efficiently, something that I noticed can get quite confusing/frustrating when writing software together with people. So would be good to clearly assign tasks. I talked to Pierre today and he would be happy to integrate things in framework we have to try tie things together. What would foremost be needed would be ways of treating data, meaning code that takes a raw spectral image and meta-data and converts it into “standard” format (spectral representation) that can then be fitted. Then also “plugins” that serve a specific purpose in the analysis/rendering that can be included in framework. The way I see it (and please comment if you see differently), there are ~4 steps here: 1. Take raw data (in .tif,, .dat, txt, etc. format) and meta data (in .cvs, xlsx, .dat, .txt, etc.) and render a standard spectral presentation. Also take provided instrument response in one of these formats and extract key parameters from this 2. Fit the data with drop-down menu list of functions, that will include different functional dependences and functions corrected for instrument response. 3. Generate/display a visual representation of results (frequency shift(s) and linewidth(s)), that is ideally interactive to some extent (and maybe has some funky features like looking at spectra at different points. These can be spatial maps and/or evolution with some other parameter (time, temperature, angle, etc.). Also be able to display maps of relative peak intensities in case of multiple peak fits, and whatever else useful you can think of. 4. Extract “mechanical” parameters given assigned refractive indices and densities I think the idea of fitting modified functions (e.g. corrected based on instrument response) vs. deconvolving spectra makes more sense (as can account for more complex corrections due to non-optical anomalies in future –ultimately even functional variations in vicinity of e.g. phase transitions). It is also less error prone, as systematically doing decon with non-ideal registration data can really throw you off the cliff, so to speak. My understanding is that we kind of agreed on initial meta-data reporting format. Getting from 1 to 2 will no doubt be most challenging as it is very instrument specific. So instructions will need to be written for different BLS implementations. This is a huge project if we want it to be all inclusive.. so I would suggest to focus on making it work for just a couple of modalities first would be good (e.g. crossed VIPA, time-resolved, anisotropy, and maybe some time or temperature course of one of these). Extensions should then be more easy to navigate. At one point think would be good to involve SBS specific considerations also. Think would be good to discuss a while per email to gather thoughts and opinions (and already start to share codes), and then plan a meeting beginning of March -- how does first week of March look for everyone? I created this mailing list (software@biobrillouin.org<mailto:software@biobrillouin.org>) we can use for discussion. You should all be able to post to (and it makes it easier if we bring anyone else in along the way). At moment on this mailing list is Robert, Carlo, Sal, Pierre and myself. Let me know if I should add anyone. All the best, Kareem This message and any attachment are intended solely for the addressee and may contain confidential information. If you have received this message in error, please contact the sender and delete the email and attachment. Any views or opinions expressed by the author of this email do not necessarily reflect the views of the University of Nottingham. Email communications with the University of Nottingham may be monitored where permitted by law. _______________________________________________ Software mailing list -- software@biobrillouin.org<mailto:software@biobrillouin.org> To unsubscribe send an email to software-leave@biobrillouin.org<mailto:software-leave@biobrillouin.org> _______________________________________________ Software mailing list -- software@biobrillouin.org<mailto:software@biobrillouin.org> To unsubscribe send an email to software-leave@biobrillouin.org<mailto:software-leave@biobrillouin.org> _______________________________________________ Software mailing list -- software@biobrillouin.org<mailto:software@biobrillouin.org> To unsubscribe send an email to software-leave@biobrillouin.org<mailto:software-leave@biobrillouin.org> _______________________________________________ Software mailing list -- software@biobrillouin.org<mailto:software@biobrillouin.org> To unsubscribe send an email to software-leave@biobrillouin.org<mailto:software-leave@biobrillouin.org> _______________________________________________ Software mailing list -- software@biobrillouin.org<mailto:software@biobrillouin.org> To unsubscribe send an email to software-leave@biobrillouin.org<mailto:software-leave@biobrillouin.org> _______________________________________________ Software mailing list -- software@biobrillouin.org<mailto:software@biobrillouin.org> To unsubscribe send an email to software-leave@biobrillouin.org<mailto:software-leave@biobrillouin.org> _______________________________________________ Software mailing list -- software@biobrillouin.org<mailto:software@biobrillouin.org> To unsubscribe send an email to software-leave@biobrillouin.org<mailto:software-leave@biobrillouin.org> _______________________________________________ Software mailing list -- software@biobrillouin.org<mailto:software@biobrillouin.org> To unsubscribe send an email to software-leave@biobrillouin.org<mailto:software-leave@biobrillouin.org> This message and any attachment are intended solely for the addressee and may contain confidential information. If you have received this message in error, please contact the sender and delete the email and attachment. Any views or opinions expressed by the author of this email do not necessarily reflect the views of the University of Nottingham. Email communications with the University of Nottingham may be monitored where permitted by law. This message and any attachment are intended solely for the addressee and may contain confidential information. If you have received this message in error, please contact the sender and delete the email and attachment. Any views or opinions expressed by the author of this email do not necessarily reflect the views of the University of Nottingham. Email communications with the University of Nottingham may be monitored where permitted by law.
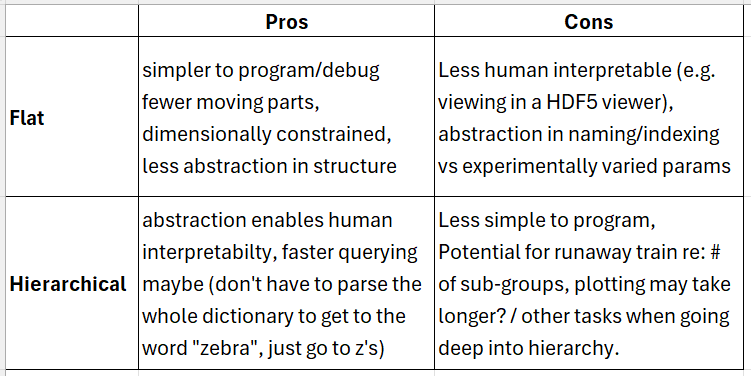
Hi Sal, Awesome, thanks :) I think the project is heading towards a definition of two complementary formats: one for heavy data treatment and storage (hierarchical) and one for image uniformization, display and treatment (linear). I believe this is a win—win solution since it will allow everyone using BLS in imagery to have a standard to share and use their data, and for the people that don’t do imagery, we still have a unified way for storing data with the parameters inherited from the consensus paper, and with both format using the same treatment functions so that in the end we unify the extraction of information from the data. Also this would allow the image files to be lighter since they won’t have to carry anything more than the parameters of the measure, PSD, Frequency and extracted information. I guess we’ll have next Friday meeting to polish things off ^^ Best, Pierre Pierre Bouvet, PhD Post-doctoral Fellow Medical University Vienna Department of Anatomy and Cell Biology Wahringer Straße 13, 1090 Wien, Austria
On 7/3/25, at 15:04, Sal La Cavera Iii via Software <software@biobrillouin.org> wrote:
Hi guys,
Continuing from my previous email, here's a quick example script comparing the two / converting between with dummy data. Obviously this has group names/number of sub-groups hardcoded in, but this can be done dynamically fairly easily I think.
Hope you have a nice weekend,
Sal
--------------------------------------------------------------- Salvatore La Cavera III Royal Academy of Engineering Research Fellow Nottingham Research Fellow Optics and Photonics Group University of Nottingham Email: salvatore.lacaveraiii@nottingham.ac.uk <mailto:salvatore.lacaveraiii@nottingham.ac.uk> ORCID iD: 0000-0003-0210-3102 <Outlook-lqib3snj.png> <https://outlook.office.com/bookwithme/user/6a3f960a8e89429cb6fc693c01d10119@...> Book a Coffee and Research chat with me! From: Sal La Cavera Iii via Software <software@biobrillouin.org <mailto:software@biobrillouin.org>> Sent: 06 March 2025 16:06 To: software@biobrillouin.org <mailto:software@biobrillouin.org> <software@biobrillouin.org <mailto:software@biobrillouin.org>>; Carlo Bevilacqua <carlo.bevilacqua@embl.de <mailto:carlo.bevilacqua@embl.de>> Subject: [Software] Re: [EXTERN] Re: Software manuscript / BLS microscopy
Hi everyone,
First off I just want to acknowledge the hard work and thoughtful approaches coming from both sides! I think this is one of those situations where there's no clearcut perfect/ideal way to do it. Yes perhaps certain approaches will be most compatible with certain visions / anticipated use-cases. Right now I see this as not " a battle for supremacy of the future BLS signal processing pipeline" but more of an opportunity to "integrate over different opinions which by definition will result in the most generalised useful solution for the future community."
With that being said, I think we're getting a bit stuck in the mud / failure to launch / paralysis by over-analysis (insert whatever idiom you'd like here).
I appreciate that we want to get this right from the very beginning so that we're united with a clear vision/future direction, and to avoid backtracking/redoing things as much as possible.
I also appreciate that I do not have a horse in this race compared to you guys. Our lab uses custom matlab code, and we only consider ourselves in how it was developed. You guys on the other hand, use similar equipment / data sets / signal processing pipelines. But we're at the point where each lab wants "their way" of doing things to be adopted by the world (and leads to impasses and entrenchment).
I digress... I haven't worked with hdf5 before, so my expertise is somewhat limited, but from what I can gather based on reading up on things / the points made in your debates there are some pro's/con's for each approach:
<image.png>
(I may be wrong on some of the above, feel free to ignore/correct etc)
If we're expecting absolutely MASSIVE experiments to be pumped through the system, then perhaps the abstraction offered by the hierarchical approach is preferred and the additional complexity is justified. If we're instead appealing to the average user that just wants to store a couple imaging results and visualise, then staying lean-and-mean with the flat approach seems easiest.
Historically our lab tends towards the flatter side of things, but this is potentially because we haven't done enormous enormous multivariate studies yet. And so in terms of future use cases for this project wrt our time domain lab, the multivariate experimental data organisation is most useful for us compared to just visualising the data (we already do that routinely with interactive plots/maps).
Perhaps the flat-to-hierarchical (and vice-versa) conversion functionality is the way to go? Yes it will be more work, but it will give the Nat Meth/BLS community a better/tuneable product. So the user can choose which structure type they want in their h5 file.
But I think we definitely want the plotting functionality to be dependent on a single structure (e.g. flat). So the conversion function will play a functional role in ensuring compatibility with the plotting (also hdf5 files potentially not generated by our project).
Otherwise, if we want the debate to continue, perhaps both sides should prepare a mock h5 file with the different structures? E.g. 8 data sets with 2 Specimens with 2 temperatures each and 2 mutations each? (even if it's just the same data copied over a bunch of times). Then we can send the file around, have a play, compare scripts, etc.
Happy to support no matter which path is chosen, and will have availability to meet biweekly as discussed!
Cheers everyone,
Sal
--------------------------------------------------------------- Salvatore La Cavera III Royal Academy of Engineering Research Fellow Nottingham Research Fellow Optics and Photonics Group University of Nottingham Email: salvatore.lacaveraiii@nottingham.ac.uk <mailto:salvatore.lacaveraiii@nottingham.ac.uk> ORCID iD: 0000-0003-0210-3102 <Outlook-vhjibkfo.png> <https://outlook.office.com/bookwithme/user/6a3f960a8e89429cb6fc693c01d10119@...> Book a Coffee and Research chat with me! From: Carlo Bevilacqua via Software <software@biobrillouin.org <mailto:software@biobrillouin.org>> Sent: 05 March 2025 15:58 To: software@biobrillouin.org <mailto:software@biobrillouin.org> <software@biobrillouin.org <mailto:software@biobrillouin.org>> Subject: [Software] Re: [EXTERN] Re: Software manuscript / BLS microscopy
Hi Kareem,
thanks for great summary. I largely agree with the way you described what I have in mind, I would only add two points: In the case of discrete parameters they can be stored as "fake" timepoints, as you mentioned. I think this is fair, because anyways they will be in practice acquired at different times (one need to change the sample, temperature, etc...). In that case the only difference between my and Pierre's approach is that Pierre would store them in a hierarchical structure and I would do it in a flatten structure (which I believe is always possible because the hierarchy in Pierre's case is not given by some parent/children relationship, but each leaf of the tree is uniquely defined by a set of parameters) in the case of angularly resolved measurements, my structure actually allow these type of measurements to be stored in a single file, (even in a single dataset - see the description of ' /data{n}/PSD <https://github.com/bio-brillouin/HDF5_BLS/blob/main/Bh5_file_spec.md>' ); I think this is a good way to store spectra acquired simultaneously, where you have many spectra acquired always in the same condition (clear example is the angularly-resolved VIPA) and one can add an arbitrary number of such "parameters" by adding more dimensions Now, going to the reasons why I don't think Pierre's approach would work for what I am trying to do: he gives complete flexibility to the dimensions of each dataset, which has the advantage of storing arbitrary data but the drawback of not knowing what each dimension corresponds to (so how to treat/visualize them with a standard software?); also, I want to highlight that in the format I am proposing people could add as many dataset/group to the file as they want: this will give them complete flexibility on what to store in the file without breaking the compatibility with the standard (the software will just ignore the data that is not part of the standard); I don't see the reason of forcing people to add data non required by the standard in a structured way, if anyway a software could not make any use of that, not knowing what that data means there is no clear definition on how a spatial mapping is stored, so it is hard to do the visualization I mentioned in my previous email where I can show the image of the sample My counter-proposal (mostly aligning with what you proposed) is that, since it is difficult to agree on the link between the two projects and, as you pointed out, they are mostly independent, I would propose that for now we work to two completely separated projects. Currently Robert is away for more than one week, but once he will back we can discuss if strategically it makes sense to try to merge them later or keep them separated.
Let me know if you agree with this.
Best, Carlo
On Wed, Mar 5, 2025 at 10:31, Kareem Elsayad via Software <software@biobrillouin.org <mailto:software@biobrillouin.org>> wrote: Dear All,
Having read through the emails finally, here is what I gather. Keeping in mind that I may be misunderstanding things (correct me), this is how I would suggest we proceed.
(Now it’s my go to write a long email 😊)
Carlo’s vision appears to be to have (conceptually) the equivalent of a .tiff file used in e.g. fluorescence confocal microscopy that represents one particular measurement. this could be data (in the form of PSD for each voxel) pertaining to a spatial 2D or 3D scan/image. It may also be a time course 2D or 3D set of images (as is also possible in .tiff). The file also contains metadata (objective, laser wavelength/power, etc. used – basically the stuff in our consensus reporting xls). In addition it also (optionally) contains the Instrument Response Function (IRF). Potentially the latter is saved in the form of a control spectra of a known (indicated) material, but I would say more ideally it is stored as an IRF as this is more universal (between techniques), requires no additional info (measured sample), and is easier and faster to work with on analysis/fitting side (saves additional extraction of IRF which will be technique dependent). Now this is all well and good and I am fine with this. The downside is that it is limited to wanting to look at images /volume-images and (optionally) how they evolve over time. If you want to see how something changes with temperature or any other variable, or e.g. between two mutants, you would just save each as a separate file. This is usually what biologists are used to. Sure it might not be the most memory efficient (you would have to write all the metadata in each) but I don’t see that as an issue since this doesn’t take up too much memory (and we’ve become a lot better at working with large files than we were say 10 years ago). The downside comes when you want to look at say how the BLS spectra at a single position or a collection of voxels changes as you tune some parameter. Maybe for static maps you could “fake it” and save as a time series, which software recognizes? However, if you have 50 different BLS spectra for each voxel in a 3D space in a time series measurement (from e.g. 50 different angles) you have an extra degrees of freedom …would one need 50 files, one for each angle bin?. So it’s not necessarily different experiments, but just in this case one additional degree of freedom. Given dispersion only needs to be in one direction and we have two degrees of freedom on our camera, one can envision this extra degree of freedom being used for various other things (I.e not only spatial or angular multiplexing). Then there is maybe some physical-chemist-biologist who wants to say measure the change in linewidth as he/she induces a phase transition by tuning one thing or another at a single point (or few points). He/she is probably fine fitting each spectra with their own code as they scan e.g. the temperature across the transition. The question is do we also want to cater for him/her or are we just purely for BLS imaging?
Pierre’s vision appears to be to have maximum flexibility in this regard, with a structure that is general enough to optimally accommodate for saving data for an entire multi-variable experiment. Namely if you do an angle-resolved map of a cell over time and repeat the experiments at different temperatures, and then say also for different mutants, you can store all that data in a single file. I think this is a very noble and cool idea, except that in practice you will (biology being biology) need to do this on >10 cells (in each case) to get anything statistically significant. You can in principle put that too into the same file, but now we are talking about firstly increased complexity (which I guess can theoretically be overcome since to most people this is a black box anyhow) but ultimately doing/reporting science in a way biologists – or indeed most scientists - are not used to (so it would be trend-setting in that sense – having an entire study in a single file, with statistics and so forth done not separately and differently between labs). This is certainly not a conceptually a crazy idea, and probably even the future of science (but maybe something best exploring firstly in a larger consortium with standard fluorescence, EM etc. techniques if it hasn’t already – which it probably has). It also makes things more amiable to be analyzed and compared (between different studies) by e.g. AI in a multi-variate/dimensional way (maybe should propose to Zuckerberg?). I digress. I think here it is worth keeping things not just as simple but also as basic as possible. With Nat Meth (assuming they consider interesting enough) the focus is biologists in their current state of mind, and with their current habits, and that is kind of what we need to cater for when trying to sell an exotic technique to the masses.
So, following my rambling, here is how I think we should proceed, as we need to move forward and not dwell on this longer.
As mentioned in previous emails, this is basically two separate projects (of equal importance) that just need to agree on their meeting point in the middle. It is ideal that the goals are already more or less defined between getting raw data to a “standard” format (Vienna/Nottingham side), and “fitting/presenting” data (Heidelberg side).
Not reaching a general consensus on the h5 format I would suggest that Carlo/Sebastian work with their file format and Pierre/Sal with theirs and we figure how to patch together after (see below).
It maybe would be good to clarify some of the lingo first to avoid misunderstandings. (Maybe the below has been defined, in which case ignore and see it as a reflection of my naivety)…
Firstly, “treatment”. Is this “just” the step from getting from the raw acquired spectra to an agreed upon, universally applicable, presentation of the PDS for each voxel (excl. any decon., since we fit IRF modified Lorentzians/DHOs) which can be fed into the same fitting procedure(s)? This would I guess only include one peak (e.g. anti-Stokes) since in time domain that’s all you’ll get out anyhow. Does it refer to the entire construction of the h5 file? Does it include the fitting and extraction of the frequency shifts and linewidths? the calculation of viscoelastic moduli (if one provides auxiliary parameters like refractive index and density)?
Secondly, and related, in dividing tasks it is also not clear to me if the “standard” h5 file contains also the fitted values for frequency shift/linewidth or just the raw data. From the division of work load my understanding is that the fitting will be done in Carlo/Sebastian’s code (?). Will the fitted values then also be included in the h5 file or not? (i.e. additionally written into it after it was generated from Pierre’s codes). There is no point of everybody doing their own fitting code, which would kinda miss the point of having some universality/standard?
I guess to me it is unclear where the division of labor is. To keep things simple I would suggest that Pierre’s code simply generates the standard h5 file (unfitted, but in a standard PSD presentation for each voxel, and includes optional IRF), and then Carlo/Sebastian’s codes do the fitting and resaves the fitting parameters into some empty/assigned space in that same h5 file. If the h5 file already contains fitted paramaters (from previously running Carlo/Sebastian’s code) then these can directly be displayed (or one can chose to fit again and overwrite). How does this sound to everyone?
This does not address the contention of the file format. The solution proposed in our last Zoom meeting was creating a code that converts one (Pierre’s) file format to the other (Carlo’s). This is I think in light of the recent emails I think the only reasonable solution, and probably maybe even a great solution, considering that Pierre’s file format may contain multiple additional information (entire experiments) and the conversion between the two can allow one to e.g. pick out specific ones if and as relevant. It doesn’t have to be elaborate at this point, but it can have the potential to be for multi-variate data down the line. So this divide is actually a plus as it keeps door open for more complex data sets, without them being a neccesity. Would it maybe be possible for Pierre and Carlo to write this conversion program together as a first step? Just needs to be rudimentary so that individual parties can start working on their sides independently asap?
This code can then in the end be tacked on to one or the other codes developed by the two parties, depending on what we decide to be the standard reporting format. It is also not crazy to consider in the end two file formats that can be accepted, one maybe called “measurement”-file format, and one “experiment”-file format, that the user selects between when importing? As such if this conversion code is in Pierre’s code one may have the option to export as one of these two formats. If it is also in Carlo’s code, one has option to read either format. This way one has option of saving as and reading out from both a single image/series of images (as is normally done in bioimaging) as well as an entire experiment as one pleases and everybody is happy 😊
How does this sound?
I hope the above is a suitable way to move forward, but ofcourse let me know your thoughts and happy with alternatives…
Regarding the bi-weekly meetings suggested by Robert. I still think this makes sense… Ofcourse not everybody needs to attend all if busy, but having this time slot earmarked in calender for when it becomes necessary might be nice. I will send out an email with dates/invite info…
All the best, and hope this moves forward from here!!:)
Kareem
From: Pierre Bouvet via Software <software@biobrillouin.org <mailto:software@biobrillouin.org>> Reply to: Pierre Bouvet <pierre.bouvet@meduniwien.ac.at <mailto:pierre.bouvet@meduniwien.ac.at>> Date: Tuesday, 4. March 2025 at 11:20 To: Carlo Bevilacqua <carlo.bevilacqua@embl.de <mailto:carlo.bevilacqua@embl.de>> Cc: "software@biobrillouin.org <mailto:software@biobrillouin.org>" <software@biobrillouin.org <mailto:software@biobrillouin.org>> Subject: [Software] Re: [EXTERN] Re: Software manuscript / BLS microscopy
Hi everyone,
The spec sheet I defined for the format is there <https://github.com/bio-brillouin/HDF5_BLS/blob/main/guides/SpecSheet/SpecShe...> (I thought I had pushed it already but it seems not).
To make it simple, my aim is to have a simple way (emphasis on simple) to store any kind of data obtained with as many different setups as possible, follow a unified pipeline <https://github.com/bio-brillouin/HDF5_BLS/blob/main/guides/Pipeline/Pipeline...> and allow a unified treatment of the data. From this spec sheet I built this structure <https://github.com/bio-brillouin/HDF5_BLS/blob/main/guides/Project/Project.p...> which I’ve been using for a few months now and that seems robust enough, in fact what blocked me for adapting it to time-domain was not the structure but the code I already had written to implement it.
Once again, visualizing data is not the priority for me, because I believe the main problem in the community today is that we don’t have a single, robust and well-characterized way of extracting information from a PSD.
Best,
Pierre
Pierre Bouvet, PhD
Post-doctoral Fellow
Medical University Vienna
Department of Anatomy and Cell Biology
Wahringer Straße 13, 1090 Wien, Austria
On 3/3/25, at 21:32, Carlo Bevilacqua via Software <software@biobrillouin.org <mailto:software@biobrillouin.org>> wrote:
Hi all,
we are still trying to find an agreement with Pierre but I think that, a part from the technicalities that we can probably figure out between ourselves, we have a different view on the aims of the file format and the project in general.
Although I agree that for now we could work with separate files and convert between them, eventually we need to agree on a format to propose as a standard and I want to avoid postponing the decision (at least for the general structure, of course minor details can change during the process). Otherwise I am afraid that, once most of the code is written, it will be hard to unify it and this will make the decision even more difficult.
What I see as the main points of this project are:
to have some sort of TIFF for Brillouin data, with the main aim of storing images (i.e. spatial maps of a sample) together with the spectral data that it is used to generate them and the relevant metadata and calibration data while allowing the possibility of storing single spectra or spectra acquired in different conditions in multiple samples (i.e. having a whole study in a single file), I don't see this as a determinant in defining the file. That is because the same result can be achieved by having multiple file with a clear naming convention (e.g. ConcentrationX_TemperatureY_SampleN), which is commonly done in microscopy and I feel it is a "cleaner" solution than having everything in a single file the analysis part of the software should be able to perform standard Brillouin analysis (i.e. fit the spectra with different functions that the user can select) but possibly more advanced stuff (like PCA or non-negative matrix factorisation) the visualization part would be similar to this <https://www.nature.com/articles/s41592-023-02054-z/figures/10>, where the user can click on a pixel and see the corresponding spectrum (possibly selecting different fit functions and see the result on the fly). If multiple images are stored in the file, some dropdown menus would appear to select the relevant parameters, which identify a single image. I discussed about these points with Robert and Sebastian and we agree on them. The structure of the file I proposed (and refined with input from Pierre and Sebastian) is designed with these aims in mind.
@Pierre, can you please list your aims? I don't want write what I understood from you because I might misrapresent them.
It would be good to have your feedback on what you consider to be the main aims and priorities, so we can have the last iteration on the format, as we'd like to proceed with the actual coding.
Best regards,
Carlo
On Fri, Feb 28, 2025 at 19:01, Pierre Bouvet via Software <software@biobrillouin.org <mailto:software@biobrillouin.org>> wrote:
Hi everyone :)
As I told you during the meeting, I just pushed everything on Git and merged with main. You can normally clone the project and test it on your machines by running the HDF5_BLS_GUI/main.py script from base repository. If it doesn’t work, it might be an os compatibility issue on the paths, but I’m hopeful I won’t have to patch that ^^
You can quickly test it with the test data provided in tests/test_data, this will however only allow you to do the most basic things (import data and edit parameters). A first version of the parameter spreadsheet (the child of the Consensus paper) is located in “spreadsheets”. You can open this file and edit it and then export it as csv. The exported csv can be dragged and dropped into the right frame of the GUI to update all the parameters of the group or dataset that you have selected in the left frame.
Naturally, this GUI is built on the hierarchical structure I propose for the HDF5 file (described in guides/Project/Project.pdf), note however that it can be adjusted to a linear approach (cf discussion of today) so see this more as a first “usability” test of a - relatively - stable version, and a way for you to make a list of everything that is wrong with the software.
@ Sal: I’ll soon have the code to convert your data to PSD & frequency arrays, but I’m confident you can already use the format to store your spectra as time arrays (with abscissa) from your .dat and .con files (and .. Note that because I don’t have order of magnitudes for the parameters you use, I could only test the GUI and its usability. In case you are looking for the code for importing your data, it’s in HDF5_BLS/load_formats/load_dat.py in the “load_dat_TimeDomain” function
Last thing: I located the developer guide I couldn’t find during the meeting and placed it back where I thought it was (guides/DeveloperGuide/ModuleDeveloperGuide.pdf). I’m underlining this document because this is maybe the most important one of the whole project since it’s where people that want to collaborate after it’s made public will go to. The goal of this document is to take people by the hand and help them making their additions compatible with the whole project. For now this document only talks about adding data.
Best,
Pierre
Pierre Bouvet, PhD
Post-doctoral Fellow
Medical University Vienna
Department of Anatomy and Cell Biology
Wahringer Straße 13, 1090 Wien, Austria
On 28/2/25, at 14:18, Carlo Bevilacqua via Software <software@biobrillouin.org <mailto:software@biobrillouin.org>> wrote:
Hi all,
I made a file describing the file format, you can find it here <https://github.com/bio-brillouin/HDF5_BLS/blob/main/Bh5_file_spec.md>.
I think that attributes are easy to add and names of groups/datasets can be changed (if they are unclear now), so these are details that we don't need to discuss now.
What I find most important to agree on now is the general structure. In that sense that are still some points under discussion between me and Pierre, but hopefully we can iron them out during the meeting.
Talk to you in a bit,
Carlo
On Wed, Feb 26, 2025 at 23:56, Kareem Elsayad <kareem.elsayad@meduniwien.ac.at <mailto:kareem.elsayad@meduniwien.ac.at>> wrote:
Hi Carlo,
Sounds great!
Yes, Fri 28th @3pm still works for me. If it works for others, here is Zoom we can use:
https://us02web.zoom.us/j/5191046969?pwd=alpzaldoZEd3N2ZEQ0hYZU1RR1dOdz09
Meeting ID: 519 104 6969
Passcode: jY3zH8
All the best,
kareem
From: Carlo Bevilacqua via Software <software@biobrillouin.org <mailto:software@biobrillouin.org>> Reply to: Carlo Bevilacqua <carlo.bevilacqua@embl.de <mailto:carlo.bevilacqua@embl.de>> Date: Wednesday, 26. February 2025 at 20:43 To: Kareem Elsayad <kareem.elsayad@meduniwien.ac.at <mailto:kareem.elsayad@meduniwien.ac.at>> Cc: "software@biobrillouin.org <mailto:software@biobrillouin.org>" <software@biobrillouin.org <mailto:software@biobrillouin.org>> Subject: [Software] Re: [EXTERN] Re: Software manuscript / BLS microscopy
Hi Kareem,
thank you for your email.
We are discussing with Pierre about the details of the file format and hopefully by our next meeting we will have agreed on a file format and we can divide the tasks.
If it is still an option, Friday 28th at 3pm works for me.
Best regards,
Carlo
On Mon, Feb 24, 2025 at 03:17, Kareem Elsayad <kareem.elsayad@meduniwien.ac.at <mailto:kareem.elsayad@meduniwien.ac.at>> wrote:
Dear All,
I (and Robert) were hoping there would be some consensus on this h5 file format. Let us do a Zoom on Fri 28th Feb at 15:00?
A couple of points pertaining to arguments…
Firstly, the precise structure is not worth getting into big arguments or fuss about…as long as it contains all the information needed for the analysis/representation, and all parties can work with (able to write and read knowing what is what), it ultimately doesn’t matter. In my opinion better put more (optional) stuff in if that is issue, and make it as inclusive as possible. In the end this does not need to be read by analysis/representation side, and when we go through we can decide if and what needs to be stripped. It is after all the “black box” between doing the experiment and having your final plots/images. Take a look at say a Zeiss file and try figure all that’s in it (it is not ideally structured maybe, but no biologist ever cared) – that said, I am sure their team had very similar arguments concerning structure etc.! (you have as many opinions as people). Maybe the issue is that the boundary conditions were not as well defined, but I would say at this point make them more inclusive than they need to be (empty spaces cost little memory)
Secondly, and following on from firstly. We need to simply agree and compromise to make any progress asap. Rather than building separate structures we need to add/modify a single existing structure or we might as well be working on independent projects. Carlo’s initially proposed structure seemed reasonable, maybe with some minor changes, and we should just go with that as a basis in my opinion. I would suggest that Pierre and Carlo have a Zoom together and try and come up with something that is acceptable to both. Like everything in life, this will involve making compromises. And then present it on 28th Feb. Quite simply, if there is no agreement we cannot do this project and in the end it doesn’t matter who is right or wrong.
Finally, I hope the disagreements from both sides are not seen as negative or personal attacks –it is ok to disagree (that’s why we have so many meetings!) On the plus side we are still more effective than the Austrian government (that is still deciding who should be next prime minister like half a year after elections) 😊
All the best,
Kareem
From: Pierre Bouvet via Software <software@biobrillouin.org <mailto:software@biobrillouin.org>> Reply to: Pierre Bouvet <pierre.bouvet@meduniwien.ac.at <mailto:pierre.bouvet@meduniwien.ac.at>> Date: Friday, 21. February 2025 at 11:55 To: Carlo Bevilacqua <carlo.bevilacqua@embl.de <mailto:carlo.bevilacqua@embl.de>> Cc: <software@biobrillouin.org <mailto:software@biobrillouin.org>> Subject: [Software] Re: [EXTERN] Re: Software manuscript / BLS microscopy
Hi Carlo,
Thanks for your reply, here is the next pong of this ping pong series ^^
1- I was talking indeed about the enums, but also the parameters that are defined as integers or floating point numbers and uint32. I think its easier (and that we already agreed on) having a spreadsheet with the parameters (easy to use, easy to update, easy to store and modify between two experiments using the same setup, allows to impose fixed choices for some parameters with drop-down lists, allows to detail the requirements for the attribute like its format or units and allows examples) and to just import it in the HDF5 file. >From there it’s easier to have every attribute as strings both for the import and for the concept of what an attribute is.
2- OK
3- The problem is not necessarily the number of experiments you put in the file but the number of hyper parameters you want to take into account. Let’s take an example with a doubtable sense: I want to study the effect of low-frequency temperature fluctuations on micro mechanics in active samples both eukaryote and prokaryote showing a layered structure (endothelial cells arranged in epidermis, biofilms, …) with different cell types, and as a function of aging. I would then create a file with a first range of groups for the age of the sample, then inside these groups 2 groups for eukaryote and prokaryote samples, then inside these groups N groups for the samples I’m looking at, then inside these groups M groups for the temperature fluctuations I impose, then inside these groups the individual measures I make (this is fictional, I’m scared just to think at the amount of work to have all the samples, let alone measure them), this is simply not possible with your approach I think, and even simpler experiments like to measure the Allan variance on an instrument using 2 samples is not possible with your structure I think.
4- /
5- I think the real question is what we expect to get from a wrapper: for me is to wrap the measures of a given study, to then share, link to papers, treat using new approaches… Having a structure that can wrap both a full study and an experiment is in my opinion better in the long run than forcing the format to be used with only one experiment.
6- Yes, I understand it is an identifier, but why an integer? Why not a tuple? Why not a hash? And what if there’s a bug and instead of 3 you store you store 3.0, or 2, or ‘e'? Do you imagine the amount of work to understand where this bug comes from? Assuming it’s a bug because it might very well be just an inexperienced user making a mistake and then your file is broken. The idea is good but the safer way to have this is to work with nD arrays where the dimensionality is conserved I think, or just have all the information in the same group.
7- Here again, it’s more useful for your application but many people don’t use maps, so why force them to have even an empty array for that? Plus if they need to have a dedicated array for the concentration of crosslinkers (for example), they are faced with a non-trivial solution, which means they won’t use the format.
8- Yes, we could add an additional layer, but then it means that if you don’t need it, your datasets are in plain in the group and if you need it, then you don’t have the same structure. The solution I think is to already have the treated data in a group, if you don’t need more than one group (which will be most of the time the case) then you’ll only have one group of treated data.
9- I think it’s not useful. The SNR on the other hand is useful, because in shot-noise regime it’s a marker of variance, and this is one of the ways to spot outliers from treatment (if the SNR doesn’t match the returned standard deviation on the shift of one peak, there’s a problem somewhere).
10- The std of a fit is obtained by taking the square root of the diagonalized covariant matrix returned by the fit as long as your parameters are independent (it’s super interesting actually and a little bit more complicated but it’s true enough for lorentzian, DHO, Gaussian...)
11- OK but then why not have the calibration curves placed with your measures if they are only applicable to this measure? Once again, I think having indexes that are modifiable by the user is not safe (the technical term is “idiot proof”)
12- I don’t agree, if you are capturing points at a fixed interval, then you can reconstruct the timestamp from the timestamp of the first acquisition and either the delay between two acquisitions or the timestamp of the last acquisition. Most of the time however we don’t even need this as we consider the sample to be time-invariant on the scale of our measure, so a single timestamp for all the measure is enough and is better stored as an attribute. In the special case where we are not time-invariant, then time becomes the abscissa of the measures and in that case yes, it can be a dataset, but then it’s better to not impose a fixed name for this dataset and rather let the user decide what hyper parameter is changed during he’s measure, this way the user is free to use whatever hyper parameters he feels like it.
13- OK
14- Still not clear to me. My approach is to consider an experiment to be a measure of a sample as function of one or more controlled or measured hyper parameter. So my general approach for storing experiments is have 3 files: abscissa (with the hyper parameters that vary), measure and metadata, which translates to “Raw_data”, “Abscissa_i” and attributes for this format.
15- OK, I think more than brainstorming about how to treat correctly a VIPA spectrum, we need to allow people to tell how they do it if we want this project to be used in short term, unification is a goal of this project and we will advertise it in the paper, but to be honest, I doubt people like Giuliano will run with it without second guessing it, particularly with its clinical setups, so there will be some going back and forth before we have something stable, and this means we need to allow for this back and forth to appear somewhere, I propose having it as a parameter.
16- Here I think you allow too much liberty, changing the frequency of an array to GHz is trivial and I think most people do use GHz as the unit of their frequency arrays anyway. We need to make it clear that the frequency axis is in GHz but I think we don’t need a full element for this. If you really want to specify the unit of the Frequency dataset, I would suggest putting it in its attributes in any case, and not as another element in the structure.
17- OK
18- I think it’s one way to do it but it is not intuitive: I won’t have the reflex to go check in the attributes if there is a parameter “sam_as” to see if the calibration applies to all the curves. The way I would expect it to be is using the hierarchical logic of the format: if I’m looking at a dataset in a sub-group of a group containing a calibration dataset, then I know this calibration applies to my data:
Data
|- Data_0 (group)
| |- Calibration (dataset)
| |- Data_0 (group) | | |- Raw_data (dataset)
| |- Data_1 (group) | | |- Raw_data (dataset)
|- Data_1 (group)
| |- Calibration (dataset)
| |- Data_0 (group)
| | |- Raw_data (dataset)
I think in this example most people would suppose Data/Data_0/Calibration applies both to Data/Data_0/Data_0/Raw_data and Data/Data_0/Data_1/Raw_data but not Data/Data_1/Data_0/Raw_data whose calibration is intuitively Data/Data_1/Calibration
Once again, my approach of the structure is trying to make it intuitive and most of all, simple. For instance if I place myself in the position of someone that is willing to try “just to see how it works”, I would give myself 10s to understand how I could have a file for only one measure that complies with the new (hope to be) standard. It is my opinion as I already told you before, that your approach is too complete and therefore complex, which will inevitably lead to people not using the format unless there’s a GUI to do it for them (and even then they might not use it). I don’t want to impose my vision here, and like you I have put a lot of thinking (and testing) into building the format I propose, but I’m convinced that if we go with your structure, not only will it make it hard for anyone to understand how to use it but we’ll have problems using it ourselves. I want to repeat that I don’t have the solution, I’m just confident that my approach is much easier to conceptually understand and less restrictive than yours. In any case we can agree to disagree on that, but then it’ll be good to have an alternative backend like the one I did with your format to try and use it, and see if indeed it’s better, because if it’s not and people don’t use it, I don’t want to go back to all the trouble I had building the library, docs and GUI just to try.
I don’t want to impose you anything but it would be awesome if you took the time to read the document I made and completed for you yesterday. Then you can just tell me where you think I’m missing something and you had a better solution because as you might see, I’m having problems with nearly all your structure and we can’t really use it as a starting point at this stage since most of the backend is written and the front-end is already functional for my setup (and soon Sal’s and the TFP).
Best,
Pierre
Pierre Bouvet, PhD
Post-doctoral Fellow
Medical University Vienna
Department of Anatomy and Cell Biology
Wahringer Straße 13, 1090 Wien, Austria
On 20/2/25, at 22:55, Carlo Bevilacqua <carlo.bevilacqua@embl.de <mailto:carlo.bevilacqua@embl.de>> wrote:
Hi Pierre,
thank you for your feedback. I appreciate that you took the time to go through my definition and highlighting the critical points.
I much prefer this rather than starting working with a file format where problem might arise in the future. If we understand what are the reasons behind our choices in the definition we can merge the best of the two approaches, rather than defining two "standards" for the same thing with each of them having their limitations.
I will provide an answer to each of the points you raised (I gave numbers to the points in your email below, so it is easier to reference):
I am not sure to which attribute you are referring specifically, but I am completely fine with text; I defined enums where I felt it makes sense to do so because there is a discrete number of options (one could always add elements at the end of an enum) I defined the attributes before we started working together and I am very much open to changing them so they reflect what you have in the spreadsheet; in the document defining the file format we can just state that the attributes and their type are defined in the excel sheet I did it this way because in my idea an individual HDF5 file corresponds to a single experiment. If you feel there is an advantage in keeping different experiments in the same file I am open to introduce your structure of subgroups; I honestly feel like this will only make the file unnecessarly large and different experiments would mostly not share much (apart from the metadata, which is anyway a small overhead in terms of filesize). Now of course the question is what you define as an 'experiment': for me different timepoints or measurements at different temperatures/angles/etc on the same sample are a single experiment and I defined the file so that it is possible to save them in a single file; measurements on different samples are not the same experiment in my original idea same as the point 3 same as before, I would put different samples in different files but happy to introduce your structure if you feel there is an advantage the index is used to uniquely identify an entry in the 'Analysed_data' table; it is important in the contest of reconstructing the image (see the definition of the 'tn/image' group) in my opinion spatial coordinates have a privileged role since we are doing imaging and having them well defined it is important to reconstruct the image; for different abscissas I defined the 'parameters' dataset (more in point 14). If one is not doing imaging this dataset can be set to an empty array or a single element (we can include this in the definition) in my idea the "Analyzed_data" group doesn't contain multiple treatments but the result of the fit on the 'final' spectra, which are unique; if you are referring to the 'n' in the 'Shift_n_GHz' that is included in case a multipeak fit is performed. Now, if we want to include the possibility of multiple treatments like you are doing (which I didn't originally consider) we could just add an additional layer to the hierarchy that is the amplitude of the peak from the fit. I am not sure if you didn't understand what I meant or you think it is not an useful information The fit error actually contains 2 quantities: R2 and RMSE (as defined in the type). I am not sure how you would calculate a std from a single spectrum the calibration curves are stored in the 'calibration_spectra' group with the name of the dataset matching the respective 'Calibration_index'. In our VIPA setup we are acquiring multiple calibration curves during a single acquisition to compensate for laser drift, that's why I introduced the possibility of having multiple calibration curves. Note that the 'Calibration_index' is defined as optional exactly because it might not be needed each spectrum can have its own timestamp if it is acquired from a different camera image or scan of a FP, etc that's why it needs to be a dataset. Note that it is an optional dataset good point, we can rename it to PSD that is exactly to account for the general case of the abscissa not being a spatial coordinate and it contains the values for the parameters (e.g. the angles in an angle resolved measurement). It is a dataset whose dimensions are defined in the description (happy to elaborate more if it is not clear) float is the type of each element; it is a dataset whose dimensions are defined in the description; the way to define the frequency axis in general for setups which don't have an absolute frequency (like VIPAs) is tricky and would be good to brainstorm about possibile solutions as for the name we can change it, but the problem on how to deal with the situation when one doesn't have the frequency in GHz remains. My idea here was to leave the possibility of different units because the fit and most of the data analysis can be performed even if the x-axis is not in GHz and the actual conversion of the shift to GHz can be done at the end and requires the calibration data. As in my previous point, I am happy to brainstorm different solutions to this problem it is indeed redundant with 'Analyzed_data' and I pushed a change on GitHub to correct this see point 11; also note that the group is optional (in case people don't need it) and I introduced the attribute "same_as" to avoid repeating it multiple times if it is always the same for all the 'tn' As you see we agree with some of the points or we could find a common solution, for others it was mainly a misunderstanding on what were my intentions (probably my bad in expressing them, but you could have asked if it was not clear).
Hope this helps claryfing my reasoning in the file definition and I am happy to discuss all the open points.
I will look in details at your newest definition that you shared in the next days.
Best,
Carlo
On Thu, Feb 20, 2025 at 18:25, Pierre Bouvet via Software <software@biobrillouin.org <mailto:software@biobrillouin.org>> wrote:
Hi,
My goal with this project is to unify the treatment of BLS spectra, to then allow us to address fundamental biophysical questions with BLS as a community in the mid-long term. Therefore my principal concern for this format is simplicity: measure are datasets called “Raw_data”, if they need one or more abscissa to be understood, this/these abscissa are called “Abscissa_i” and they are placed in groups called “Data_i” where we can store their attributes in the group’s attributes. From there, I can put groups in groups to store an experiment with different ... (e.g. : samples, time points, positions, techniques, wavelengths, patients, …). This structure is trivial but lacks usability so I added an attribute called “Name” to all groups that the user can define as he wants without impacting the structure.
Now here are a few critics on Carlo’s approach. I didn’t want to share them because I hate criticizing anyone’s work, and I do think that what Carlo presented is great, but I don’t want you to think that I just trashed what he did, to the contrary, it’s because I see limitations in his approach that I tried developing another, simpler one. So here are the points I have problems with in Carlo’s approach:
The preferred type of the information on an experiment should be text as we’ll likely see new devices (like your super nice FT approach) appear in the next months/years that will require new parameters to be defined to describe them. I think we should really try not to use anything else than strings in the attributes. The experiment information should not be defined by the HDF5 file structure but rather by a spreadsheet because everyone knows how to use Excel, and it’s way easier to edit an Excel file than an HDF5 file. Experiment information should apply to measures and not to files, because they might vary from experiment to experiment, I think their preferred allocation is thus the attributes of the groups storing individual measures (in my approach) The characterization of the instrument might also be experiment-dependent (if for some reason you change the tilt of a VIPA during the experiment for example), therefore having a dedicated group for it might not work for some experiments The groups are named “tn” and the structure does not present the nomenclature of sub-groups, this is a big problem if we want to store in the same format say different samples measured at different times (the logic patch would be to have sub-groups follow the same structure so tn/tm/tl/… but it should be mentioned in the definition of the structure) The dataset “index” in Analyzed_data is difficult to understand, what is it used for? I think it’s not useful, I would delete it. The "spatial position" in Analyzed_data supposes that we are doing mappings. This is too restrictive for no reason, it’s better to generalize the abscissa and allow the user to specify a non-limiting parameter (the “Name” attribute for example) with whatever value he wants (position, temperature, concentration of whatever, …). A concrete example of a limit here: angle measurements, I want my data to be dependent on the angle, not the position. Having different datasets in the same “Analyzed_data” group corresponding to the result of different treatments raises the question of where the process followed to treat the data is stored. A better approach would be to create n groups “Analyzed_data_n” with only one dataset of treated values, allowing for the process to be stored in the attributes of the group Analyzed_data_n I don’t understand why store an array of amplitude in “Analyzed_data”, is it for the SNR? Then maybe we could name this array “SNR”? The array “Fit_error_n” is super important but ill defined. I’d rather choose a statistical quantity like the variance, standard deviation (what I think is best), least-square error… and have it apply to both the Shift and Linewidth array as so: “Shift_std” and “Linewidth_std" I don’t understand “Calibration_index”: where are the calibration curves? Are they in “experiment_info”? If so, we expect people to already process their calibration curves to create an array before adding them to the hdf5 file? I’m not very familiar with all devices, so I might not see the limitations here but do we ever have more than one calibration curve per measure? Could we not add it to the group as a “Calibration” dataset? Or just have one group with the calibration curve? Timestamp is typically an attribute, it shouldn’t be present inside the group as an element. In tn/Spectra_n , “Amplitude” is the PSD so I would call it PSD because there are other “Amplitude” datasets so it’s confusing. If it’s not the PSD, I would call it “Raw_data”. I don’t understand what “Parameters” is meant to do in tn/Spectra_n, plus it’s not a dataset so I would put it in attributes or most likely not use it as I don’t understand what it does. Frequency is a dataset, not a float (I think). We also need to have a place where to store the process to obtain it. In VIPA spectrometers for instance this is likely a big (the main even I think) source of error. I would put this process in attributes (as a text). I don’t think “Unit” is useful, if we have a frequency axis, then we should define it directly in GHz, and if it’s a pixel axis, then for one we should not call it “Frequency” and then it’s better not to put anything since by default we will consider the abscissa (in absence of Frequency) as a simple range of the size of the “Amplitude” dataset. /tn/Images: it’s a good idea, but I believe this is redundant with “Analyzed_data” (?) If it’s not then I don’t understand how we get the datasets inside it. “Calibration_spectra” is a separate group, wouldn’t it be better to have it in “Experiment_info” in the presented structure? Also might scare off people that might not want to store a calibration file every time they create a HDF5 file (I might or might not be one of them) Like I said before, I don’t want this to be taken as more than what lead me to defining a new approach to the format. I want to state once again that Carlo's structure is complete, only it’s useful for specific instruments and applications, and difficultly applicable to other techniques and scenarios (and more lazy people like myself).
Following Carlo’s mail, I’ve also completed the PDF I made to describe the structure I use in the HDF5_BLS library, I’m joining it to this email and pushing its code to GitHub <https://github.com/bio-brillouin/HDF5_BLS/blob/GUI_development/guides/Projec...>, feel free to edit it and criticize it at length (I feel like I deserve it after this email I really tried not to write).
Best,
Pierre
Pierre Bouvet, PhD
Post-doctoral Fellow
Medical University Vienna
Department of Anatomy and Cell Biology
Wahringer Straße 13, 1090 Wien, Austria
On 20/2/25, at 16:12, Robert Prevedel via Software <software@biobrillouin.org <mailto:software@biobrillouin.org>> wrote:
Dear all,
great to see all this discussion in this thread, and thanks to especially Pierre and Carlo for driving this forward. I’ve been following the various emails and arguments closely but simply didn’t have any time to chip in due to some important committments in the past days.
I understand that there was a bit of a disagreement about what the focus of this effort should be, so maybe it just helps to highlight my lab's view on this (which I just discussed in depth with Carlo and Sebastian):
Our original motivation was to come up with and define a common file-format, as we regard this to be key to unify the processing and visualization of Brillouin data by the community. In this respect, we would be happy to focus our efforts on defining this format and taking care of implementing the necessary processing/visualization software and interface that allows anyone to look at the data in the same way. We also regard this to be crucial if we want to standardize the reporting of Brillouin data from diverse setups/users/applications.
Therefore, at this stage it would be extremely important to agree on the structure of the file format. Carlo has proposed a very well thought-through structure for this, and it would be great to get your concrete feedback on this, as I understand this hasn’t really happened yet. To aid in this, e.g. Pierre and/or Sal could try to convert or save your standard data into this structure, and report on any difficulties or ambiguities that he encounters.
Based on this I agree it’s best to meet and discuss and iron this out as a next step, however it either has to be next week (ideally Fri?), or after March 12 as I am travelling back-to-back in the meantime. Of course feel free to also meet without me for more technical discussions if this speeds up things. Either way we could then also discuss the file format etc. for the ‘raw’ data that Pierre proposed (and which is indeed very valuable as well).
Let me know your thoughts, and let’s keep up the great momentum and excitement on this work!
Best,
Robert
--
Dr. Robert Prevedel
Group Leader
Cell Biology and Biophysics Unit
European Molecular Biology Laboratory
Meyerhofstr. 1
69117 Heidelberg, Germany
Phone: +49 6221 387-8722
Email: robert.prevedel@embl.de <mailto:robert.prevedel@embl.de>
http://www.prevedel.embl.de <http://www.prevedel.embl.de/>
On 20.02.2025, at 10:29, Carlo Bevilacqua via Software <software@biobrillouin.org <mailto:software@biobrillouin.org>> wrote:
Hi Kareem,
thanks for the suggestion, I agree that it is a good (and easy) way to divide the tasks! Just to be clear, it is not that I don't see the need/advantage of providing some standard treatment going from raw data to standard spectra, it is just that was not my priority when proposing the idea of a unified file format.
Regarding the file format, splitting the one containing the raw data and the treatments from the one containing the spectra and the image in a standard format might be a good solution and we can always merge them at a later stage.
As for the file containing the "standard" spectra, it would be very helpful if you can give some feedback on the structure I originally proposed <https://github.com/prevedel-lab/Brillouin-standard-file/blob/main/docs/Bh5_f...>. Keep in mind that the idea is to be able to associate spectrum/spectra to each pixel in the image, in a way that is independent of the scanning strategy and underlaying technique. I tried to find a solution that works for the techniques I am aware of, considering the peculiarities (e.g. for most VIPA setups there is no absolute frequency axis but only relative to water). If am happy to discuss why I made some specific choices and if you see a better way to achieve the same or see things differently.
Both the 3rd and the 4th of March work for me.
Best,
Carlo
On Thu, Feb 20, 2025 at 02:50, Kareem Elsayad via Software <software@biobrillouin.org <mailto:software@biobrillouin.org>> wrote:
Dear All, (and I guess especially Carlo & Pierre 😊)
I understand both your (main) points concerning what this all should be, and I think this is actually perfect for dividing tasks. The format of the hf or bh5 file being where things meet and what needs to be agreed on.
The thing with raw data is ofcourse that it is variable between instruments and labs, and the conversion to “standard spectra” that can then be fitted etc. is going to be unique (maybe even between experiments in same project). That said, asking people to create some complex file from their data that works with a developed software is also unlikely to get a following.
So (the way I see it) there are basically two parts. Getting from raw data to h5 (or bh5) format which contains the spectra in standard format. And then the whole analysis part and visualization (GUI, pretty features, etc.).
While the latter may get the spotlight, it obviously relies heavily on the former being done right. Given that there are numerous “standard” BLS setup implementations the development of software for getting from raw data to h5 I think makes sense, since the h5 will no doubt be cryptic, and creating a working h5 is not something everyone will want to program by themselves (it is not an insignificant step given we are also trying to ultimately cater to biologists). As such a software that generates the h5 files, with drag and drop features and entering system parameters, for different setups makes sense and will save many labs a headache if they don’t have a good programmer on hand.
So I would suggest that Pierre & Sal lead the work on developing this, while Carlo & Sebastian lead the work on developing the analysis/interface-presentation part. This way things are nicely divided and we just need to agree on the h5 file that is transferred between the two. From the side of Pierre & Sal there could maybe also be a second h5 generated that contains all the raw data and details on how it was converted to the transferred h5 file (for complete transparency this could then also be reported in papers if people wish). These could exist as two separate programs with respective GUIs but also eventually combined to a single one.
How does this sound to everyone?
To clear up details and try assign tasks going forward how about a Zoom first week of March (I would be free Monday 3rd and Tue 4th after 1pm)?
All the best,
Kareem
From: Carlo Bevilacqua via Software <software@biobrillouin.org <mailto:software@biobrillouin.org>> Reply to: Carlo Bevilacqua <carlo.bevilacqua@embl.de <mailto:carlo.bevilacqua@embl.de>> Date: Wednesday, 19. February 2025 at 20:43 To: Pierre Bouvet <pierre.bouvet@meduniwien.ac.at <mailto:pierre.bouvet@meduniwien.ac.at>> Cc: <software@biobrillouin.org <mailto:software@biobrillouin.org>> Subject: [Software] Re: [EXTERN] Re: Software manuscript / BLS microscopy
Hi Pierre,
I realized that we might have slightly different aims.
For me the most important part of this project is to have a unified file format that can be read and visualized by a standard software. The file format you are proposing is not sufficient for that in my opinion. For example one of my main motivation was to have an interface where the user can see the reconstructed image, click on a pixel, see the corresponding spectrum to check its quality and maybe try different fitting functions; that would already not be possible with your structure because the software would have no notion on where the spectral data is stored and how to associate it to a specific pixel.
I don't see the structure of the file to be too complex as an issue, as long as it is functional: we can always provide an API and/or a GUI that allow people to take their spectra and save them in whatever format we decide without bothering about understanding the actual structure, the same way you can work with HDF5 file without having any understanding on how the data is actually stored on the disk.
My idea of making a webapp as a GUI follows directly from there. Typical case: I sent some data to a collaborator and they can just run the app in their browser and check if the outliers they see in the image are real or a bad spectra. Similarly if we make a common database of Brillouin spectra, people can explore it easily using the webapp.
From what I understood, you are instead more interested in going from raw data to an actual spectrum, which I don't see so much as a priority because each lab has their own code already and the actual procedure would be different for each lab (apart from standard instruments like the FP). I am not saying this should not be part of the software but not as a priority and rather has a layer where people can easily implement their own code (of course we could already implement code for standard instruments).
I think it would be good to cleary define what is our common aim now, so we are sure we are working in the same direction.
Let me know if you agree or I misunderstood what is your idea.
Best,
Carlo
On Wed, Feb 19, 2025 at 16:11, Pierre Bouvet <pierre.bouvet@meduniwien.ac.at <mailto:pierre.bouvet@meduniwien.ac.at>> wrote:
Hi,
I think you're trying to go too far too fast. The approach I present here <https://github.com/bio-brillouin/HDF5_BLS/blob/GUI_development/guides/Projec...> is intentionally simple, so that people can very quickly get to storing their data in a HDF5 file format together with the parameters they used to acquire them with minimal effort. The closest to what you did is therefore as follows:
- data are datasets with no other restriction and they are stored in groups
- each group can have a set of attribute proper to the data they are storing
- attributes have a nomenclature imposed by a spreadsheet and are in the form of text
- the default name of a data is the name of a raw data: “Raw_data”, other arrays can have whatever name they want (Shift_5GHz, Frequency, ...)
- arrays and attributes are hierarchical, so they apply to their groups and all groups under it.
This is the bare minimum to meet our needs, so we need to stop here in the definition of the format since it’s already enough to have the GUI working correctly, and therefore the first version of the unified software advertised. Of course we will have to refine things later on, but we don’t want to scare people off by presenting them a file description that for one might not match their measurements and that is extremely hard to conceptually understand. To make my point clearer, take your definition of the format for example: there are 3 different amplitude arrays in your description, two different shift arrays and width arrays that are of different dimension, then we have a calibration group on one side but a spectrometer characterization array in another group that is called “experiment_info”, that’s just too complicated to use correctly. On the other hand, placing your raw data “as is” in a group dedicated to this data is conceptually easy and straightforward.
Where you are right, is that should we have hundreds of people using it, we might in a near future want to store abscissa, impulse responses, … in a standardized manner. In that case, the question falls down to either adding sub-groups or storing the data together with the measure. Both are fine and don’t really pose a problem for now, essentially because we are not trying to visualize the results but just trying to unify the way to get them.
Now regarding Dash, if I understand correctly, it’s just a way to change the frontend you propose? If that’s so, why not, but then I don’t really see the benefits: if you really want to use dash, you can always embed it inside a Qt app. Also Dash being browser based, you will only have one window for the whole interface, which will be a pain to deal with if you want to use the interface to do everything the GUI is expected to do (inspect an H5 file, convert PSD, treat data, edit parameters, inspect a failed treatment, simulate results using setups with slight changes of parameters…). We agree that at one point when people receive an h5 file, it will be useful to have a web interface that can do what yours or Sal’s GUI do (seeing the mapping results together with the spectrum, eventually the time-domain signal) but here again, it’s going too far too soon: let’s first have a simple and reliable GUI that can convert data from any spectrometer to PSDs and treat them with a unified code. This is the real challenge, visualization and nomenclature of results are both important but secondary. Also keep in mind that, the frontend can easily be generated by anyone really, with Copilot or ChatGPT or whatever AI, but you can’t ask them to develop the function that will correctly read your data and convert them to a PSD nor treat the PSD. This is done on the backend and is the priority since the unification essentially happens there.
Best,
Pierre
Pierre Bouvet, PhD
Post-doctoral Fellow
Medical University Vienna
Department of Anatomy and Cell Biology
Wahringer Straße 13, 1090 Wien, Austria
On 19/2/25, at 13:21, Carlo Bevilacqua <carlo.bevilacqua@embl.de <mailto:carlo.bevilacqua@embl.de>> wrote:
Hi Pierre,
thanks for your reply.
Regarding the file structure, what I am still not very clear about is what you define as Raw_data and data, how the actual spectra are stored and how the association to spatial coordinates and parameters is made. That's why I would really appreciate if you could make a documentsimilar towhat I did <https://github.com/prevedel-lab/Brillouin-standard-file/blob/main/docs/Bh5_f...>, where it is clear what each group should (or can) contain, what is the shape of each dataset, which attributes they have, etc...
I am not saying that this should be the final structure of the file but I strongly believe that having it written in a structured way helps defining it and seeing potential issues.
Regarding the webapp, it works by separating the frontend, which run in the browser and is responsible of running the GUI, and the backend which is doing the actual computation and that you can structure as you like with multithreading or any optimization you wish. The communication between frontend and backend is handled transparently by the framework, so you don't have to take care of it.
When you run Dash locally a local server is created so the data stays on your computer and there is no issue with data transfer/privacy.
If we want to move it to a server at a later stage, then you are right about the fact that data needs to be transferred to a server (although there might be solutions that allow you to still run the computation on the local browser, like WebAssembly <https://webassembly.org/>, but I think it is too complex to look into this at this stage). Regarding safety and privacy, the data will be stored on the server only for the time that the user is using the app and then deleted (of course we will need to make a disclaimer on the website about this). Regarding space I don't think people at the beginning will load their 1Tb dataset on the webapp but rather look at some small dataset of few tens of Gb; in that case 1Tb of server space is more than enough (remember that the file will be stored only for the time the user is using the app). If people really start to use the webapp and space becomes a limitation, I would be super happy to look into WebAssembly so that the data can be handled locally from the browser without transferring it to the server.
To summarize I would agree that, at this stage, there might be no advantage of a webapp over a local GUI (and might actually be a bit more work to develop it). But, if this project really flies, the potential of a webapp is huge, especially in the context of the BioBrillouin society where we want to have a database of spectral data and the webapp could be used to explore that without downloading anything on your computer. My main point is that moving now to a webapp would not be too much work, but if we want to do it at a later stage it will basically entail re-writing everything from scratch.
Let me know what are your thoughts about it.
Best,
Carlo
On Wed, Feb 19, 2025 at 08:51, Pierre Bouvet <pierre.bouvet@meduniwien.ac.at <mailto:pierre.bouvet@meduniwien.ac.at>> wrote:
Hi Carlo,
You’re right, the format is still a little fuzzy. The main idea is to have a data-based hierarchy for storage: each data is stored in an individual group. From there, abscissa dependent on the data are stored in the same group and the treated data are stored in sub-groups. The names of the groups and sub-groups are fixed (Data_i), as is the name of the raw data (Raw_data) and abscissa (Abscissa_i). Also, the measure and spectrometer-dependent arguments have a defined nomenclature. To differentiate groups between them, we preferably attribute them a name as an attribute that is not used as an identifier, the identifier being either the path to the data/group from file root (Data_0/Data_42/Data_2/Raw_data) or potentially a hash value (not implemented). This I think allows all possible configurations, and using an hierarchical approach we can also pass common attributes and arrays (parameters of the spectrometer or abscissa arrays for example) on parent to reduce memory complexity.
Now regarding the use of server-based GUI, first off, I’ve never used them so I’m just making supposition here but if the platform is able to treat data online, it will have to store the spectra somewhere in memory and it will not be local. My primary concerns with this approach is safety, particularly in terms of intellectual property protection, ethical considerations, and potential security vulnerabilities. Additionally, managing storage space will be a headache.
Now, this doesn’t mean that we can’t have a server-based data plotter, or a server-based interface that does treatments locally but I don’t really see the benefits of this over a local software that can have multiple windows, which could at one point be multithreaded, and that could wrap c code to speed regressions for example (some of this might apply to Dash, I’m not super familiar with it). Now regarding memory complexity, having all the data we treat go on a server is a bad idea as it will raise the question of cost which will very rapidly become a real problem. Just an example: for a 100x100 map, I need 10Gb of memory (1Mo/point) with my setup (1To of archive storage is approximately 1euro/month) so this would get out of hands super fast assuming people use it.
Now maybe there are solutions I don’t see for these problems and someone can take care of them but for me it’s just not worth the effort when having a local GUI solves all of these issues at once. But if you find a solution, then I’ll be happy to migrate to Dash, it won’t be fast to translate every feature but I can totally join you on the platform.
Best,
Pierre
Pierre Bouvet, PhD
Post-doctoral Fellow
Medical University Vienna
Department of Anatomy and Cell Biology
Wahringer Straße 13, 1090 Wien, Austria
On 18/2/25, at 20:26, Carlo Bevilacqua <carlo.bevilacqua@embl.de <mailto:carlo.bevilacqua@embl.de>> wrote:
Hi Pierre,
regarding the structure of the file, I agree that we should keep it simple. I am not suggesting to make it more complex, rather to have a document where we define it in a clear and structured way rather than as a general description, to make sure that we are all on the same page.
I am saying this because, to be honest, I am not sure I fully understand how you are structuring the HDF5 and I think it is important to agree on this now, rather than finding at a later stage that we had different ideas.
Ideally if the GUI should be part of a single application, we should write it using a unified framework.
The reasons why, after considering it for a bit, I lean towards Dash rather than Qt are:
it can run in a web browser so it will be easy to eventually move it to a website, thus people can use it without installing it (which will hopefully help in promoting its use) it is based on plotly <https://plotly.com/python/>which is a graphical library with very good plotting capabilites and highly customizable, that would make the data visualization easier/more appealing Let me know what you think about it and if you see any advantage of Qt over a web app which I am not considering. Also, if we agree that Dash might be a better option, would you consider migrating to Dash? It might not be too much work if most of the code you wrote is for data processing rather that for the GUI itself and I could help you with that. Alternatively one workaround is to have a QtWebEngine <https://doc.qt.io/qtforpython-6/overviews/qtwebengine-overview.html> in your Qt app and have the Dash app run inside that, but that would make only the Dash part portable to a server later on.
Best,
Carlo
On Tue, Feb 18, 2025 at 10:24, Pierre Bouvet <pierre.bouvet@meduniwien.ac.at <mailto:pierre.bouvet@meduniwien.ac.at>> wrote:
Hi,
Thanks,
More than merge them later, just keep them separate in the process and rather than trying to build "one code to do it all", build one library and GUI that encapsulate codes to do everything.
Having a structure is a must but it needs to be kept as simple as possible else we’ll rapidly find situations where we need to change the structure. The middle ground I think is to force the use of hierarchies and impose nomenclatures where problem are expected to appear: each dataset has its own group, each group can encapsulate other groups, each parameter of a group applies to all its sub-groups if the subgroup does not change its value, each array of a group applies to all of its sub-groups if the sub-group does not redefine an array with same name, the names of the groups are held as parameters and their ID are managed by the software.
For the Plotly interface, I don’t know how to integrate it to Qt but if you find a way to do it, that’s perfect with me :)
My vision of the GUI is something that unifies the format and can then execute scripts on the data stored in this format. I have pushed the application of the GUI to my data up to the point where I can do the whole information extraction process from it (add data, convert to PSD, fit curves). I think this could be super interesting if we implement it for all techniques.
I think we could formalize the project in milestones, in particular define the minimal denominator that will allow us to have the paper. The milestone I reached for my spectro encompasses the following points:
- Being able to add data to the file easily (by dragging & dropping to the GUI)
- Being able to assign properties to these data easily (again by dragging & dropping)
- Being able to structure the added data in groups/folders/containers/however we want to call it
- Making it easy for new data types to be loaded
- Allowing data from same type but different structure to be added (e.g. .dat files)
- Execute scripts on the data easily and allowing parameters of these scripts to be defined from the GUI (e.g. select a peak on a curve to fit this peak)
- Make it easy to add scripts for treating or extracting PSD from raw data.
- Allow the export of a Python code to access the data from the file (we cans see them as “break points” in the treatment pipeline)
- Edit of properties inside the GUI
In any case I think we could build a spec sheet for the project with what we want to have in it based on what we want to advertise in the paper. We can always add things later on but if we agree on a strict minimum to have the project advertised, then that will set its first milestone on which we’ll be able to build later on.
Best,
Pierre
Pierre Bouvet, PhD
Post-doctoral Fellow
Medical University Vienna
Department of Anatomy and Cell Biology
Wahringer Straße 13, 1090 Wien, Austria
On 17/2/25, at 14:53, Carlo Bevilacqua via Software <software@biobrillouin.org <mailto:software@biobrillouin.org>> wrote:
Hi Pierre, hi Sal,
thanks for sharing your thoughts about it.
@Pierre I am very sorry that Ren passed away :(
As far as I understood you are suggesting to work on the individual aspects separately and then merge them together at a later stage? I am fine with that but I still think it is very important to now agree on what should be in the file format we are defining, because that is kind of the core of the project and will affect a lot of the design choices.
I am happy to start working on the GUI for data visualization. In my idea, it will be something similar tothis <https://www.nature.com/articles/s41592-023-02054-z/figures/10>but written in dash <https://dash.plotly.com/>, so it is a web app that for now can run locally (so no transfer of data to an external server is required) but in the future can easily be uploaded to a website that people can just use without installing anything on their computer.
The question is how much of the data processing should be possible to do (or trigger) from the same GUI? I think at least a drop down menu with different fitting functions should be there, so the user can quickly check the results on a spectrum from a specific point in the image.
@Pierre how are you envisioning the GUI you are working on? As far as I understood it is mainly to get the raw data and save it to our HDF5 format with some treatment on it.
One idea could be to have a shared list of features that we are implementing in the GUI as we work on it, to avoid having the same functionality duplicated (or worst inconsistent) between the GUI for generating our file format and the GUI for visualization.
Let me know what you think about it.
Best,
Carlo
On Mon, Feb 17, 2025 at 11:04, Pierre Bouvet via Software <software@biobrillouin.org <mailto:software@biobrillouin.org>> wrote:
Hi everyone,
Sorry for the delayed response, I just went through the loss of Ren (my dog) and wasn’t at all able to answer.
First of, Sal, I am making progress and I should have everything you have made on your branch integrated to the GUI branch soon, at which point I will push everything to main.
Regarding the project, I think I align with Sal: keep things as simple as possible. My approach was to divide everything in 3 mostly independent layers:
- Store data in an organized file that anyone can use, and make it easy to do
- Convert these data into something that has physical significance: a Power Spectrum Density
- Extract information from this Power Spectrum Density
Each layer has its own challenge but they are independent on the challenge of having people using it: personally, if I had someone come to me with a new software to play with my measures, I would most likely only look at it for 1 minute (or less depending who made it) with a lot of apprehension and then based on how simple it looks and how much I understood of it, use it or - what is most likely - discard it. This is why Project.pdf <https://github.com/bio-brillouin/HDF5_BLS/blob/GUI_development/guides/Projec...> is essentially meant to say: we put data arrays in groups and give them attributes written in text, but you can also create groups within groups to organize your data!
I believe most of the people in the BioBrillouin society will have the same approach and before having something complex that can do a lot, I think it’s best to have something simple that can just unify the format (which in itself is a lot) and that people can use right away with a minimal impact on their own individual pipelines for data processing.
To be honest, I don’t think people will blindly trust our software at first to treat their data, but they will most likely use it at first to organize their raw spectra, and maybe add their own treated data if they are feeling particularly adventurous. But that is not a problem as long as we start a movement. From there yes, we can complexity and create custom file architectures but that is already too complex I think for this first project.
If we can all just import our data to the wrapper and specify their attributes, this will already be a success. Then for the paper, if we can all add a custom code to treat these data to obtain a PSD, I think this will be enough. As I said, the current API already allows you to add your data in a variety of format, so it’s just a question of developing the PSD conversion before having something we can publish (and then tell people to use).
A few extra points:
- Working with my setup, I realized if the user could choose between different algorithms to treat their own data, it would make the overall project much more usable (if an algorithm bugs for whatever reason, you can use another one) so I created 2 bottle necks in the form of functions (for PSD conversion and treatment) that would inspect modules dedicated to either PSD conversion or treatment, and list existing functions. It’s in between classical and modular programming but it makes the development of new PSD conversion code and treatment way way easier
- The GUI is developed using oriented-object programming. Therefore I have already made some low-level choices that kind of impact all the GUI. I’m not saying they are the best choices, I’m just saying that they work, so if you want to work on the GUI, I would either recommend getting familiar with these choices, or making sure that all the functionalities are preserved, particularly the ones that are invisible (logging of treatment steps, treatment errors…)
I’ll try merging the branches on Git asap and will definitely send you all an email when it’s done :)
Best,
Pierre
Pierre Bouvet, PhD
Post-doctoral Fellow
Medical University Vienna
Department of Anatomy and Cell Biology
Wahringer Straße 13, 1090 Wien, Austria
On 14/2/25, at 19:36, Sal La Cavera Iii via Software <software@biobrillouin.org <mailto:software@biobrillouin.org>> wrote:
Hi all,
I agree with the things enumerated and points made by Kareem/Carlo! I guess I would advocate for starting from a position of simplicity. We probably don't want to get weighed down by trying to include a bunch of bells and whistles from the start as these can be easily added once there is a minimally viable stable product.
As long as data can be loaded to local memory, then treated in various (initially simple) ways through the GUI (and maybe maintain non-GUI compatibility for command-line warriors like myself), then the bh5 formatting stuff can be sorted on the back end? I definitely agree with Carlo's structure set out in the file format document; but all of that data will be floating around the memory in some shape or form and just needs to be wrapped up and packaged (according to Carlo's structure e.g.) when the user is happy and presses the "generate h5 filestore" etc. (?)
Definitely agree with the recommendation to create the alpha using mainly requirements that our 3 labs would find useful (import filetypes, treatments, etc), and then we can add on more universal functionality second / get some beta testers in from other labs etc.
I'm able to support on whatever jobs need doing and am free to meet in the beginning of March like you mentioned Kareem.
Hope you guys have a nice weekend,
Cheers,
Sal
---------------------------------------------------------------
Salvatore La Cavera III
Royal Academy of Engineering Research Fellow
Nottingham Research Fellow
Optics and Photonics Group
University of Nottingham Email: salvatore.lacaveraiii@nottingham.ac.uk <mailto:salvatore.lacaveraiii@nottingham.ac.uk> ORCID iD: 0000-0003-0210-3102
<Outlook-tygjxucs.png> <https://outlook.office.com/bookwithme/user/6a3f960a8e89429cb6fc693c01d10119@...>
Book a Coffee and Research chat with me!
From: Carlo Bevilacqua via Software <software@biobrillouin.org <mailto:software@biobrillouin.org>> Sent: 12 February 2025 13:31 To: Kareem Elsayad <kareem.elsayad@meduniwien.ac.at <mailto:kareem.elsayad@meduniwien.ac.at>> Cc: sebastian.hambura@embl.de <mailto:sebastian.hambura@embl.de> <sebastian.hambura@embl.de <mailto:sebastian.hambura@embl.de>>; software@biobrillouin.org <mailto:software@biobrillouin.org> <software@biobrillouin.org <mailto:software@biobrillouin.org>> Subject: [Software] Re: Software manuscript / BLS microscopy
You don't often get email from software@biobrillouin.org <mailto:software@biobrillouin.org>. Learn why this is important <https://aka.ms/LearnAboutSenderIdentification>
Hi Kareem,
thanks for restarting this and sorry for my silence, I just came back from US and was planning to start working on this again.
Could you also add Sebastian (in CC) to the mailing list?
As you outlined, I would split the project into two parts: 1) getting from the raw data to some standard "processed' spectra and 2) do data analysis/visualization on that. For the second part the way I envision it is:
the most updated definition of the file format from Pierre is this one <https://github.com/bio-brillouin/HDF5_BLS/blob/GUI_development/guides/Projec...>, correct? In addition to this document I think it would be good to have a more structured description of the file (like this <https://github.com/prevedel-lab/Brillouin-standard-file/blob/main/docs/Bh5_f...>), where each field is clearly defined in terms of data type and dimensions. Sebastian was also suggesting that the document should contain the reasoning behind each specific choice in the specs and also things that we considered but decided had some issues (so in future we can look back at it). I still believe that the file format should contain the "processed" spectra (i.e. after FT and baseline subtraction for impulsive, or after taking a line profile and possibly linearization with VIPA,...) so we can apply standard data processing or visualization which is independent on the actual underlaying technique (e.g. VIPA, FP, stimulated, time domain, ...) agree on an API to read the data from our file format (most likely a Python class). For that we should: 1) decide on which information is important to extract (spectral information, spatial coordinates, hyper-parameters, metadata,...) 2) implement an interface to read the data (e.g. readSpectrumAtIndex(...), readImage(...), ...) build a GUI that use the previously defined API to show and process the data. I would say that, once we have a very solid description of the file format as in step 1, step 2 will come naturally and we can divide the actual implementation between us. Step 3 can also easily be implemented and divided between us once we have an API (and I am happy to work on the GUI myself).
The first half of the project is the trickiest and I know Pierre has already done a lot of work in that direction. We should definitely agree on which extent we can define a standard to store the raw data, given the variability between labs, (and probably we should do it for common techniques like FP or VIPA) and how to implement the treatments, leaving to possibility to load some custom code in the pipeline to do the conversion.
Let me know what you all think about this.
If you agree I would start by making a document which clearly defines the file format in a structured way (as in my step 1 before). @Pierre could you write a new document or modify the document I originally made <https://github.com/prevedel-lab/Brillouin-standard-file/blob/main/docs/Bh5_f...> to reflect the latest structure you implemented for the file format? The metadata can still be defined in a separated excel sheet, as long as the data type and format is well defined there.
Best regards,
Carlo
On Wed, Feb 12, 2025 at 02:19, Kareem Elsayad via Software <software@biobrillouin.org <mailto:software@biobrillouin.org>> wrote:
Hi Robert, Carlo, Sal, Pierre,
Think it would be good to follow up on software project. Pierre has made some progress here and would be good to try and define tasks a little bit clearer to make progress…
There is always the potential issue of having “too many cooks in the kitchen” (that have different recipes for same thing) to move forward efficiently, something that I noticed can get quite confusing/frustrating when writing software together with people. So would be good to clearly assign tasks. I talked to Pierre today and he would be happy to integrate things in framework we have to try tie things together. What would foremost be needed would be ways of treating data, meaning code that takes a raw spectral image and meta-data and converts it into “standard” format (spectral representation) that can then be fitted. Then also “plugins” that serve a specific purpose in the analysis/rendering that can be included in framework.
The way I see it (and please comment if you see differently), there are ~4 steps here:
Take raw data (in .tif,, .dat, txt, etc. format) and meta data (in .cvs, xlsx, .dat, .txt, etc.) and render a standard spectral presentation. Also take provided instrument response in one of these formats and extract key parameters from this Fit the data with drop-down menu list of functions, that will include different functional dependences and functions corrected for instrument response. Generate/display a visual representation of results (frequency shift(s) and linewidth(s)), that is ideally interactive to some extent (and maybe has some funky features like looking at spectra at different points. These can be spatial maps and/or evolution with some other parameter (time, temperature, angle, etc.). Also be able to display maps of relative peak intensities in case of multiple peak fits, and whatever else useful you can think of. Extract “mechanical” parameters given assigned refractive indices and densities
I think the idea of fitting modified functions (e.g. corrected based on instrument response) vs. deconvolving spectra makes more sense (as can account for more complex corrections due to non-optical anomalies in future –ultimately even functional variations in vicinity of e.g. phase transitions). It is also less error prone, as systematically doing decon with non-ideal registration data can really throw you off the cliff, so to speak.
My understanding is that we kind of agreed on initial meta-data reporting format. Getting from 1 to 2 will no doubt be most challenging as it is very instrument specific. So instructions will need to be written for different BLS implementations.
This is a huge project if we want it to be all inclusive.. so I would suggest to focus on making it work for just a couple of modalities first would be good (e.g. crossed VIPA, time-resolved, anisotropy, and maybe some time or temperature course of one of these). Extensions should then be more easy to navigate. At one point think would be good to involve SBS specific considerations also.
Think would be good to discuss a while per email to gather thoughts and opinions (and already start to share codes), and then plan a meeting beginning of March -- how does first week of March look for everyone?
I created this mailing list (software@biobrillouin.org <mailto:software@biobrillouin.org>) we can use for discussion. You should all be able to post to (and it makes it easier if we bring anyone else in along the way).
At moment on this mailing list is Robert, Carlo, Sal, Pierre and myself. Let me know if I should add anyone.
All the best,
Kareem
This message and any attachment are intended solely for the addressee and may contain confidential information. If you have received this message in error, please contact the sender and delete the email and attachment. Any views or opinions expressed by the author of this email do not necessarily reflect the views of the University of Nottingham. Email communications with the University of Nottingham may be monitored where permitted by law. _______________________________________________ Software mailing list -- software@biobrillouin.org <mailto:software@biobrillouin.org> To unsubscribe send an email to software-leave@biobrillouin.org <mailto:software-leave@biobrillouin.org>
_______________________________________________ Software mailing list -- software@biobrillouin.org <mailto:software@biobrillouin.org> To unsubscribe send an email to software-leave@biobrillouin.org <mailto:software-leave@biobrillouin.org>
_______________________________________________ Software mailing list -- software@biobrillouin.org <mailto:software@biobrillouin.org> To unsubscribe send an email to software-leave@biobrillouin.org <mailto:software-leave@biobrillouin.org>
_______________________________________________ Software mailing list -- software@biobrillouin.org <mailto:software@biobrillouin.org> To unsubscribe send an email to software-leave@biobrillouin.org <mailto:software-leave@biobrillouin.org>
_______________________________________________ Software mailing list -- software@biobrillouin.org <mailto:software@biobrillouin.org> To unsubscribe send an email to software-leave@biobrillouin.org <mailto:software-leave@biobrillouin.org>
_______________________________________________ Software mailing list -- software@biobrillouin.org <mailto:software@biobrillouin.org> To unsubscribe send an email to software-leave@biobrillouin.org <mailto:software-leave@biobrillouin.org>
_______________________________________________ Software mailing list -- software@biobrillouin.org <mailto:software@biobrillouin.org> To unsubscribe send an email to software-leave@biobrillouin.org <mailto:software-leave@biobrillouin.org>
_______________________________________________ Software mailing list -- software@biobrillouin.org <mailto:software@biobrillouin.org> To unsubscribe send an email to software-leave@biobrillouin.org <mailto:software-leave@biobrillouin.org>
This message and any attachment are intended solely for the addressee and may contain confidential information. If you have received this message in error, please contact the sender and delete the email and attachment. Any views or opinions expressed by the author of this email do not necessarily reflect the views of the University of Nottingham. Email communications with the University of Nottingham may be monitored where permitted by law. This message and any attachment are intended solely for the addressee and may contain confidential information. If you have received this message in error, please contact the sender and delete the email and attachment. Any views or opinions expressed by the author of this email do not necessarily reflect the views of the University of Nottingham. Email communications with the University of Nottingham may be monitored where permitted by law.<flat_vs_hier.py>_______________________________________________ Software mailing list -- software@biobrillouin.org <mailto:software@biobrillouin.org> To unsubscribe send an email to software-leave@biobrillouin.org <mailto:software-leave@biobrillouin.org>
Hi All, Thanks all for chipping in and trying to find common ground 😊.. Yes, I forgot to send out invite for next Fri (14th March). Let’s do same time as last time (15:00)… Here is link: https://us02web.zoom.us/j/5191046969?pwd=alpzaldoZEd3N2ZEQ0hYZU1RR1dOdz09 Meeting ID: 519 104 6969 Passcode: jY3zH8 All the best & have a good weekend, Kareem From: Pierre Bouvet via Software <software@biobrillouin.org> Reply to: Pierre Bouvet <pierre.bouvet@meduniwien.ac.at> Date: Friday, 7. March 2025 at 16:04 To: Sal La Cavera Iii <Salvatore.Lacaveraiii@nottingham.ac.uk>, "software@biobrillouin.org" <software@biobrillouin.org> Subject: [Software] Re: [EXTERN] Re: Software manuscript / BLS microscopy Hi Sal, Awesome, thanks :) I think the project is heading towards a definition of two complementary formats: one for heavy data treatment and storage (hierarchical) and one for image uniformization, display and treatment (linear). I believe this is a win—win solution since it will allow everyone using BLS in imagery to have a standard to share and use their data, and for the people that don’t do imagery, we still have a unified way for storing data with the parameters inherited from the consensus paper, and with both format using the same treatment functions so that in the end we unify the extraction of information from the data. Also this would allow the image files to be lighter since they won’t have to carry anything more than the parameters of the measure, PSD, Frequency and extracted information. I guess we’ll have next Friday meeting to polish things off ^^ Best, Pierre Pierre Bouvet, PhD Post-doctoral Fellow Medical University Vienna Department of Anatomy and Cell Biology Wahringer Straße 13, 1090 Wien, Austria On 7/3/25, at 15:04, Sal La Cavera Iii via Software <software@biobrillouin.org> wrote: Hi guys, Continuing from my previous email, here's a quick example script comparing the two / converting between with dummy data. Obviously this has group names/number of sub-groups hardcoded in, but this can be done dynamically fairly easily I think. Hope you have a nice weekend, Sal --------------------------------------------------------------- Salvatore La Cavera III Royal Academy of Engineering Research Fellow Nottingham Research Fellow Optics and Photonics Group University of Nottingham Email: salvatore.lacaveraiii@nottingham.ac.uk ORCID iD: 0000-0003-0210-3102 <Outlook-lqib3snj.png>Book a Coffee and Research chat with me! From: Sal La Cavera Iii via Software <software@biobrillouin.org> Sent: 06 March 2025 16:06 To: software@biobrillouin.org <software@biobrillouin.org>; Carlo Bevilacqua <carlo.bevilacqua@embl.de> Subject: [Software] Re: [EXTERN] Re: Software manuscript / BLS microscopy Hi everyone, First off I just want to acknowledge the hard work and thoughtful approaches coming from both sides! I think this is one of those situations where there's no clearcut perfect/ideal way to do it. Yes perhaps certain approaches will be most compatible with certain visions / anticipated use-cases. Right now I see this as not " a battle for supremacy of the future BLS signal processing pipeline" but more of an opportunity to "integrate over different opinions which by definition will result in the most generalised useful solution for the future community." With that being said, I think we're getting a bit stuck in the mud / failure to launch / paralysis by over-analysis (insert whatever idiom you'd like here). I appreciate that we want to get this right from the very beginning so that we're united with a clear vision/future direction, and to avoid backtracking/redoing things as much as possible. I also appreciate that I do not have a horse in this race compared to you guys. Our lab uses custom matlab code, and we only consider ourselves in how it was developed. You guys on the other hand, use similar equipment / data sets / signal processing pipelines. But we're at the point where each lab wants "their way" of doing things to be adopted by the world (and leads to impasses and entrenchment). I digress... I haven't worked with hdf5 before, so my expertise is somewhat limited, but from what I can gather based on reading up on things / the points made in your debates there are some pro's/con's for each approach: <image.png> (I may be wrong on some of the above, feel free to ignore/correct etc) If we're expecting absolutely MASSIVE experiments to be pumped through the system, then perhaps the abstraction offered by the hierarchical approach is preferred and the additional complexity is justified. If we're instead appealing to the average user that just wants to store a couple imaging results and visualise, then staying lean-and-mean with the flat approach seems easiest. Historically our lab tends towards the flatter side of things, but this is potentially because we haven't done enormous enormous multivariate studies yet. And so in terms of future use cases for this project wrt our time domain lab, the multivariate experimental data organisation is most useful for us compared to just visualising the data (we already do that routinely with interactive plots/maps). Perhaps the flat-to-hierarchical (and vice-versa) conversion functionality is the way to go? Yes it will be more work, but it will give the Nat Meth/BLS community a better/tuneable product. So the user can choose which structure type they want in their h5 file. But I think we definitely want the plotting functionality to be dependent on a single structure (e.g. flat). So the conversion function will play a functional role in ensuring compatibility with the plotting (also hdf5 files potentially not generated by our project). Otherwise, if we want the debate to continue, perhaps both sides should prepare a mock h5 file with the different structures? E.g. 8 data sets with 2 Specimens with 2 temperatures each and 2 mutations each? (even if it's just the same data copied over a bunch of times). Then we can send the file around, have a play, compare scripts, etc. Happy to support no matter which path is chosen, and will have availability to meet biweekly as discussed! Cheers everyone, Sal --------------------------------------------------------------- Salvatore La Cavera III Royal Academy of Engineering Research Fellow Nottingham Research Fellow Optics and Photonics Group University of Nottingham Email: salvatore.lacaveraiii@nottingham.ac.uk ORCID iD: 0000-0003-0210-3102 <Outlook-vhjibkfo.png>Book a Coffee and Research chat with me! From: Carlo Bevilacqua via Software <software@biobrillouin.org> Sent: 05 March 2025 15:58 To: software@biobrillouin.org <software@biobrillouin.org> Subject: [Software] Re: [EXTERN] Re: Software manuscript / BLS microscopy Hi Kareem, thanks for great summary. I largely agree with the way you described what I have in mind, I would only add two points: In the case of discrete parameters they can be stored as "fake" timepoints, as you mentioned. I think this is fair, because anyways they will be in practice acquired at different times (one need to change the sample, temperature, etc...). In that case the only difference between my and Pierre's approach is that Pierre would store them in a hierarchical structure and I would do it in a flatten structure (which I believe is always possible because the hierarchy in Pierre's case is not given by some parent/children relationship, but each leaf of the tree is uniquely defined by a set of parameters) in the case of angularly resolved measurements, my structure actually allow these type of measurements to be stored in a single file, (even in a single dataset - see the description of ' /data{n}/PSD' ); I think this is a good way to store spectra acquired simultaneously, where you have many spectra acquired always in the same condition (clear example is the angularly-resolved VIPA) and one can add an arbitrary number of such "parameters" by adding more dimensions Now, going to the reasons why I don't think Pierre's approach would work for what I am trying to do: he gives complete flexibility to the dimensions of each dataset, which has the advantage of storing arbitrary data but the drawback of not knowing what each dimension corresponds to (so how to treat/visualize them with a standard software?); also, I want to highlight that in the format I am proposing people could add as many dataset/group to the file as they want: this will give them complete flexibility on what to store in the file without breaking the compatibility with the standard (the software will just ignore the data that is not part of the standard); I don't see the reason of forcing people to add data non required by the standard in a structured way, if anyway a software could not make any use of that, not knowing what that data means there is no clear definition on how a spatial mapping is stored, so it is hard to do the visualization I mentioned in my previous email where I can show the image of the sample My counter-proposal (mostly aligning with what you proposed) is that, since it is difficult to agree on the link between the two projects and, as you pointed out, they are mostly independent, I would propose that for now we work to two completely separated projects. Currently Robert is away for more than one week, but once he will back we can discuss if strategically it makes sense to try to merge them later or keep them separated. Let me know if you agree with this. Best, Carlo On Wed, Mar 5, 2025 at 10:31, Kareem Elsayad via Software <software@biobrillouin.org> wrote: Dear All, Having read through the emails finally, here is what I gather. Keeping in mind that I may be misunderstanding things (correct me), this is how I would suggest we proceed. (Now it’s my go to write a long email 😊) Carlo’s vision appears to be to have (conceptually) the equivalent of a .tiff file used in e.g. fluorescence confocal microscopy that represents one particular measurement. this could be data (in the form of PSD for each voxel) pertaining to a spatial 2D or 3D scan/image. It may also be a time course 2D or 3D set of images (as is also possible in .tiff). The file also contains metadata (objective, laser wavelength/power, etc. used – basically the stuff in our consensus reporting xls). In addition it also (optionally) contains the Instrument Response Function (IRF). Potentially the latter is saved in the form of a control spectra of a known (indicated) material, but I would say more ideally it is stored as an IRF as this is more universal (between techniques), requires no additional info (measured sample), and is easier and faster to work with on analysis/fitting side (saves additional extraction of IRF which will be technique dependent). Now this is all well and good and I am fine with this. The downside is that it is limited to wanting to look at images /volume-images and (optionally) how they evolve over time. If you want to see how something changes with temperature or any other variable, or e.g. between two mutants, you would just save each as a separate file. This is usually what biologists are used to. Sure it might not be the most memory efficient (you would have to write all the metadata in each) but I don’t see that as an issue since this doesn’t take up too much memory (and we’ve become a lot better at working with large files than we were say 10 years ago). The downside comes when you want to look at say how the BLS spectra at a single position or a collection of voxels changes as you tune some parameter. Maybe for static maps you could “fake it” and save as a time series, which software recognizes? However, if you have 50 different BLS spectra for each voxel in a 3D space in a time series measurement (from e.g. 50 different angles) you have an extra degrees of freedom …would one need 50 files, one for each angle bin?. So it’s not necessarily different experiments, but just in this case one additional degree of freedom. Given dispersion only needs to be in one direction and we have two degrees of freedom on our camera, one can envision this extra degree of freedom being used for various other things (I.e not only spatial or angular multiplexing). Then there is maybe some physical-chemist-biologist who wants to say measure the change in linewidth as he/she induces a phase transition by tuning one thing or another at a single point (or few points). He/she is probably fine fitting each spectra with their own code as they scan e.g. the temperature across the transition. The question is do we also want to cater for him/her or are we just purely for BLS imaging? Pierre’s vision appears to be to have maximum flexibility in this regard, with a structure that is general enough to optimally accommodate for saving data for an entire multi-variable experiment. Namely if you do an angle-resolved map of a cell over time and repeat the experiments at different temperatures, and then say also for different mutants, you can store all that data in a single file. I think this is a very noble and cool idea, except that in practice you will (biology being biology) need to do this on >10 cells (in each case) to get anything statistically significant. You can in principle put that too into the same file, but now we are talking about firstly increased complexity (which I guess can theoretically be overcome since to most people this is a black box anyhow) but ultimately doing/reporting science in a way biologists – or indeed most scientists - are not used to (so it would be trend-setting in that sense – having an entire study in a single file, with statistics and so forth done not separately and differently between labs). This is certainly not a conceptually a crazy idea, and probably even the future of science (but maybe something best exploring firstly in a larger consortium with standard fluorescence, EM etc. techniques if it hasn’t already – which it probably has). It also makes things more amiable to be analyzed and compared (between different studies) by e.g. AI in a multi-variate/dimensional way (maybe should propose to Zuckerberg?). I digress. I think here it is worth keeping things not just as simple but also as basic as possible. With Nat Meth (assuming they consider interesting enough) the focus is biologists in their current state of mind, and with their current habits, and that is kind of what we need to cater for when trying to sell an exotic technique to the masses. So, following my rambling, here is how I think we should proceed, as we need to move forward and not dwell on this longer. As mentioned in previous emails, this is basically two separate projects (of equal importance) that just need to agree on their meeting point in the middle. It is ideal that the goals are already more or less defined between getting raw data to a “standard” format (Vienna/Nottingham side), and “fitting/presenting” data (Heidelberg side). Not reaching a general consensus on the h5 format I would suggest that Carlo/Sebastian work with their file format and Pierre/Sal with theirs and we figure how to patch together after (see below). It maybe would be good to clarify some of the lingo first to avoid misunderstandings. (Maybe the below has been defined, in which case ignore and see it as a reflection of my naivety)… Firstly, “treatment”. Is this “just” the step from getting from the raw acquired spectra to an agreed upon, universally applicable, presentation of the PDS for each voxel (excl. any decon., since we fit IRF modified Lorentzians/DHOs) which can be fed into the same fitting procedure(s)? This would I guess only include one peak (e.g. anti-Stokes) since in time domain that’s all you’ll get out anyhow. Does it refer to the entire construction of the h5 file? Does it include the fitting and extraction of the frequency shifts and linewidths? the calculation of viscoelastic moduli (if one provides auxiliary parameters like refractive index and density)? Secondly, and related, in dividing tasks it is also not clear to me if the “standard” h5 file contains also the fitted values for frequency shift/linewidth or just the raw data. From the division of work load my understanding is that the fitting will be done in Carlo/Sebastian’s code (?). Will the fitted values then also be included in the h5 file or not? (i.e. additionally written into it after it was generated from Pierre’s codes). There is no point of everybody doing their own fitting code, which would kinda miss the point of having some universality/standard? I guess to me it is unclear where the division of labor is. To keep things simple I would suggest that Pierre’s code simply generates the standard h5 file (unfitted, but in a standard PSD presentation for each voxel, and includes optional IRF), and then Carlo/Sebastian’s codes do the fitting and resaves the fitting parameters into some empty/assigned space in that same h5 file. If the h5 file already contains fitted paramaters (from previously running Carlo/Sebastian’s code) then these can directly be displayed (or one can chose to fit again and overwrite). How does this sound to everyone? This does not address the contention of the file format. The solution proposed in our last Zoom meeting was creating a code that converts one (Pierre’s) file format to the other (Carlo’s). This is I think in light of the recent emails I think the only reasonable solution, and probably maybe even a great solution, considering that Pierre’s file format may contain multiple additional information (entire experiments) and the conversion between the two can allow one to e.g. pick out specific ones if and as relevant. It doesn’t have to be elaborate at this point, but it can have the potential to be for multi-variate data down the line. So this divide is actually a plus as it keeps door open for more complex data sets, without them being a neccesity. Would it maybe be possible for Pierre and Carlo to write this conversion program together as a first step? Just needs to be rudimentary so that individual parties can start working on their sides independently asap? This code can then in the end be tacked on to one or the other codes developed by the two parties, depending on what we decide to be the standard reporting format. It is also not crazy to consider in the end two file formats that can be accepted, one maybe called “measurement”-file format, and one “experiment”-file format, that the user selects between when importing? As such if this conversion code is in Pierre’s code one may have the option to export as one of these two formats. If it is also in Carlo’s code, one has option to read either format. This way one has option of saving as and reading out from both a single image/series of images (as is normally done in bioimaging) as well as an entire experiment as one pleases and everybody is happy 😊 How does this sound? I hope the above is a suitable way to move forward, but ofcourse let me know your thoughts and happy with alternatives… Regarding the bi-weekly meetings suggested by Robert. I still think this makes sense… Ofcourse not everybody needs to attend all if busy, but having this time slot earmarked in calender for when it becomes necessary might be nice. I will send out an email with dates/invite info… All the best, and hope this moves forward from here!!:) Kareem From: Pierre Bouvet via Software <software@biobrillouin.org> Reply to: Pierre Bouvet <pierre.bouvet@meduniwien.ac.at> Date: Tuesday, 4. March 2025 at 11:20 To: Carlo Bevilacqua <carlo.bevilacqua@embl.de> Cc: "software@biobrillouin.org" <software@biobrillouin.org> Subject: [Software] Re: [EXTERN] Re: Software manuscript / BLS microscopy Hi everyone, The spec sheet I defined for the format is there (I thought I had pushed it already but it seems not). To make it simple, my aim is to have a simple way (emphasis on simple) to store any kind of data obtained with as many different setups as possible, follow a unified pipeline and allow a unified treatment of the data. From this spec sheet I built this structure which I’ve been using for a few months now and that seems robust enough, in fact what blocked me for adapting it to time-domain was not the structure but the code I already had written to implement it. Once again, visualizing data is not the priority for me, because I believe the main problem in the community today is that we don’t have a single, robust and well-characterized way of extracting information from a PSD. Best, Pierre Pierre Bouvet, PhD Post-doctoral Fellow Medical University Vienna Department of Anatomy and Cell Biology Wahringer Straße 13, 1090 Wien, Austria On 3/3/25, at 21:32, Carlo Bevilacqua via Software <software@biobrillouin.org> wrote: Hi all, we are still trying to find an agreement with Pierre but I think that, a part from the technicalities that we can probably figure out between ourselves, we have a different view on the aims of the file format and the project in general. Although I agree that for now we could work with separate files and convert between them, eventually we need to agree on a format to propose as a standard and I want to avoid postponing the decision (at least for the general structure, of course minor details can change during the process). Otherwise I am afraid that, once most of the code is written, it will be hard to unify it and this will make the decision even more difficult. What I see as the main points of this project are: to have some sort of TIFF for Brillouin data, with the main aim of storing images (i.e. spatial maps of a sample) together with the spectral data that it is used to generate them and the relevant metadata and calibration data while allowing the possibility of storing single spectra or spectra acquired in different conditions in multiple samples (i.e. having a whole study in a single file), I don't see this as a determinant in defining the file. That is because the same result can be achieved by having multiple file with a clear naming convention (e.g. ConcentrationX_TemperatureY_SampleN), which is commonly done in microscopy and I feel it is a "cleaner" solution than having everything in a single file the analysis part of the software should be able to perform standard Brillouin analysis (i.e. fit the spectra with different functions that the user can select) but possibly more advanced stuff (like PCA or non-negative matrix factorisation) the visualization part would be similar to this, where the user can click on a pixel and see the corresponding spectrum (possibly selecting different fit functions and see the result on the fly). If multiple images are stored in the file, some dropdown menus would appear to select the relevant parameters, which identify a single image. I discussed about these points with Robert and Sebastian and we agree on them. The structure of the file I proposed (and refined with input from Pierre and Sebastian) is designed with these aims in mind. @Pierre, can you please list your aims? I don't want write what I understood from you because I might misrapresent them. It would be good to have your feedback on what you consider to be the main aims and priorities, so we can have the last iteration on the format, as we'd like to proceed with the actual coding. Best regards, Carlo On Fri, Feb 28, 2025 at 19:01, Pierre Bouvet via Software <software@biobrillouin.org> wrote: Hi everyone :) As I told you during the meeting, I just pushed everything on Git and merged with main. You can normally clone the project and test it on your machines by running the HDF5_BLS_GUI/main.py script from base repository. If it doesn’t work, it might be an os compatibility issue on the paths, but I’m hopeful I won’t have to patch that ^^ You can quickly test it with the test data provided in tests/test_data, this will however only allow you to do the most basic things (import data and edit parameters). A first version of the parameter spreadsheet (the child of the Consensus paper) is located in “spreadsheets”. You can open this file and edit it and then export it as csv. The exported csv can be dragged and dropped into the right frame of the GUI to update all the parameters of the group or dataset that you have selected in the left frame. Naturally, this GUI is built on the hierarchical structure I propose for the HDF5 file (described in guides/Project/Project.pdf), note however that it can be adjusted to a linear approach (cf discussion of today) so see this more as a first “usability” test of a - relatively - stable version, and a way for you to make a list of everything that is wrong with the software. @ Sal: I’ll soon have the code to convert your data to PSD & frequency arrays, but I’m confident you can already use the format to store your spectra as time arrays (with abscissa) from your .dat and .con files (and .. Note that because I don’t have order of magnitudes for the parameters you use, I could only test the GUI and its usability. In case you are looking for the code for importing your data, it’s in HDF5_BLS/load_formats/load_dat.py in the “load_dat_TimeDomain” function Last thing: I located the developer guide I couldn’t find during the meeting and placed it back where I thought it was (guides/DeveloperGuide/ModuleDeveloperGuide.pdf). I’m underlining this document because this is maybe the most important one of the whole project since it’s where people that want to collaborate after it’s made public will go to. The goal of this document is to take people by the hand and help them making their additions compatible with the whole project. For now this document only talks about adding data. Best, Pierre Pierre Bouvet, PhD Post-doctoral Fellow Medical University Vienna Department of Anatomy and Cell Biology Wahringer Straße 13, 1090 Wien, Austria On 28/2/25, at 14:18, Carlo Bevilacqua via Software <software@biobrillouin.org> wrote: Hi all, I made a file describing the file format, you can find it here. I think that attributes are easy to add and names of groups/datasets can be changed (if they are unclear now), so these are details that we don't need to discuss now. What I find most important to agree on now is the general structure. In that sense that are still some points under discussion between me and Pierre, but hopefully we can iron them out during the meeting. Talk to you in a bit, Carlo On Wed, Feb 26, 2025 at 23:56, Kareem Elsayad <kareem.elsayad@meduniwien.ac.at> wrote: Hi Carlo, Sounds great! Yes, Fri 28th @3pm still works for me. If it works for others, here is Zoom we can use: https://us02web.zoom.us/j/5191046969?pwd=alpzaldoZEd3N2ZEQ0hYZU1RR1dOdz09 Meeting ID: 519 104 6969 Passcode: jY3zH8 All the best, kareem From: Carlo Bevilacqua via Software <software@biobrillouin.org> Reply to: Carlo Bevilacqua <carlo.bevilacqua@embl.de> Date: Wednesday, 26. February 2025 at 20:43 To: Kareem Elsayad <kareem.elsayad@meduniwien.ac.at> Cc: "software@biobrillouin.org" <software@biobrillouin.org> Subject: [Software] Re: [EXTERN] Re: Software manuscript / BLS microscopy Hi Kareem, thank you for your email. We are discussing with Pierre about the details of the file format and hopefully by our next meeting we will have agreed on a file format and we can divide the tasks. If it is still an option, Friday 28th at 3pm works for me. Best regards, Carlo On Mon, Feb 24, 2025 at 03:17, Kareem Elsayad <kareem.elsayad@meduniwien.ac.at> wrote: Dear All, I (and Robert) were hoping there would be some consensus on this h5 file format. Let us do a Zoom on Fri 28th Feb at 15:00? A couple of points pertaining to arguments… Firstly, the precise structure is not worth getting into big arguments or fuss about…as long as it contains all the information needed for the analysis/representation, and all parties can work with (able to write and read knowing what is what), it ultimately doesn’t matter. In my opinion better put more (optional) stuff in if that is issue, and make it as inclusive as possible. In the end this does not need to be read by analysis/representation side, and when we go through we can decide if and what needs to be stripped. It is after all the “black box” between doing the experiment and having your final plots/images. Take a look at say a Zeiss file and try figure all that’s in it (it is not ideally structured maybe, but no biologist ever cared) – that said, I am sure their team had very similar arguments concerning structure etc.! (you have as many opinions as people). Maybe the issue is that the boundary conditions were not as well defined, but I would say at this point make them more inclusive than they need to be (empty spaces cost little memory) Secondly, and following on from firstly. We need to simply agree and compromise to make any progress asap. Rather than building separate structures we need to add/modify a single existing structure or we might as well be working on independent projects. Carlo’s initially proposed structure seemed reasonable, maybe with some minor changes, and we should just go with that as a basis in my opinion. I would suggest that Pierre and Carlo have a Zoom together and try and come up with something that is acceptable to both. Like everything in life, this will involve making compromises. And then present it on 28th Feb. Quite simply, if there is no agreement we cannot do this project and in the end it doesn’t matter who is right or wrong. Finally, I hope the disagreements from both sides are not seen as negative or personal attacks –it is ok to disagree (that’s why we have so many meetings!) On the plus side we are still more effective than the Austrian government (that is still deciding who should be next prime minister like half a year after elections) 😊 All the best, Kareem From: Pierre Bouvet via Software <software@biobrillouin.org> Reply to: Pierre Bouvet <pierre.bouvet@meduniwien.ac.at> Date: Friday, 21. February 2025 at 11:55 To: Carlo Bevilacqua <carlo.bevilacqua@embl.de> Cc: <software@biobrillouin.org> Subject: [Software] Re: [EXTERN] Re: Software manuscript / BLS microscopy Hi Carlo, Thanks for your reply, here is the next pong of this ping pong series ^^ 1- I was talking indeed about the enums, but also the parameters that are defined as integers or floating point numbers and uint32. I think its easier (and that we already agreed on) having a spreadsheet with the parameters (easy to use, easy to update, easy to store and modify between two experiments using the same setup, allows to impose fixed choices for some parameters with drop-down lists, allows to detail the requirements for the attribute like its format or units and allows examples) and to just import it in the HDF5 file. >From there it’s easier to have every attribute as strings both for the import and for the concept of what an attribute is. 2- OK 3- The problem is not necessarily the number of experiments you put in the file but the number of hyper parameters you want to take into account. Let’s take an example with a doubtable sense: I want to study the effect of low-frequency temperature fluctuations on micro mechanics in active samples both eukaryote and prokaryote showing a layered structure (endothelial cells arranged in epidermis, biofilms, …) with different cell types, and as a function of aging. I would then create a file with a first range of groups for the age of the sample, then inside these groups 2 groups for eukaryote and prokaryote samples, then inside these groups N groups for the samples I’m looking at, then inside these groups M groups for the temperature fluctuations I impose, then inside these groups the individual measures I make (this is fictional, I’m scared just to think at the amount of work to have all the samples, let alone measure them), this is simply not possible with your approach I think, and even simpler experiments like to measure the Allan variance on an instrument using 2 samples is not possible with your structure I think. 4- / 5- I think the real question is what we expect to get from a wrapper: for me is to wrap the measures of a given study, to then share, link to papers, treat using new approaches… Having a structure that can wrap both a full study and an experiment is in my opinion better in the long run than forcing the format to be used with only one experiment. 6- Yes, I understand it is an identifier, but why an integer? Why not a tuple? Why not a hash? And what if there’s a bug and instead of 3 you store you store 3.0, or 2, or ‘e'? Do you imagine the amount of work to understand where this bug comes from? Assuming it’s a bug because it might very well be just an inexperienced user making a mistake and then your file is broken. The idea is good but the safer way to have this is to work with nD arrays where the dimensionality is conserved I think, or just have all the information in the same group. 7- Here again, it’s more useful for your application but many people don’t use maps, so why force them to have even an empty array for that? Plus if they need to have a dedicated array for the concentration of crosslinkers (for example), they are faced with a non-trivial solution, which means they won’t use the format. 8- Yes, we could add an additional layer, but then it means that if you don’t need it, your datasets are in plain in the group and if you need it, then you don’t have the same structure. The solution I think is to already have the treated data in a group, if you don’t need more than one group (which will be most of the time the case) then you’ll only have one group of treated data. 9- I think it’s not useful. The SNR on the other hand is useful, because in shot-noise regime it’s a marker of variance, and this is one of the ways to spot outliers from treatment (if the SNR doesn’t match the returned standard deviation on the shift of one peak, there’s a problem somewhere). 10- The std of a fit is obtained by taking the square root of the diagonalized covariant matrix returned by the fit as long as your parameters are independent (it’s super interesting actually and a little bit more complicated but it’s true enough for lorentzian, DHO, Gaussian...) 11- OK but then why not have the calibration curves placed with your measures if they are only applicable to this measure? Once again, I think having indexes that are modifiable by the user is not safe (the technical term is “idiot proof”) 12- I don’t agree, if you are capturing points at a fixed interval, then you can reconstruct the timestamp from the timestamp of the first acquisition and either the delay between two acquisitions or the timestamp of the last acquisition. Most of the time however we don’t even need this as we consider the sample to be time-invariant on the scale of our measure, so a single timestamp for all the measure is enough and is better stored as an attribute. In the special case where we are not time-invariant, then time becomes the abscissa of the measures and in that case yes, it can be a dataset, but then it’s better to not impose a fixed name for this dataset and rather let the user decide what hyper parameter is changed during he’s measure, this way the user is free to use whatever hyper parameters he feels like it. 13- OK 14- Still not clear to me. My approach is to consider an experiment to be a measure of a sample as function of one or more controlled or measured hyper parameter. So my general approach for storing experiments is have 3 files: abscissa (with the hyper parameters that vary), measure and metadata, which translates to “Raw_data”, “Abscissa_i” and attributes for this format. 15- OK, I think more than brainstorming about how to treat correctly a VIPA spectrum, we need to allow people to tell how they do it if we want this project to be used in short term, unification is a goal of this project and we will advertise it in the paper, but to be honest, I doubt people like Giuliano will run with it without second guessing it, particularly with its clinical setups, so there will be some going back and forth before we have something stable, and this means we need to allow for this back and forth to appear somewhere, I propose having it as a parameter. 16- Here I think you allow too much liberty, changing the frequency of an array to GHz is trivial and I think most people do use GHz as the unit of their frequency arrays anyway. We need to make it clear that the frequency axis is in GHz but I think we don’t need a full element for this. If you really want to specify the unit of the Frequency dataset, I would suggest putting it in its attributes in any case, and not as another element in the structure. 17- OK 18- I think it’s one way to do it but it is not intuitive: I won’t have the reflex to go check in the attributes if there is a parameter “sam_as” to see if the calibration applies to all the curves. The way I would expect it to be is using the hierarchical logic of the format: if I’m looking at a dataset in a sub-group of a group containing a calibration dataset, then I know this calibration applies to my data: Data |- Data_0 (group) | |- Calibration (dataset) | |- Data_0 (group) | | |- Raw_data (dataset) | |- Data_1 (group) | | |- Raw_data (dataset) |- Data_1 (group) | |- Calibration (dataset) | |- Data_0 (group) | | |- Raw_data (dataset) I think in this example most people would suppose Data/Data_0/Calibration applies both to Data/Data_0/Data_0/Raw_data and Data/Data_0/Data_1/Raw_data but not Data/Data_1/Data_0/Raw_data whose calibration is intuitively Data/Data_1/Calibration Once again, my approach of the structure is trying to make it intuitive and most of all, simple. For instance if I place myself in the position of someone that is willing to try “just to see how it works”, I would give myself 10s to understand how I could have a file for only one measure that complies with the new (hope to be) standard. It is my opinion as I already told you before, that your approach is too complete and therefore complex, which will inevitably lead to people not using the format unless there’s a GUI to do it for them (and even then they might not use it). I don’t want to impose my vision here, and like you I have put a lot of thinking (and testing) into building the format I propose, but I’m convinced that if we go with your structure, not only will it make it hard for anyone to understand how to use it but we’ll have problems using it ourselves. I want to repeat that I don’t have the solution, I’m just confident that my approach is much easier to conceptually understand and less restrictive than yours. In any case we can agree to disagree on that, but then it’ll be good to have an alternative backend like the one I did with your format to try and use it, and see if indeed it’s better, because if it’s not and people don’t use it, I don’t want to go back to all the trouble I had building the library, docs and GUI just to try. I don’t want to impose you anything but it would be awesome if you took the time to read the document I made and completed for you yesterday. Then you can just tell me where you think I’m missing something and you had a better solution because as you might see, I’m having problems with nearly all your structure and we can’t really use it as a starting point at this stage since most of the backend is written and the front-end is already functional for my setup (and soon Sal’s and the TFP). Best, Pierre Pierre Bouvet, PhD Post-doctoral Fellow Medical University Vienna Department of Anatomy and Cell Biology Wahringer Straße 13, 1090 Wien, Austria On 20/2/25, at 22:55, Carlo Bevilacqua <carlo.bevilacqua@embl.de> wrote: Hi Pierre, thank you for your feedback. I appreciate that you took the time to go through my definition and highlighting the critical points. I much prefer this rather than starting working with a file format where problem might arise in the future. If we understand what are the reasons behind our choices in the definition we can merge the best of the two approaches, rather than defining two "standards" for the same thing with each of them having their limitations. I will provide an answer to each of the points you raised (I gave numbers to the points in your email below, so it is easier to reference): I am not sure to which attribute you are referring specifically, but I am completely fine with text; I defined enums where I felt it makes sense to do so because there is a discrete number of options (one could always add elements at the end of an enum) I defined the attributes before we started working together and I am very much open to changing them so they reflect what you have in the spreadsheet; in the document defining the file format we can just state that the attributes and their type are defined in the excel sheet I did it this way because in my idea an individual HDF5 file corresponds to a single experiment. If you feel there is an advantage in keeping different experiments in the same file I am open to introduce your structure of subgroups; I honestly feel like this will only make the file unnecessarly large and different experiments would mostly not share much (apart from the metadata, which is anyway a small overhead in terms of filesize). Now of course the question is what you define as an 'experiment': for me different timepoints or measurements at different temperatures/angles/etc on the same sample are a single experiment and I defined the file so that it is possible to save them in a single file; measurements on different samples are not the same experiment in my original idea same as the point 3 same as before, I would put different samples in different files but happy to introduce your structure if you feel there is an advantage the index is used to uniquely identify an entry in the 'Analysed_data' table; it is important in the contest of reconstructing the image (see the definition of the 'tn/image' group) in my opinion spatial coordinates have a privileged role since we are doing imaging and having them well defined it is important to reconstruct the image; for different abscissas I defined the 'parameters' dataset (more in point 14). If one is not doing imaging this dataset can be set to an empty array or a single element (we can include this in the definition) in my idea the "Analyzed_data" group doesn't contain multiple treatments but the result of the fit on the 'final' spectra, which are unique; if you are referring to the 'n' in the 'Shift_n_GHz' that is included in case a multipeak fit is performed. Now, if we want to include the possibility of multiple treatments like you are doing (which I didn't originally consider) we could just add an additional layer to the hierarchy that is the amplitude of the peak from the fit. I am not sure if you didn't understand what I meant or you think it is not an useful information The fit error actually contains 2 quantities: R2 and RMSE (as defined in the type). I am not sure how you would calculate a std from a single spectrum the calibration curves are stored in the 'calibration_spectra' group with the name of the dataset matching the respective 'Calibration_index'. In our VIPA setup we are acquiring multiple calibration curves during a single acquisition to compensate for laser drift, that's why I introduced the possibility of having multiple calibration curves. Note that the 'Calibration_index' is defined as optional exactly because it might not be needed each spectrum can have its own timestamp if it is acquired from a different camera image or scan of a FP, etc that's why it needs to be a dataset. Note that it is an optional dataset good point, we can rename it to PSD that is exactly to account for the general case of the abscissa not being a spatial coordinate and it contains the values for the parameters (e.g. the angles in an angle resolved measurement). It is a dataset whose dimensions are defined in the description (happy to elaborate more if it is not clear) float is the type of each element; it is a dataset whose dimensions are defined in the description; the way to define the frequency axis in general for setups which don't have an absolute frequency (like VIPAs) is tricky and would be good to brainstorm about possibile solutions as for the name we can change it, but the problem on how to deal with the situation when one doesn't have the frequency in GHz remains. My idea here was to leave the possibility of different units because the fit and most of the data analysis can be performed even if the x-axis is not in GHz and the actual conversion of the shift to GHz can be done at the end and requires the calibration data. As in my previous point, I am happy to brainstorm different solutions to this problem it is indeed redundant with 'Analyzed_data' and I pushed a change on GitHub to correct this see point 11; also note that the group is optional (in case people don't need it) and I introduced the attribute "same_as" to avoid repeating it multiple times if it is always the same for all the 'tn' As you see we agree with some of the points or we could find a common solution, for others it was mainly a misunderstanding on what were my intentions (probably my bad in expressing them, but you could have asked if it was not clear). Hope this helps claryfing my reasoning in the file definition and I am happy to discuss all the open points. I will look in details at your newest definition that you shared in the next days. Best, Carlo On Thu, Feb 20, 2025 at 18:25, Pierre Bouvet via Software <software@biobrillouin.org> wrote: Hi, My goal with this project is to unify the treatment of BLS spectra, to then allow us to address fundamental biophysical questions with BLS as a community in the mid-long term. Therefore my principal concern for this format is simplicity: measure are datasets called “Raw_data”, if they need one or more abscissa to be understood, this/these abscissa are called “Abscissa_i” and they are placed in groups called “Data_i” where we can store their attributes in the group’s attributes. From there, I can put groups in groups to store an experiment with different ... (e.g. : samples, time points, positions, techniques, wavelengths, patients, …). This structure is trivial but lacks usability so I added an attribute called “Name” to all groups that the user can define as he wants without impacting the structure. Now here are a few critics on Carlo’s approach. I didn’t want to share them because I hate criticizing anyone’s work, and I do think that what Carlo presented is great, but I don’t want you to think that I just trashed what he did, to the contrary, it’s because I see limitations in his approach that I tried developing another, simpler one. So here are the points I have problems with in Carlo’s approach: The preferred type of the information on an experiment should be text as we’ll likely see new devices (like your super nice FT approach) appear in the next months/years that will require new parameters to be defined to describe them. I think we should really try not to use anything else than strings in the attributes. The experiment information should not be defined by the HDF5 file structure but rather by a spreadsheet because everyone knows how to use Excel, and it’s way easier to edit an Excel file than an HDF5 file. Experiment information should apply to measures and not to files, because they might vary from experiment to experiment, I think their preferred allocation is thus the attributes of the groups storing individual measures (in my approach) The characterization of the instrument might also be experiment-dependent (if for some reason you change the tilt of a VIPA during the experiment for example), therefore having a dedicated group for it might not work for some experiments The groups are named “tn” and the structure does not present the nomenclature of sub-groups, this is a big problem if we want to store in the same format say different samples measured at different times (the logic patch would be to have sub-groups follow the same structure so tn/tm/tl/… but it should be mentioned in the definition of the structure) The dataset “index” in Analyzed_data is difficult to understand, what is it used for? I think it’s not useful, I would delete it. The "spatial position" in Analyzed_data supposes that we are doing mappings. This is too restrictive for no reason, it’s better to generalize the abscissa and allow the user to specify a non-limiting parameter (the “Name” attribute for example) with whatever value he wants (position, temperature, concentration of whatever, …). A concrete example of a limit here: angle measurements, I want my data to be dependent on the angle, not the position. Having different datasets in the same “Analyzed_data” group corresponding to the result of different treatments raises the question of where the process followed to treat the data is stored. A better approach would be to create n groups “Analyzed_data_n” with only one dataset of treated values, allowing for the process to be stored in the attributes of the group Analyzed_data_n I don’t understand why store an array of amplitude in “Analyzed_data”, is it for the SNR? Then maybe we could name this array “SNR”? The array “Fit_error_n” is super important but ill defined. I’d rather choose a statistical quantity like the variance, standard deviation (what I think is best), least-square error… and have it apply to both the Shift and Linewidth array as so: “Shift_std” and “Linewidth_std" I don’t understand “Calibration_index”: where are the calibration curves? Are they in “experiment_info”? If so, we expect people to already process their calibration curves to create an array before adding them to the hdf5 file? I’m not very familiar with all devices, so I might not see the limitations here but do we ever have more than one calibration curve per measure? Could we not add it to the group as a “Calibration” dataset? Or just have one group with the calibration curve? Timestamp is typically an attribute, it shouldn’t be present inside the group as an element. In tn/Spectra_n , “Amplitude” is the PSD so I would call it PSD because there are other “Amplitude” datasets so it’s confusing. If it’s not the PSD, I would call it “Raw_data”. I don’t understand what “Parameters” is meant to do in tn/Spectra_n, plus it’s not a dataset so I would put it in attributes or most likely not use it as I don’t understand what it does. Frequency is a dataset, not a float (I think). We also need to have a place where to store the process to obtain it. In VIPA spectrometers for instance this is likely a big (the main even I think) source of error. I would put this process in attributes (as a text). I don’t think “Unit” is useful, if we have a frequency axis, then we should define it directly in GHz, and if it’s a pixel axis, then for one we should not call it “Frequency” and then it’s better not to put anything since by default we will consider the abscissa (in absence of Frequency) as a simple range of the size of the “Amplitude” dataset. /tn/Images: it’s a good idea, but I believe this is redundant with “Analyzed_data” (?) If it’s not then I don’t understand how we get the datasets inside it. “Calibration_spectra” is a separate group, wouldn’t it be better to have it in “Experiment_info” in the presented structure? Also might scare off people that might not want to store a calibration file every time they create a HDF5 file (I might or might not be one of them) Like I said before, I don’t want this to be taken as more than what lead me to defining a new approach to the format. I want to state once again that Carlo's structure is complete, only it’s useful for specific instruments and applications, and difficultly applicable to other techniques and scenarios (and more lazy people like myself). Following Carlo’s mail, I’ve also completed the PDF I made to describe the structure I use in the HDF5_BLS library, I’m joining it to this email and pushing its code to GitHub, feel free to edit it and criticize it at length (I feel like I deserve it after this email I really tried not to write). Best, Pierre Pierre Bouvet, PhD Post-doctoral Fellow Medical University Vienna Department of Anatomy and Cell Biology Wahringer Straße 13, 1090 Wien, Austria On 20/2/25, at 16:12, Robert Prevedel via Software <software@biobrillouin.org> wrote: Dear all, great to see all this discussion in this thread, and thanks to especially Pierre and Carlo for driving this forward. I’ve been following the various emails and arguments closely but simply didn’t have any time to chip in due to some important committments in the past days. I understand that there was a bit of a disagreement about what the focus of this effort should be, so maybe it just helps to highlight my lab's view on this (which I just discussed in depth with Carlo and Sebastian): Our original motivation was to come up with and define a common file-format, as we regard this to be key to unify the processing and visualization of Brillouin data by the community. In this respect, we would be happy to focus our efforts on defining this format and taking care of implementing the necessary processing/visualization software and interface that allows anyone to look at the data in the same way. We also regard this to be crucial if we want to standardize the reporting of Brillouin data from diverse setups/users/applications. Therefore, at this stage it would be extremely important to agree on the structure of the file format. Carlo has proposed a very well thought-through structure for this, and it would be great to get your concrete feedback on this, as I understand this hasn’t really happened yet. To aid in this, e.g. Pierre and/or Sal could try to convert or save your standard data into this structure, and report on any difficulties or ambiguities that he encounters. Based on this I agree it’s best to meet and discuss and iron this out as a next step, however it either has to be next week (ideally Fri?), or after March 12 as I am travelling back-to-back in the meantime. Of course feel free to also meet without me for more technical discussions if this speeds up things. Either way we could then also discuss the file format etc. for the ‘raw’ data that Pierre proposed (and which is indeed very valuable as well). Let me know your thoughts, and let’s keep up the great momentum and excitement on this work! Best, Robert -- Dr. Robert Prevedel Group Leader Cell Biology and Biophysics Unit European Molecular Biology Laboratory Meyerhofstr. 1 69117 Heidelberg, Germany Phone: +49 6221 387-8722 Email: robert.prevedel@embl.de http://www.prevedel.embl.de On 20.02.2025, at 10:29, Carlo Bevilacqua via Software <software@biobrillouin.org> wrote: Hi Kareem, thanks for the suggestion, I agree that it is a good (and easy) way to divide the tasks! Just to be clear, it is not that I don't see the need/advantage of providing some standard treatment going from raw data to standard spectra, it is just that was not my priority when proposing the idea of a unified file format. Regarding the file format, splitting the one containing the raw data and the treatments from the one containing the spectra and the image in a standard format might be a good solution and we can always merge them at a later stage. As for the file containing the "standard" spectra, it would be very helpful if you can give some feedback on the structure I originally proposed. Keep in mind that the idea is to be able to associate spectrum/spectra to each pixel in the image, in a way that is independent of the scanning strategy and underlaying technique. I tried to find a solution that works for the techniques I am aware of, considering the peculiarities (e.g. for most VIPA setups there is no absolute frequency axis but only relative to water). If am happy to discuss why I made some specific choices and if you see a better way to achieve the same or see things differently. Both the 3rd and the 4th of March work for me. Best, Carlo On Thu, Feb 20, 2025 at 02:50, Kareem Elsayad via Software <software@biobrillouin.org> wrote: Dear All, (and I guess especially Carlo & Pierre 😊) I understand both your (main) points concerning what this all should be, and I think this is actually perfect for dividing tasks. The format of the hf or bh5 file being where things meet and what needs to be agreed on. The thing with raw data is ofcourse that it is variable between instruments and labs, and the conversion to “standard spectra” that can then be fitted etc. is going to be unique (maybe even between experiments in same project). That said, asking people to create some complex file from their data that works with a developed software is also unlikely to get a following. So (the way I see it) there are basically two parts. Getting from raw data to h5 (or bh5) format which contains the spectra in standard format. And then the whole analysis part and visualization (GUI, pretty features, etc.). While the latter may get the spotlight, it obviously relies heavily on the former being done right. Given that there are numerous “standard” BLS setup implementations the development of software for getting from raw data to h5 I think makes sense, since the h5 will no doubt be cryptic, and creating a working h5 is not something everyone will want to program by themselves (it is not an insignificant step given we are also trying to ultimately cater to biologists). As such a software that generates the h5 files, with drag and drop features and entering system parameters, for different setups makes sense and will save many labs a headache if they don’t have a good programmer on hand. So I would suggest that Pierre & Sal lead the work on developing this, while Carlo & Sebastian lead the work on developing the analysis/interface-presentation part. This way things are nicely divided and we just need to agree on the h5 file that is transferred between the two. From the side of Pierre & Sal there could maybe also be a second h5 generated that contains all the raw data and details on how it was converted to the transferred h5 file (for complete transparency this could then also be reported in papers if people wish). These could exist as two separate programs with respective GUIs but also eventually combined to a single one. How does this sound to everyone? To clear up details and try assign tasks going forward how about a Zoom first week of March (I would be free Monday 3rd and Tue 4th after 1pm)? All the best, Kareem From: Carlo Bevilacqua via Software <software@biobrillouin.org> Reply to: Carlo Bevilacqua <carlo.bevilacqua@embl.de> Date: Wednesday, 19. February 2025 at 20:43 To: Pierre Bouvet <pierre.bouvet@meduniwien.ac.at> Cc: <software@biobrillouin.org> Subject: [Software] Re: [EXTERN] Re: Software manuscript / BLS microscopy Hi Pierre, I realized that we might have slightly different aims. For me the most important part of this project is to have a unified file format that can be read and visualized by a standard software. The file format you are proposing is not sufficient for that in my opinion. For example one of my main motivation was to have an interface where the user can see the reconstructed image, click on a pixel, see the corresponding spectrum to check its quality and maybe try different fitting functions; that would already not be possible with your structure because the software would have no notion on where the spectral data is stored and how to associate it to a specific pixel. I don't see the structure of the file to be too complex as an issue, as long as it is functional: we can always provide an API and/or a GUI that allow people to take their spectra and save them in whatever format we decide without bothering about understanding the actual structure, the same way you can work with HDF5 file without having any understanding on how the data is actually stored on the disk. My idea of making a webapp as a GUI follows directly from there. Typical case: I sent some data to a collaborator and they can just run the app in their browser and check if the outliers they see in the image are real or a bad spectra. Similarly if we make a common database of Brillouin spectra, people can explore it easily using the webapp. From what I understood, you are instead more interested in going from raw data to an actual spectrum, which I don't see so much as a priority because each lab has their own code already and the actual procedure would be different for each lab (apart from standard instruments like the FP). I am not saying this should not be part of the software but not as a priority and rather has a layer where people can easily implement their own code (of course we could already implement code for standard instruments). I think it would be good to cleary define what is our common aim now, so we are sure we are working in the same direction. Let me know if you agree or I misunderstood what is your idea. Best, Carlo On Wed, Feb 19, 2025 at 16:11, Pierre Bouvet <pierre.bouvet@meduniwien.ac.at> wrote: Hi, I think you're trying to go too far too fast. The approach I present here is intentionally simple, so that people can very quickly get to storing their data in a HDF5 file format together with the parameters they used to acquire them with minimal effort. The closest to what you did is therefore as follows: - data are datasets with no other restriction and they are stored in groups - each group can have a set of attribute proper to the data they are storing - attributes have a nomenclature imposed by a spreadsheet and are in the form of text - the default name of a data is the name of a raw data: “Raw_data”, other arrays can have whatever name they want (Shift_5GHz, Frequency, ...) - arrays and attributes are hierarchical, so they apply to their groups and all groups under it. This is the bare minimum to meet our needs, so we need to stop here in the definition of the format since it’s already enough to have the GUI working correctly, and therefore the first version of the unified software advertised. Of course we will have to refine things later on, but we don’t want to scare people off by presenting them a file description that for one might not match their measurements and that is extremely hard to conceptually understand. To make my point clearer, take your definition of the format for example: there are 3 different amplitude arrays in your description, two different shift arrays and width arrays that are of different dimension, then we have a calibration group on one side but a spectrometer characterization array in another group that is called “experiment_info”, that’s just too complicated to use correctly. On the other hand, placing your raw data “as is” in a group dedicated to this data is conceptually easy and straightforward. Where you are right, is that should we have hundreds of people using it, we might in a near future want to store abscissa, impulse responses, … in a standardized manner. In that case, the question falls down to either adding sub-groups or storing the data together with the measure. Both are fine and don’t really pose a problem for now, essentially because we are not trying to visualize the results but just trying to unify the way to get them. Now regarding Dash, if I understand correctly, it’s just a way to change the frontend you propose? If that’s so, why not, but then I don’t really see the benefits: if you really want to use dash, you can always embed it inside a Qt app. Also Dash being browser based, you will only have one window for the whole interface, which will be a pain to deal with if you want to use the interface to do everything the GUI is expected to do (inspect an H5 file, convert PSD, treat data, edit parameters, inspect a failed treatment, simulate results using setups with slight changes of parameters…). We agree that at one point when people receive an h5 file, it will be useful to have a web interface that can do what yours or Sal’s GUI do (seeing the mapping results together with the spectrum, eventually the time-domain signal) but here again, it’s going too far too soon: let’s first have a simple and reliable GUI that can convert data from any spectrometer to PSDs and treat them with a unified code. This is the real challenge, visualization and nomenclature of results are both important but secondary. Also keep in mind that, the frontend can easily be generated by anyone really, with Copilot or ChatGPT or whatever AI, but you can’t ask them to develop the function that will correctly read your data and convert them to a PSD nor treat the PSD. This is done on the backend and is the priority since the unification essentially happens there. Best, Pierre Pierre Bouvet, PhD Post-doctoral Fellow Medical University Vienna Department of Anatomy and Cell Biology Wahringer Straße 13, 1090 Wien, Austria On 19/2/25, at 13:21, Carlo Bevilacqua <carlo.bevilacqua@embl.de> wrote: Hi Pierre, thanks for your reply. Regarding the file structure, what I am still not very clear about is what you define as Raw_data and data, how the actual spectra are stored and how the association to spatial coordinates and parameters is made. That's why I would really appreciate if you could make a documentsimilar towhat I did, where it is clear what each group should (or can) contain, what is the shape of each dataset, which attributes they have, etc... I am not saying that this should be the final structure of the file but I strongly believe that having it written in a structured way helps defining it and seeing potential issues. Regarding the webapp, it works by separating the frontend, which run in the browser and is responsible of running the GUI, and the backend which is doing the actual computation and that you can structure as you like with multithreading or any optimization you wish. The communication between frontend and backend is handled transparently by the framework, so you don't have to take care of it. When you run Dash locally a local server is created so the data stays on your computer and there is no issue with data transfer/privacy. If we want to move it to a server at a later stage, then you are right about the fact that data needs to be transferred to a server (although there might be solutions that allow you to still run the computation on the local browser, like WebAssembly, but I think it is too complex to look into this at this stage). Regarding safety and privacy, the data will be stored on the server only for the time that the user is using the app and then deleted (of course we will need to make a disclaimer on the website about this). Regarding space I don't think people at the beginning will load their 1Tb dataset on the webapp but rather look at some small dataset of few tens of Gb; in that case 1Tb of server space is more than enough (remember that the file will be stored only for the time the user is using the app). If people really start to use the webapp and space becomes a limitation, I would be super happy to look into WebAssembly so that the data can be handled locally from the browser without transferring it to the server. To summarize I would agree that, at this stage, there might be no advantage of a webapp over a local GUI (and might actually be a bit more work to develop it). But, if this project really flies, the potential of a webapp is huge, especially in the context of the BioBrillouin society where we want to have a database of spectral data and the webapp could be used to explore that without downloading anything on your computer. My main point is that moving now to a webapp would not be too much work, but if we want to do it at a later stage it will basically entail re-writing everything from scratch. Let me know what are your thoughts about it. Best, Carlo On Wed, Feb 19, 2025 at 08:51, Pierre Bouvet <pierre.bouvet@meduniwien.ac.at> wrote: Hi Carlo, You’re right, the format is still a little fuzzy. The main idea is to have a data-based hierarchy for storage: each data is stored in an individual group. From there, abscissa dependent on the data are stored in the same group and the treated data are stored in sub-groups. The names of the groups and sub-groups are fixed (Data_i), as is the name of the raw data (Raw_data) and abscissa (Abscissa_i). Also, the measure and spectrometer-dependent arguments have a defined nomenclature. To differentiate groups between them, we preferably attribute them a name as an attribute that is not used as an identifier, the identifier being either the path to the data/group from file root (Data_0/Data_42/Data_2/Raw_data) or potentially a hash value (not implemented). This I think allows all possible configurations, and using an hierarchical approach we can also pass common attributes and arrays (parameters of the spectrometer or abscissa arrays for example) on parent to reduce memory complexity. Now regarding the use of server-based GUI, first off, I’ve never used them so I’m just making supposition here but if the platform is able to treat data online, it will have to store the spectra somewhere in memory and it will not be local. My primary concerns with this approach is safety, particularly in terms of intellectual property protection, ethical considerations, and potential security vulnerabilities. Additionally, managing storage space will be a headache. Now, this doesn’t mean that we can’t have a server-based data plotter, or a server-based interface that does treatments locally but I don’t really see the benefits of this over a local software that can have multiple windows, which could at one point be multithreaded, and that could wrap c code to speed regressions for example (some of this might apply to Dash, I’m not super familiar with it). Now regarding memory complexity, having all the data we treat go on a server is a bad idea as it will raise the question of cost which will very rapidly become a real problem. Just an example: for a 100x100 map, I need 10Gb of memory (1Mo/point) with my setup (1To of archive storage is approximately 1euro/month) so this would get out of hands super fast assuming people use it. Now maybe there are solutions I don’t see for these problems and someone can take care of them but for me it’s just not worth the effort when having a local GUI solves all of these issues at once. But if you find a solution, then I’ll be happy to migrate to Dash, it won’t be fast to translate every feature but I can totally join you on the platform. Best, Pierre Pierre Bouvet, PhD Post-doctoral Fellow Medical University Vienna Department of Anatomy and Cell Biology Wahringer Straße 13, 1090 Wien, Austria On 18/2/25, at 20:26, Carlo Bevilacqua <carlo.bevilacqua@embl.de> wrote: Hi Pierre, regarding the structure of the file, I agree that we should keep it simple. I am not suggesting to make it more complex, rather to have a document where we define it in a clear and structured way rather than as a general description, to make sure that we are all on the same page. I am saying this because, to be honest, I am not sure I fully understand how you are structuring the HDF5 and I think it is important to agree on this now, rather than finding at a later stage that we had different ideas. Ideally if the GUI should be part of a single application, we should write it using a unified framework. The reasons why, after considering it for a bit, I lean towards Dash rather than Qt are: it can run in a web browser so it will be easy to eventually move it to a website, thus people can use it without installing it (which will hopefully help in promoting its use) it is based on plotlywhich is a graphical library with very good plotting capabilites and highly customizable, that would make the data visualization easier/more appealing Let me know what you think about it and if you see any advantage of Qt over a web app which I am not considering. Also, if we agree that Dash might be a better option, would you consider migrating to Dash? It might not be too much work if most of the code you wrote is for data processing rather that for the GUI itself and I could help you with that. Alternatively one workaround is to have a QtWebEngine in your Qt app and have the Dash app run inside that, but that would make only the Dash part portable to a server later on. Best, Carlo On Tue, Feb 18, 2025 at 10:24, Pierre Bouvet <pierre.bouvet@meduniwien.ac.at> wrote: Hi, Thanks, More than merge them later, just keep them separate in the process and rather than trying to build "one code to do it all", build one library and GUI that encapsulate codes to do everything. Having a structure is a must but it needs to be kept as simple as possible else we’ll rapidly find situations where we need to change the structure. The middle ground I think is to force the use of hierarchies and impose nomenclatures where problem are expected to appear: each dataset has its own group, each group can encapsulate other groups, each parameter of a group applies to all its sub-groups if the subgroup does not change its value, each array of a group applies to all of its sub-groups if the sub-group does not redefine an array with same name, the names of the groups are held as parameters and their ID are managed by the software. For the Plotly interface, I don’t know how to integrate it to Qt but if you find a way to do it, that’s perfect with me :) My vision of the GUI is something that unifies the format and can then execute scripts on the data stored in this format. I have pushed the application of the GUI to my data up to the point where I can do the whole information extraction process from it (add data, convert to PSD, fit curves). I think this could be super interesting if we implement it for all techniques. I think we could formalize the project in milestones, in particular define the minimal denominator that will allow us to have the paper. The milestone I reached for my spectro encompasses the following points: - Being able to add data to the file easily (by dragging & dropping to the GUI) - Being able to assign properties to these data easily (again by dragging & dropping) - Being able to structure the added data in groups/folders/containers/however we want to call it - Making it easy for new data types to be loaded - Allowing data from same type but different structure to be added (e.g. .dat files) - Execute scripts on the data easily and allowing parameters of these scripts to be defined from the GUI (e.g. select a peak on a curve to fit this peak) - Make it easy to add scripts for treating or extracting PSD from raw data. - Allow the export of a Python code to access the data from the file (we cans see them as “break points” in the treatment pipeline) - Edit of properties inside the GUI In any case I think we could build a spec sheet for the project with what we want to have in it based on what we want to advertise in the paper. We can always add things later on but if we agree on a strict minimum to have the project advertised, then that will set its first milestone on which we’ll be able to build later on. Best, Pierre Pierre Bouvet, PhD Post-doctoral Fellow Medical University Vienna Department of Anatomy and Cell Biology Wahringer Straße 13, 1090 Wien, Austria On 17/2/25, at 14:53, Carlo Bevilacqua via Software <software@biobrillouin.org> wrote: Hi Pierre, hi Sal, thanks for sharing your thoughts about it. @Pierre I am very sorry that Ren passed away :( As far as I understood you are suggesting to work on the individual aspects separately and then merge them together at a later stage? I am fine with that but I still think it is very important to now agree on what should be in the file format we are defining, because that is kind of the core of the project and will affect a lot of the design choices. I am happy to start working on the GUI for data visualization. In my idea, it will be something similar tothisbut written in dash, so it is a web app that for now can run locally (so no transfer of data to an external server is required) but in the future can easily be uploaded to a website that people can just use without installing anything on their computer. The question is how much of the data processing should be possible to do (or trigger) from the same GUI? I think at least a drop down menu with different fitting functions should be there, so the user can quickly check the results on a spectrum from a specific point in the image. @Pierre how are you envisioning the GUI you are working on? As far as I understood it is mainly to get the raw data and save it to our HDF5 format with some treatment on it. One idea could be to have a shared list of features that we are implementing in the GUI as we work on it, to avoid having the same functionality duplicated (or worst inconsistent) between the GUI for generating our file format and the GUI for visualization. Let me know what you think about it. Best, Carlo On Mon, Feb 17, 2025 at 11:04, Pierre Bouvet via Software <software@biobrillouin.org> wrote: Hi everyone, Sorry for the delayed response, I just went through the loss of Ren (my dog) and wasn’t at all able to answer. First of, Sal, I am making progress and I should have everything you have made on your branch integrated to the GUI branch soon, at which point I will push everything to main. Regarding the project, I think I align with Sal: keep things as simple as possible. My approach was to divide everything in 3 mostly independent layers: - Store data in an organized file that anyone can use, and make it easy to do - Convert these data into something that has physical significance: a Power Spectrum Density - Extract information from this Power Spectrum Density Each layer has its own challenge but they are independent on the challenge of having people using it: personally, if I had someone come to me with a new software to play with my measures, I would most likely only look at it for 1 minute (or less depending who made it) with a lot of apprehension and then based on how simple it looks and how much I understood of it, use it or - what is most likely - discard it. This is why Project.pdf is essentially meant to say: we put data arrays in groups and give them attributes written in text, but you can also create groups within groups to organize your data! I believe most of the people in the BioBrillouin society will have the same approach and before having something complex that can do a lot, I think it’s best to have something simple that can just unify the format (which in itself is a lot) and that people can use right away with a minimal impact on their own individual pipelines for data processing. To be honest, I don’t think people will blindly trust our software at first to treat their data, but they will most likely use it at first to organize their raw spectra, and maybe add their own treated data if they are feeling particularly adventurous. But that is not a problem as long as we start a movement. From there yes, we can complexity and create custom file architectures but that is already too complex I think for this first project. If we can all just import our data to the wrapper and specify their attributes, this will already be a success. Then for the paper, if we can all add a custom code to treat these data to obtain a PSD, I think this will be enough. As I said, the current API already allows you to add your data in a variety of format, so it’s just a question of developing the PSD conversion before having something we can publish (and then tell people to use). A few extra points: - Working with my setup, I realized if the user could choose between different algorithms to treat their own data, it would make the overall project much more usable (if an algorithm bugs for whatever reason, you can use another one) so I created 2 bottle necks in the form of functions (for PSD conversion and treatment) that would inspect modules dedicated to either PSD conversion or treatment, and list existing functions. It’s in between classical and modular programming but it makes the development of new PSD conversion code and treatment way way easier - The GUI is developed using oriented-object programming. Therefore I have already made some low-level choices that kind of impact all the GUI. I’m not saying they are the best choices, I’m just saying that they work, so if you want to work on the GUI, I would either recommend getting familiar with these choices, or making sure that all the functionalities are preserved, particularly the ones that are invisible (logging of treatment steps, treatment errors…) I’ll try merging the branches on Git asap and will definitely send you all an email when it’s done :) Best, Pierre Pierre Bouvet, PhD Post-doctoral Fellow Medical University Vienna Department of Anatomy and Cell Biology Wahringer Straße 13, 1090 Wien, Austria On 14/2/25, at 19:36, Sal La Cavera Iii via Software <software@biobrillouin.org> wrote: Hi all, I agree with the things enumerated and points made by Kareem/Carlo! I guess I would advocate for starting from a position of simplicity. We probably don't want to get weighed down by trying to include a bunch of bells and whistles from the start as these can be easily added once there is a minimally viable stable product. As long as data can be loaded to local memory, then treated in various (initially simple) ways through the GUI (and maybe maintain non-GUI compatibility for command-line warriors like myself), then the bh5 formatting stuff can be sorted on the back end? I definitely agree with Carlo's structure set out in the file format document; but all of that data will be floating around the memory in some shape or form and just needs to be wrapped up and packaged (according to Carlo's structure e.g.) when the user is happy and presses the "generate h5 filestore" etc. (?) Definitely agree with the recommendation to create the alpha using mainly requirements that our 3 labs would find useful (import filetypes, treatments, etc), and then we can add on more universal functionality second / get some beta testers in from other labs etc. I'm able to support on whatever jobs need doing and am free to meet in the beginning of March like you mentioned Kareem. Hope you guys have a nice weekend, Cheers, Sal --------------------------------------------------------------- Salvatore La Cavera III Royal Academy of Engineering Research Fellow Nottingham Research Fellow Optics and Photonics Group University of Nottingham Email: salvatore.lacaveraiii@nottingham.ac.uk ORCID iD: 0000-0003-0210-3102 <Outlook-tygjxucs.png> Book a Coffee and Research chat with me! From: Carlo Bevilacqua via Software <software@biobrillouin.org> Sent: 12 February 2025 13:31 To: Kareem Elsayad <kareem.elsayad@meduniwien.ac.at> Cc: sebastian.hambura@embl.de <sebastian.hambura@embl.de>; software@biobrillouin.org <software@biobrillouin.org> Subject: [Software] Re: Software manuscript / BLS microscopy You don't often get email from software@biobrillouin.org. Learn why this is important Hi Kareem, thanks for restarting this and sorry for my silence, I just came back from US and was planning to start working on this again. Could you also add Sebastian (in CC) to the mailing list? As you outlined, I would split the project into two parts: 1) getting from the raw data to some standard "processed' spectra and 2) do data analysis/visualization on that. For the second part the way I envision it is: the most updated definition of the file format from Pierre is this one, correct? In addition to this document I think it would be good to have a more structured description of the file (like this), where each field is clearly defined in terms of data type and dimensions. Sebastian was also suggesting that the document should contain the reasoning behind each specific choice in the specs and also things that we considered but decided had some issues (so in future we can look back at it). I still believe that the file format should contain the "processed" spectra (i.e. after FT and baseline subtraction for impulsive, or after taking a line profile and possibly linearization with VIPA,...) so we can apply standard data processing or visualization which is independent on the actual underlaying technique (e.g. VIPA, FP, stimulated, time domain, ...) agree on an API to read the data from our file format (most likely a Python class). For that we should: 1) decide on which information is important to extract (spectral information, spatial coordinates, hyper-parameters, metadata,...) 2) implement an interface to read the data (e.g. readSpectrumAtIndex(...), readImage(...), ...) build a GUI that use the previously defined API to show and process the data. I would say that, once we have a very solid description of the file format as in step 1, step 2 will come naturally and we can divide the actual implementation between us. Step 3 can also easily be implemented and divided between us once we have an API (and I am happy to work on the GUI myself). The first half of the project is the trickiest and I know Pierre has already done a lot of work in that direction. We should definitely agree on which extent we can define a standard to store the raw data, given the variability between labs, (and probably we should do it for common techniques like FP or VIPA) and how to implement the treatments, leaving to possibility to load some custom code in the pipeline to do the conversion. Let me know what you all think about this. If you agree I would start by making a document which clearly defines the file format in a structured way (as in my step 1 before). @Pierre could you write a new document or modify the document I originally made to reflect the latest structure you implemented for the file format? The metadata can still be defined in a separated excel sheet, as long as the data type and format is well defined there. Best regards, Carlo On Wed, Feb 12, 2025 at 02:19, Kareem Elsayad via Software <software@biobrillouin.org> wrote: Hi Robert, Carlo, Sal, Pierre, Think it would be good to follow up on software project. Pierre has made some progress here and would be good to try and define tasks a little bit clearer to make progress… There is always the potential issue of having “too many cooks in the kitchen” (that have different recipes for same thing) to move forward efficiently, something that I noticed can get quite confusing/frustrating when writing software together with people. So would be good to clearly assign tasks. I talked to Pierre today and he would be happy to integrate things in framework we have to try tie things together. What would foremost be needed would be ways of treating data, meaning code that takes a raw spectral image and meta-data and converts it into “standard” format (spectral representation) that can then be fitted. Then also “plugins” that serve a specific purpose in the analysis/rendering that can be included in framework. The way I see it (and please comment if you see differently), there are ~4 steps here: Take raw data (in .tif,, .dat, txt, etc. format) and meta data (in .cvs, xlsx, .dat, .txt, etc.) and render a standard spectral presentation. Also take provided instrument response in one of these formats and extract key parameters from this Fit the data with drop-down menu list of functions, that will include different functional dependences and functions corrected for instrument response. Generate/display a visual representation of results (frequency shift(s) and linewidth(s)), that is ideally interactive to some extent (and maybe has some funky features like looking at spectra at different points. These can be spatial maps and/or evolution with some other parameter (time, temperature, angle, etc.). Also be able to display maps of relative peak intensities in case of multiple peak fits, and whatever else useful you can think of. Extract “mechanical” parameters given assigned refractive indices and densities I think the idea of fitting modified functions (e.g. corrected based on instrument response) vs. deconvolving spectra makes more sense (as can account for more complex corrections due to non-optical anomalies in future –ultimately even functional variations in vicinity of e.g. phase transitions). It is also less error prone, as systematically doing decon with non-ideal registration data can really throw you off the cliff, so to speak. My understanding is that we kind of agreed on initial meta-data reporting format. Getting from 1 to 2 will no doubt be most challenging as it is very instrument specific. So instructions will need to be written for different BLS implementations. This is a huge project if we want it to be all inclusive.. so I would suggest to focus on making it work for just a couple of modalities first would be good (e.g. crossed VIPA, time-resolved, anisotropy, and maybe some time or temperature course of one of these). Extensions should then be more easy to navigate. At one point think would be good to involve SBS specific considerations also. Think would be good to discuss a while per email to gather thoughts and opinions (and already start to share codes), and then plan a meeting beginning of March -- how does first week of March look for everyone? I created this mailing list (software@biobrillouin.org) we can use for discussion. You should all be able to post to (and it makes it easier if we bring anyone else in along the way). At moment on this mailing list is Robert, Carlo, Sal, Pierre and myself. Let me know if I should add anyone. All the best, Kareem This message and any attachment are intended solely for the addressee and may contain confidential information. If you have received this message in error, please contact the sender and delete the email and attachment. Any views or opinions expressed by the author of this email do not necessarily reflect the views of the University of Nottingham. Email communications with the University of Nottingham may be monitored where permitted by law. _______________________________________________ Software mailing list -- software@biobrillouin.org To unsubscribe send an email to software-leave@biobrillouin.org _______________________________________________ Software mailing list -- software@biobrillouin.org To unsubscribe send an email to software-leave@biobrillouin.org _______________________________________________ Software mailing list -- software@biobrillouin.org To unsubscribe send an email to software-leave@biobrillouin.org _______________________________________________ Software mailing list -- software@biobrillouin.org To unsubscribe send an email to software-leave@biobrillouin.org _______________________________________________ Software mailing list -- software@biobrillouin.org To unsubscribe send an email to software-leave@biobrillouin.org _______________________________________________ Software mailing list -- software@biobrillouin.org To unsubscribe send an email to software-leave@biobrillouin.org _______________________________________________ Software mailing list -- software@biobrillouin.org To unsubscribe send an email to software-leave@biobrillouin.org _______________________________________________ Software mailing list -- software@biobrillouin.org To unsubscribe send an email to software-leave@biobrillouin.org This message and any attachment are intended solely for the addressee and may contain confidential information. If you have received this message in error, please contact the sender and delete the email and attachment. Any views or opinions expressed by the author of this email do not necessarily reflect the views of the University of Nottingham. Email communications with the University of Nottingham may be monitored where permitted by law. This message and any attachment are intended solely for the addressee and may contain confidential information. If you have received this message in error, please contact the sender and delete the email and attachment. Any views or opinions expressed by the author of this email do not necessarily reflect the views of the University of Nottingham. Email communications with the University of Nottingham may be monitored where permitted by law.<flat_vs_hier.py>_______________________________________________ Software mailing list -- software@biobrillouin.org To unsubscribe send an email to software-leave@biobrillouin.org _______________________________________________ Software mailing list -- software@biobrillouin.org To unsubscribe send an email to software-leave@biobrillouin.org
participants (5)
-
 Carlo Bevilacqua
 -
 Kareem Elsayad
 -
 Pierre Bouvet
 -
 Robert Prevedel
 -
 Sal La Cavera Iii